Grid mode for the
CollectionEvents
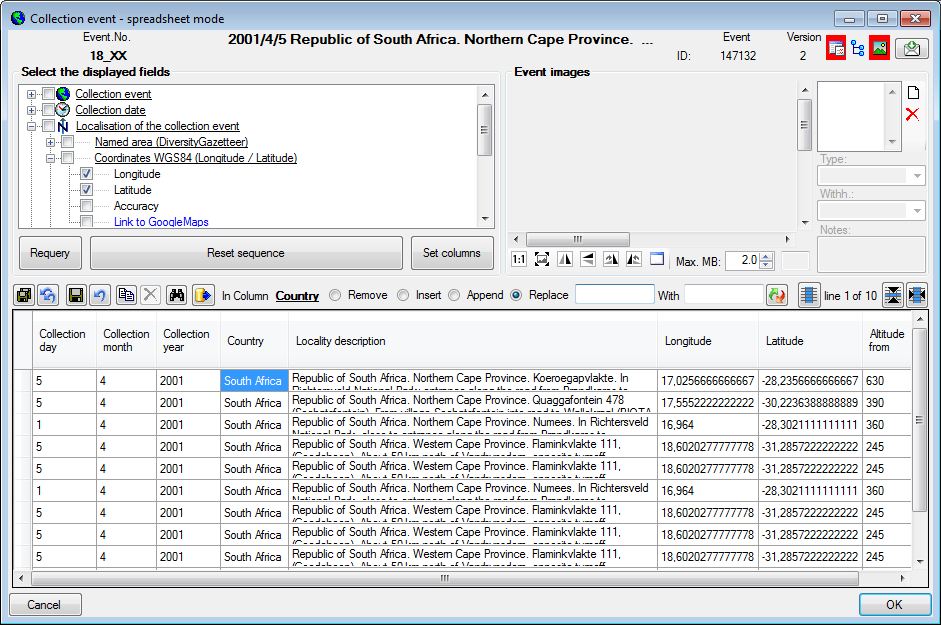
To edit the data of the CollectionEvents in a data grid
choose the Grid mode
 for the event
 from the menu. A window will open where every data set for a
CollectionEvent from
the query result list is restricted to one line. Please keep in
mind
you can only see a limited part of the data while in this view.
For example only a part of the localisation will be displayed
(see below).
from the menu. A window will open where every data set for a
CollectionEvent from
the query result list is restricted to one line. Please keep in
mind
you can only see a limited part of the data while in this view.
For example only a part of the localisation will be displayed
(see below).
Customize the window
To change the width of a column simply
use your mouse to adapt the width
to your preference. To hide or show parts of the window use the
 button for the setting of the visible columns, the
 button for the hierarchy tree and the
 button for the images in the upper right corner of the window.
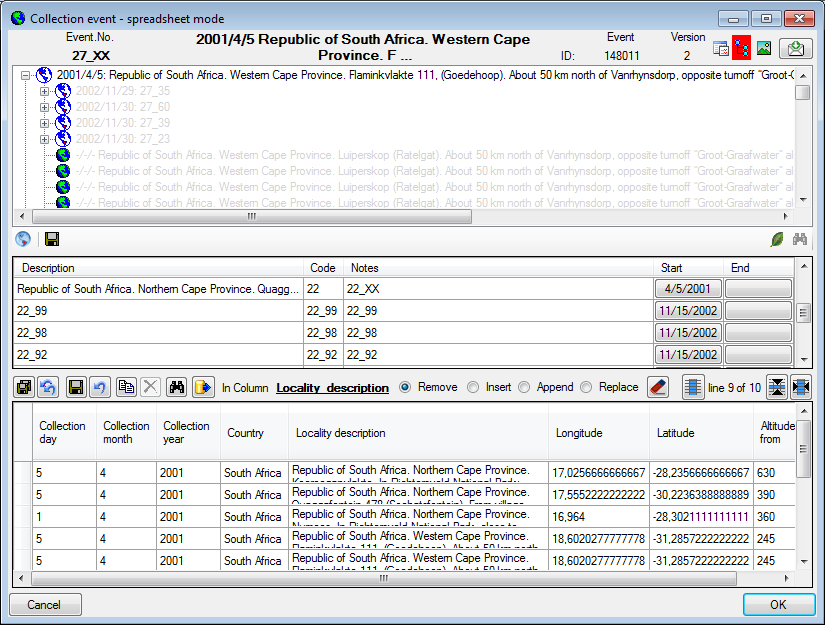
If the hierarchy
tree is visible (, see
below), you have access to the CollectionEventSeries which are
linked to the CollectionEvents.
Here you can edit the hierarchy via drag & drop. Please keep
in
mind that ramifications within the hierarchy can only be
realized using EventSeries
button for the images in the upper right corner of the window.
If the hierarchy
tree is visible (, see
below), you have access to the CollectionEventSeries which are
linked to the CollectionEvents.
Here you can edit the hierarchy via drag & drop. Please keep
in
mind that ramifications within the hierarchy can only be
realized using EventSeries
 with CollectionEvents
placed within and specimen
with CollectionEvents
placed within and specimen
 placed within the CollectionEvents. To insert a new EventSeries
use the
button below the tree.
placed within the CollectionEvents. To insert a new EventSeries
use the
button below the tree.
To change the width and sequence of the
columns simply
use your mouse to drag the columns to the position of your choice or
adapt the width
to your preference. These changes will be saved for this session as
well as for the next time you use the
grid mode. To return to the original sequence of the columns click
on the [Reset
sequence] button.
Customize visibility of fields
The selection of the visible fields
can be adapted in the tree above the list. Change the selection
of the columns
and click on the [Set columns] button.
Sorting of the
data
To sort the data in the grid
simply click in the header
of the column which you want to use as sorting column. The
sorting sequence will
be kept even if you change values in this column. This means
if you change
a value in the sorting column, the changed data set will be
placed at the new position
according to its new value. The sorting of a column will be
indicated by an arrow for
the direction of the sorting (up or down) and by a thicker
right border of this
column (see image below).
Formatting
the grid
To adapt the width of the columns or the
height of the
rows either drag the border with the mouse or double click the
border to get the optimal
size for one column. You may also click on the
 button for an optimal height of the rows or the
 button for an optimal width of the columns.
Handling the data
Find and replace
To use the find and replace functions you must either
select a part of the field in this column or click on the
 button to select the entire column. You may then choose the
function you wish to apply (remove, insert, append or replace).
To replace a part of a text in the selected fields
enter the text
which should be replaced and enter the replacement in the
corresponding fields. To start the
replacement click the
button to select the entire column. You may then choose the
function you wish to apply (remove, insert, append or replace).
To replace a part of a text in the selected fields
enter the text
which should be replaced and enter the replacement in the
corresponding fields. To start the
replacement click the
 button. To insert a
string to the
beginning of all
entries in the selected fields click the
button. To insert a
string to the
beginning of all
entries in the selected fields click the
 button. To append
a string to all
entries in the selected fields click the
button. To append
a string to all
entries in the selected fields click the
 button. To remove
all entries from the selected fields click the
button. To remove
all entries from the selected fields click the
 button.
Editing
Some columns can not be
edited directly but are linked to external modules or services.
These columns
appear as buttons. Simply click on the button to call the
service. If a value is
linked to an entry in an external module, the background will
change to
yellow
and you will not be able to change the text.
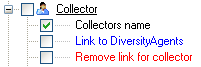
Together with the links (in the
example above
Link to DiversityAgents)
you can select columns that provide the possibility to
release the links to the modules
(e.g. Remove link
for collector in image above). These columns will
appear as buttons
 . Simply click on
the button related
to a link to release the link to the corresponding
module. After that you can edit the text field containing
the linked value.
. Simply click on
the button related
to a link to release the link to the corresponding
module. After that you can edit the text field containing
the linked value.
Some values
are linked to a list of values. Use the drop-down list to change
the value in
one of these columns.
Saving the data
To save all changes click on the
 button. To undo the all
changes since
the last time the data sets were saved click on the
button. To undo the all
changes since
the last time the data sets were saved click on the
 button. To save the
changes in the
current data set use the
button. To save the
changes in the
current data set use the
 button. To undo the changes
in the current
data set click the
button. To undo the changes
in the current
data set click the
 button. If you click the
[OK] button, you
will be asked whether you would like to save the changes before
the window will be closed. If you
click the [Cancel] button or close the window your changes will not be
saved. To export the data shown in the grid as a text file with tabs as column
separators click
on the
button. If you click the
[OK] button, you
will be asked whether you would like to save the changes before
the window will be closed. If you
click the [Cancel] button or close the window your changes will not be
saved. To export the data shown in the grid as a text file with tabs as column
separators click
on the
 button.