
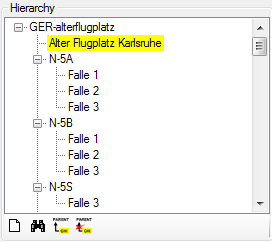
The plots may be hierarchical organised as a tree view. The location of the current plot within the hierarchy is displayed in the hierarchy window:
To add a new plot within the selected plot click on the
 button.
To change to another plot within the hierarchy tree just select the plot in the tree view and click on the
 button. The new plot will be displayed.
To set the superior plot for the current sampling plot click on the
 button.
To remove the superior plot for the current sampling plot click on the
 button.