


The
module DiversityTaxonNames provides other modules the option to
query the taxonomic names on basis of a chart. These charts are created on basis
of the selected database or checklist in case there are checklists
available. To test the chart, select Test -
Chart from the menu.
In case there are checklists a window
will open where you choose the data you want to show in the chart. A
window as shown below will open. To test the chart, select an entry and
click OK.

If there are checklists defined, you can choose either the whole database or a checklist. If you choose a checklist only the taxa within the checklist will be shown and the name of the checklist is shown in the header (see below).
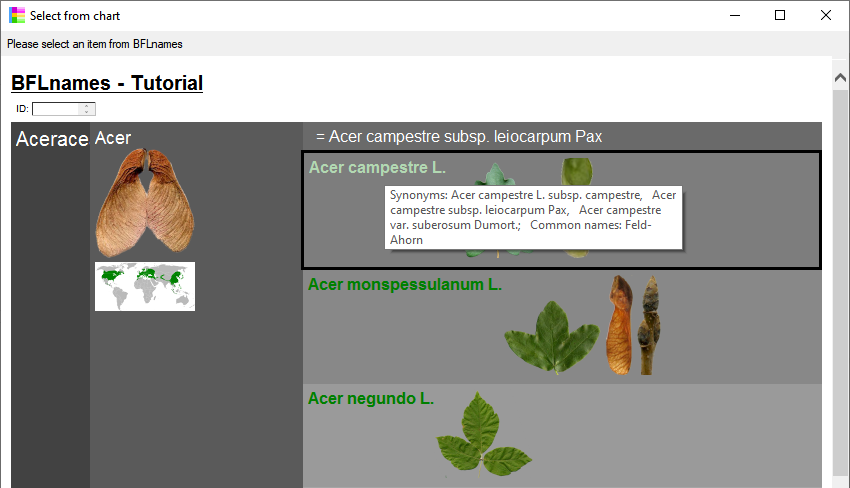

If a taxon has images, these images will be shown in the chart as shown below. The images will be shown according to the order set for the images. If a title for an image has been defined, this will be shown in the tool tip when you moove the mouse above the image. If no title has been defined either the synonyms the taxon and common names will be shown or if neither are defined the taxon (see above). The width of the images is restricted to 100 pixel, larger images will be adapted accordingly.
Accepted names are indicated by a green color while synonyms are white or black, depending on the luminance of the background.

The html files for the chart will be generated in the user directory as shown below. The file ..._ChartSelect.html is the main file. the other files like e.g. ..._ChartSelect_71_76.html are depending files that contain the items with the parent ID 71. These files will be removed when you close the chart.
The html files and the chart are adapted to the width of the window of your application, so if you change the width of your main window, the files will be regenerated to ensure that the displayed columns fit into the available space.