Matrix import wizard for sample data
After selecting Target: Sampling event
a window as shown below will be displayed. The window is separated in 3 areas. On
the left side you see the descriptor settings for the actual file column (presently
not visible). On the right side you see the list of available import steps. In the
middle part the details of the selected import steps are shown.
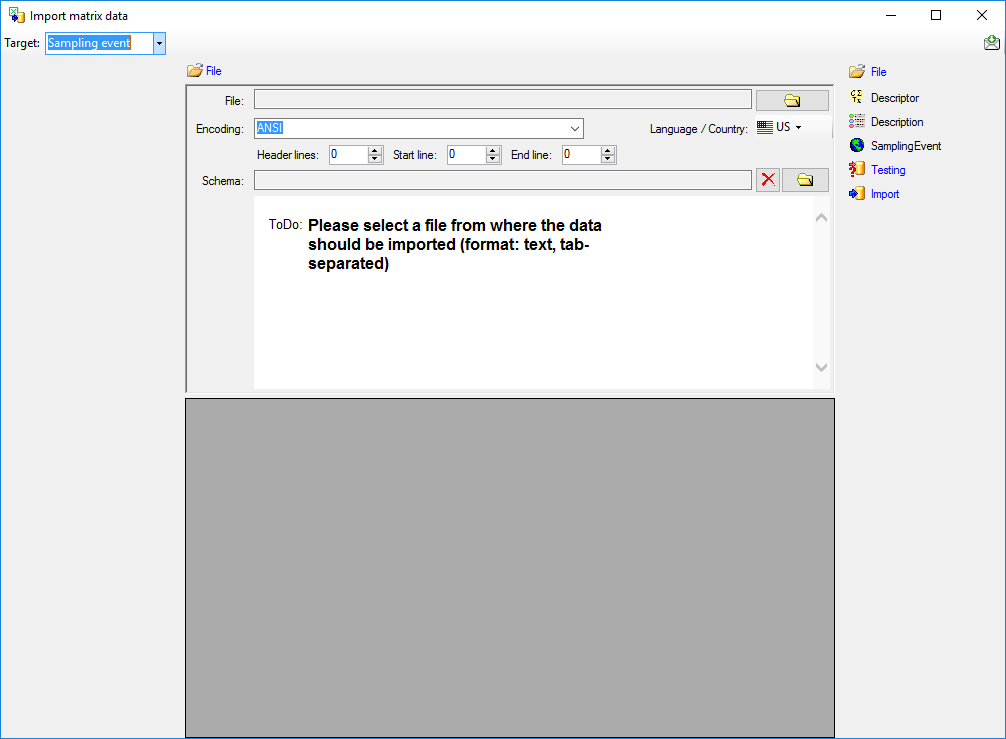
As a first step, choose the
 File from where the data should
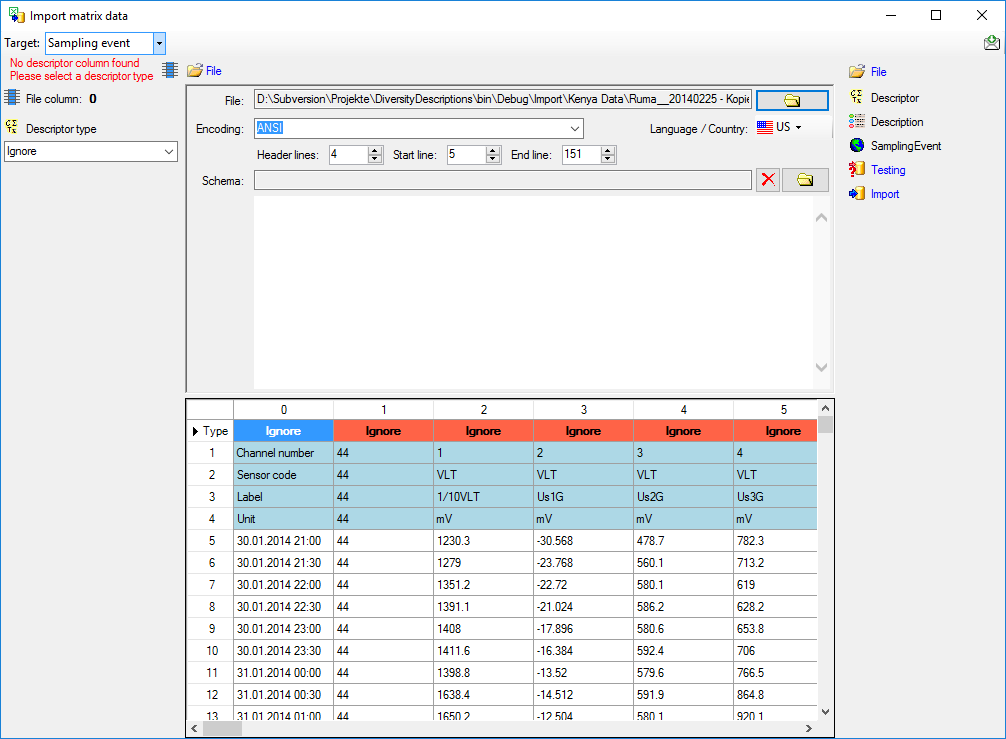
be imported. The currently supported format is tab-separated text. Then choose the
Encoding of the file, e.g. Unicode. The Header lines
specifies the number of header lines, usually at least
the first line which typically contains the descriptor names (see image below).
The Start line and End line will automatically be set according to
your data. You may change these to restrict the data lines, i.e. the descriptions/items
that shall be imported. The
not imported parts in the file are indicated with a gray background.
If your data contains e.g. date information or floating point values where notations
differ between countries (e.g. 3.14 - 3,13), choose the Language / Country
to ensure a correct interpretation of your data. Finally you can select a prepared
Schema (see sections Testing and Import below) for the import.
File from where the data should
be imported. The currently supported format is tab-separated text. Then choose the
Encoding of the file, e.g. Unicode. The Header lines
specifies the number of header lines, usually at least
the first line which typically contains the descriptor names (see image below).
The Start line and End line will automatically be set according to
your data. You may change these to restrict the data lines, i.e. the descriptions/items
that shall be imported. The
not imported parts in the file are indicated with a gray background.
If your data contains e.g. date information or floating point values where notations
differ between countries (e.g. 3.14 - 3,13), choose the Language / Country
to ensure a correct interpretation of your data. Finally you can select a prepared
Schema (see sections Testing and Import below) for the import.
Choosing the descriptor types
Choosing of the descriptor types is done in exactly the
same way as described in section Matrix
wizard for description data.
Table data
To set the source for the data columns, select the step
of a table listed underneath the File step. Be aware that for the
 Descriptor table not the file columns will be selected but the file
rows in the header lines. In the image below you see an example of the descriptor
data columns, where the values for id and label are taken from the first line in
the file. Additionally the descriptors will be assigned to the descriptor tree "Descriptor
tree for matrix".
Descriptor table not the file columns will be selected but the file
rows in the header lines. In the image below you see an example of the descriptor
data columns, where the values for id and label are taken from the first line in
the file. Additionally the descriptors will be assigned to the descriptor tree "Descriptor
tree for matrix".
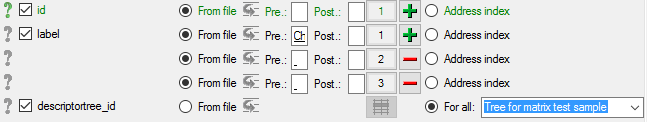
Remark: Although descriptortree_id is
a numeric value in the database, the externally visible descriptor tree name is
expected here. Since this name is unambigious, the corresponding id will be determined
during import.
The option Address index allows the selection
of the column number (for descriptor) rsp. the line number (for description or sampling
event) as value. See below an example for the
 Description table data columns. For id and label the For all:
alue "++ New description ++" was selected to create a single description
entry where all sample data are attached. Finally the description is assigned to
the project "Matrix text sample".
Description table data columns. For id and label the For all:
alue "++ New description ++" was selected to create a single description
entry where all sample data are attached. Finally the description is assigned to
the project "Matrix text sample".
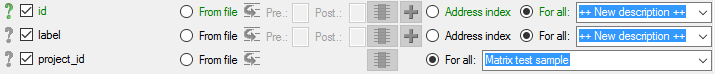
Remark: Although project_id is a numeric
value in the database, the externally visible project name is expected here. Since
this name is unambigious, the corresponding id will be determined during import.
Finally the source for the
 Sampling event table data columns must be selected. For id and label the
file column 0 has been selected (see image below).
Sampling event table data columns must be selected. For id and label the
file column 0 has been selected (see image below).

A reminder in the header line will show you what actions
are still needed to import the data into the table:
- Please select at least one decisive column
 = If data
will be imported depends on the content of decisive colums, so at least one must
be selected.
= If data
will be imported depends on the content of decisive colums, so at least one must
be selected.
- Please select the position in the file
 = The
position in the file must be given if the data for a column should be taken from
the file.
= The
position in the file must be given if the data for a column should be taken from
the file.
- From file or For all
 = For
every you have to decide whether the data are taken from the file or a value is
entered for all
= For
every you have to decide whether the data are taken from the file or a value is
entered for all
- Please select a value from the list
 = You have
to select a value from the provided list
= You have
to select a value from the provided list
The handling of the columns is almost the same as described
in the chapter columns of the table oriented
import wizard.
To test if all requirements for the import are met use
the
 Testing step. You can navigate to a certain data cell by using the Column:
and Line: controls. As an alternative select the data cell ent
click on button
Testing step. You can navigate to a certain data cell by using the Column:
and Line: controls. As an alternative select the data cell ent
click on button
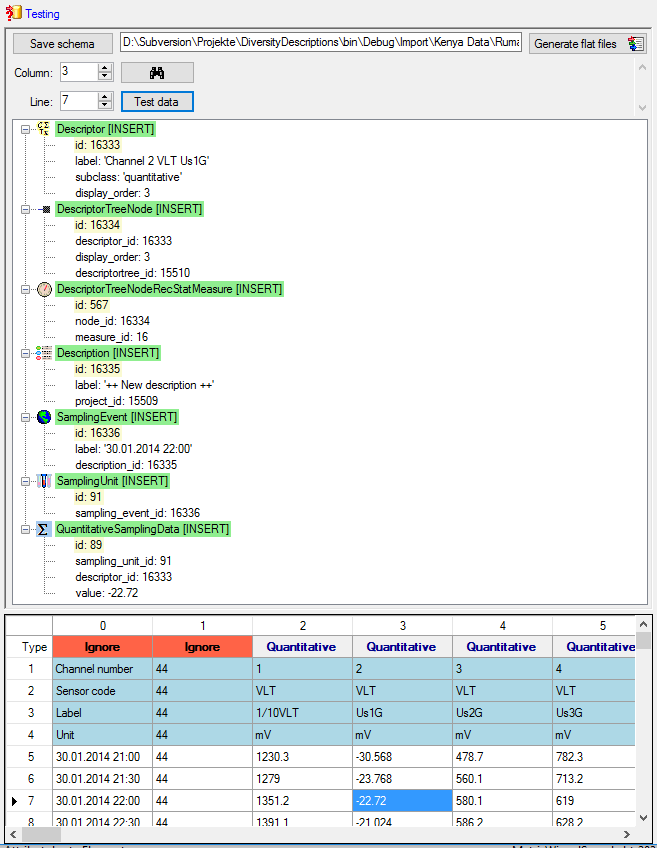
 . Finally click on the Test data
button. If there are still unmet requirements, these will be listed in a window
as shown below. In the window below you can see the following test actions:
. Finally click on the Test data
button. If there are still unmet requirements, these will be listed in a window
as shown below. In the window below you can see the following test actions:
- Insert of a quantitative descriptor "Channel 2 VLT Us1G"
- Insert of a descriptor tree node (assignemnt to tree "Tree for matrix test
sample")
- Insert of a recommended statistical measure (measure "Mean") for the descriptor
tree node
- Insert of description "++ New description ++" for project "Matrix
test sample"
- Insert of a sampling event "30.01.2014 22:00" for description "++
New description ++"
- Insert of a sampling unit with id 199 for sampling event "30.01.2014 22:00"
- Insert of a quantitative value -22.72 to sampling unit 199
You may save the schema file by a click on button
Save schema. If you click on button Generate flat files
 according to your adjustments
data and matching schema files for the table oriented import wizards will be generated.
This option may be used, if you want to import additional data, e.g. a descriptor's
measurement unit, that are not supported by the matrix wizard. Since all mapping
relevant data are stored in the selected import session, you may import the basic
descriptor and description data using the matrix wizard and append additional data
with the table oriented import wizards. In this case the generated flat data and
schema files might be useful to have a defined starting point.
according to your adjustments
data and matching schema files for the table oriented import wizards will be generated.
This option may be used, if you want to import additional data, e.g. a descriptor's
measurement unit, that are not supported by the matrix wizard. Since all mapping
relevant data are stored in the selected import session, you may import the basic
descriptor and description data using the matrix wizard and append additional data
with the table oriented import wizards. In this case the generated flat data and
schema files might be useful to have a defined starting point.
With the last step you can finally start to import the
data into the database. If you want to repeat the import with the same settings
and data of the same structure, you can save a schema of the current settings (see
below).
|
Schedule for matrix import of tab-separated text files into DiversityDescriptions
|
|
Target within DiversityDescriptions: SamplingEvent
|
|
Schedule version:
|
1
|
Database version:
|
03.00.17
|
|
Lines:
|
5 - 151
|
Header lines:
|
4
|
|
Encoding:
|
ANSI
|
Language:
|
US
|
Tables
Descriptor (Descriptor)
Merge handling: Merge
|
Column in table
|
?
|
Copy
|
Pre
|
Post
|
File pos.
|
Value
|
Source
|
|
id
|
?
|
|
|
|
1
|
|
File
|
|
label
|
|
|
Channel
|
|
1
|
|
File
|
|
+
|
|
|
|
|
2
|
|
File
|
|
+
|
|
|
|
|
3
|
|
File
|
|
descriptortree_id
|
|
|
|
|
|
Tree for matrix test sample
|
Interface
|
Description (Description)
Merge handling: Merge
|
Column in table
|
?
|
Copy
|
Pre
|
Post
|
File pos.
|
Value
|
Source
|
|
id
|
?
|
|
|
|
|
++ New description ++
|
Interface
|
|
label
|
|
|
|
|
|
++ New description ++
|
Interface
|
|
project_id
|
|
|
|
|
|
Matrix test sample
|
Interface
|
SamplingEvent (SamplingEvent)
Merge handling: Merge
|
Column in table
|
?
|
Copy
|
Pre
|
Post
|
File pos.
|
Value
|
Source
|
|
id
|
?
|
|
|
|
0
|
|
File
|
|
label
|
|
|
|
|
0
|
|
File
|
Descriptor columns
|
File pos.
|
Descriptor type
|
Additional data
|
|
2
|
Quantitative
|
|
|
3
|
Quantitative
|
|
|
4
|
Quantitative
|
|
|
5
|
Quantitative
|
|
|
6
|
Quantitative
|
|
|
7
|
Quantitative
|
|
|
8
|
Quantitative
|
|
|
9
|
Quantitative
|
|
|
10
|
Quantitative
|
|
|
11
|
Quantitative
|
|
|
12
|
Quantitative
|
|
|
13
|
Quantitative
|
|
|
14
|
Quantitative
|
|
|
15
|
Quantitative
|
|
|
16
|
Quantitative
|
|
|
17
|
Quantitative
|
|
|
18
|
Quantitative
|
|
|
19
|
Quantitative
|
|
|
20
|
Quantitative
|
|
|
21
|
Quantitative
|
|
|
22
|
Quantitative
|
|
|
23
|
Quantitative
|
|
|
24
|
Quantitative
|
|
|
25
|
Quantitative
|
|
|
26
|
Quantitative
|
|
|
27
|
Quantitative
|
|
|
28
|
Quantitative
|
|
|
29
|
Quantitative
|
|
|
30
|
Quantitative
|
|
|
31
|
Quantitative
|
|
|
32
|
Quantitative
|
|
|
33
|
Quantitative
|
|
|
34
|
Quantitative
|
|
|
35
|
Quantitative
|
|
|
36
|
Quantitative
|
|
|
37
|
Quantitative
|
|
|
38
|
Quantitative
|
|
|
39
|
Quantitative
|
|
|
40
|
Quantitative
|
|
|
41
|
Quantitative
|
|
|
42
|
Quantitative
|
|
|
43
|
Quantitative
|
|
|
44
|
Quantitative
|
|
|
45
|
Quantitative
|
|
File cells that could not be imported will be marked with
a red background while imported lines are marked green. If you want to save lines
that produce errors during the import in a separate file, use the Save failed lines
option. The protocol of the import will contain all settings acording to the used
schema and an overview containing the number of inserted, updated, unchanged and
failed lines (see below).
Protocol
|
Responsible:
|
Link
|
(DB-User: Workshop)
|
|
Date:
|
Donnerstag, 20. April 2017, 16:17:42
|
|
Server:
|
training.diversityworkbench.de
|
|
Database:
|
DiversityDescriptions_Workshop
|
|
Descriptor columns total:
|
44
|
|
Descriptors imported:
|
44
|
|
Import lines total:
|
147
|
|
Descriptions imported:
|
1
|
|
Samples imported:
|
147
|
|
Cells imported:
|
6348
|
|
Cells failed:
|
120
|
