Diversity Collection
Collection Event
Main sectors
The image below gives you a overview of the main parts related to the collection event.
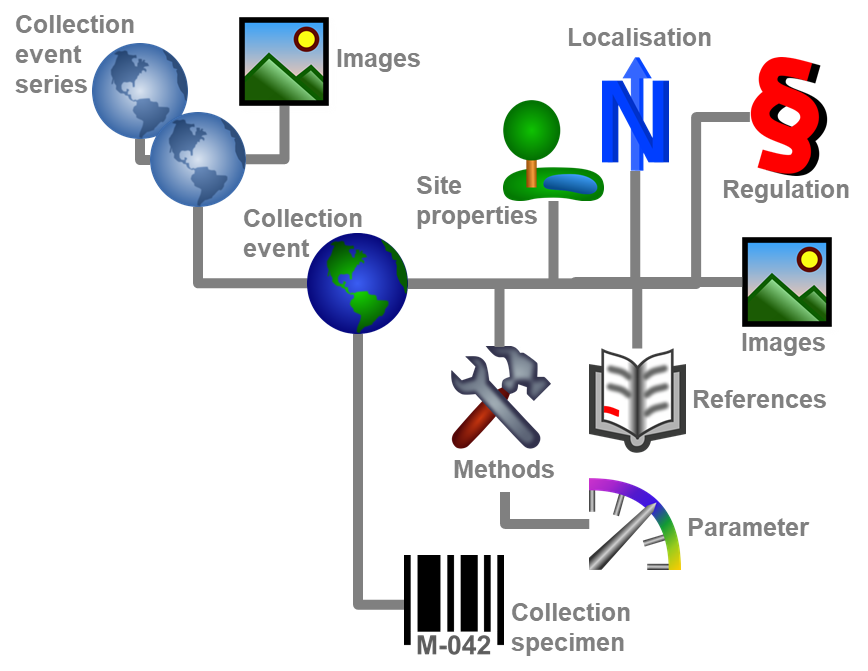
Specimens stored in a collection are gathered during a CollectionEvent.
This CollectionEvent keeps for example information about the geographic
locality, the habitat, the collection date. During a CollectionEvent
several specimens may have been collected. To create a new event for a
specimen click on the  button. If a specimen has
not been assigned to a CollectionEvent, you can assign the specimens to
an existing event with a click on the
button. If a specimen has
not been assigned to a CollectionEvent, you can assign the specimens to
an existing event with a click on the  button. If you assign the specimen to an existing event, a window will
open where you can search for the events already included in the
database as shown below. Choose an event and click OK to assign the
specimen to this event. If you click OK without selecting any
CollectionEvent, the current CollectionEvent will be removed from the
CollectionSpecimen.
button. If you assign the specimen to an existing event, a window will
open where you can search for the events already included in the
database as shown below. Choose an event and click OK to assign the
specimen to this event. If you click OK without selecting any
CollectionEvent, the current CollectionEvent will be removed from the
CollectionSpecimen.
To get access to the collection event data independent of specimen select Data - Collection event… from the menu.
In the tree view the CollectionEvent is symbolized by an
icon as shown below.
The CollectionEvents can be organized in a hierarchy either by using
CollectionEventSeries or sampling plots. If your CollectionEvents belong
e.g. to an expedition, you should preferably use CollectionEventSeries
for the organization.
If your samples are taken e.g. on a regular basis from permanent
sampling plots, you may prefer to use the module DiversitySamplingPlots
to document the geography and other details of the sampling plots and
use the CollectionEvents only to document the collection date.
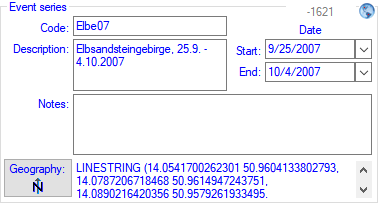
To edit the data of the CollectionEvent choose it in the tree view to
open the detail fields as shown below. If the collection date does not
correspond to a certain day, you may use the Suppl. field to enter
e.g. a range or a series of dates or the T.span field to document a
certain time span.
The text shown in the tree view is composed of the date of the
CollectionEvent and the description of the locality. For each
CollectionEvent you can enter several geographicallocations and properties. To see the
locality according to the coordinates stored in the database you can
check the Maps. For each CollectionEvent you can enter
images related to this event.
If other specimens were collected during the same CollectionEvent, they
will be displayed once the entire hierarchy of the EventSeries is shown.
To do this click on the  button in
the panel on the left side of the tree. See
EventSeries for further details. You can also move a
specimen to another event by drag and drop.
button in
the panel on the left side of the tree. See
EventSeries for further details. You can also move a
specimen to another event by drag and drop.
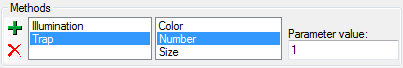
Besides of a plain text description of the methods used during the
CollectionEvent, you may insert methods as defined in the chapter
Methods. Use the  and
and
 buttons to add or remove methods from the list
(see below)
buttons to add or remove methods from the list
(see below)
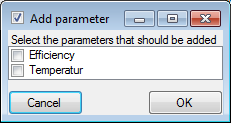
If parameters are added to the methods after you added the method to the
event, these new parameters will not automatically be available in the
event method. The new parameters must be added via the Maintenance or with a click on the add button. A window as shown below will open where you
can select the parameters that may be added.
Data are stored in the table
CollectionEvent.
Subsections of Event
Diversity Collection
Collection Event Series
If you need a hierarchical order of your CollectionEvents or want to organize several CollectionEvents, for example, to document expeditions, you can achieve this with a CollectionEventSeries.
For a better differentiation between
events and CollectionEventSeries, there is blue text in the hierarchy as
well as the editing part, and a different icon
 . A CollectionEventSeries can
contain other CollectionEventSeries and CollectionEvents. Information
about the geographic locality, properties of the collection site, date
of collecting etc., is stored in the CollectionEvent. To
show or hide the CollectionEventSeries, you have two options. In the
panel on the left of the tree the
button will show the superior EventSeries of the current CollectionEvent
as shown below.
. A CollectionEventSeries can
contain other CollectionEventSeries and CollectionEvents. Information
about the geographic locality, properties of the collection site, date
of collecting etc., is stored in the CollectionEvent. To
show or hide the CollectionEventSeries, you have two options. In the
panel on the left of the tree the
button will show the superior EventSeries of the current CollectionEvent
as shown below.

The button will show the entire
hierarchy of the EventSeries as shown below.
To edit the data of an EventSeries, select it in the tree to display the
detail fields as shown below.
New Event Series
To insert a new CollectionEventSeries click on the
button. If there are no CollectionEventSeries so far, the
CollectionEvent will be placed within the new CollectionEventSeries. If
there are CollectionEventSeries present, the new CollectionEventSeries
will be placed below the selected CollectionEventSeries. To assign a
CollectionEvent to an existing CollectionEventSeries already available
in the database, click on the  button.
To move an item within the hierarchy, just drag it with the mouse to
whatever position it should be placed in. Keep in mind that specimens
can only be placed in CollectionEvents and CollectionEvents only in
CollectionEventSeries.
Removing EventSeries
If you want to delete a CollectionEventSeries or a CollectionEvent,
remove all depending CollectionEventSeries, CollectionEvents
and specimens and click on the button. A specimen
can not be deleted here.
If you want to remove a CollectionEvent from the
current CollectionEventSeries, click on the  button.
Moving into Event Series
 If you want to transfer the data selected in the query results into a
CollectionEventSeries, choose Data -
Transfer - to event series… from
the menu. If only a part of the items in the query results is selected,
you will be asked whether all data in the list should be transferred. To
transfer only the selected data, click NO. To transfer the entire list, click YES.
Note: Only samples that are already part of a collection event can be transferred.
Items without a collection event will not be included.
If you want to transfer the data selected in the query results into a
CollectionEventSeries, choose Data -
Transfer - to event series… from
the menu. If only a part of the items in the query results is selected,
you will be asked whether all data in the list should be transferred. To
transfer only the selected data, click NO. To transfer the entire list, click YES.
Note: Only samples that are already part of a collection event can be transferred.
Items without a collection event will not be included.
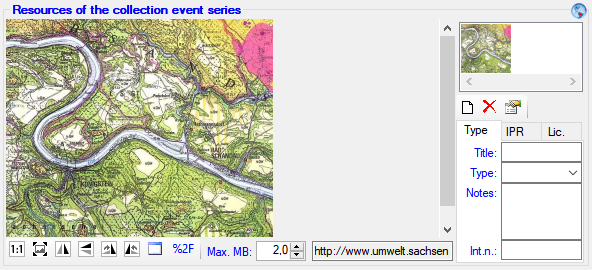
Images
To display the images, choose  Series images in the header menu. To add images to a CollectionEventSeries, click the
  button. To remove an image, use the delete button. With the button
  you can switch to a new Chromium-based browser for the display of
images. The presence of images in an event series is indicated by a
yellow background on the lower of the buttons in the upper right
corner. These buttons may be used as a shortcut to display the
images
you can switch to a new Chromium-based browser for the display of
images. The presence of images in an event series is indicated by a
yellow background on the lower of the buttons in the upper right
corner. These buttons may be used as a shortcut to display the
images  .
.
To zoom a sector of the image, simply move the mouse over the image. A
red square will indicate the zoomed area. To set the size of the image
to the original resolution, click on the  button. To adapt the size of the image to the available space in the
form, click on the
button. To adapt the size of the image to the available space in the
form, click on the  button. To change the
orientation of the image use the appropriate buttons (
button. To change the
orientation of the image use the appropriate buttons (
 flip horizontally,
 flip vertically,
 rotate right,
 rotate left). To view the image in a
separate form, click on the button. If the image
should not be published, e.g., on the internet, enter any reason in the
Withhold reason field. Besides images, you can also store other
media.
rotate left). To view the image in a
separate form, click on the button. If the image
should not be published, e.g., on the internet, enter any reason in the
Withhold reason field. Besides images, you can also store other
media.
Descriptors
To add descriptors to an event series, you must first add descriptor types. Choose Administration - Enumerations - Event series -  Desprictor from the menu, or
click the button in the descriptor section. A window will open where you can manage the available descriptor types. Use the resp. buttons to add or remove a descriptor to the event series.
Desprictor from the menu, or
click the button in the descriptor section. A window will open where you can manage the available descriptor types. Use the resp. buttons to add or remove a descriptor to the event series.
Hierarchy
 If you want to change to another specimen listed in the
CollectionEventSeries, select it in the hierarchy and click on
the
If you want to change to another specimen listed in the
CollectionEventSeries, select it in the hierarchy and click on
the  button.
The current specimen, together with the event and all superior
CollectionEventSeries will be highlighted.
Geography
 The
CollectionEventSeries can contain a geographical object (using
WGS84) such as a point, a line, an area, etc. To edit or
show the geographical object related to the CollectionEventSeries, either
click on the Geography button in the details next to the notes
field select the
The
CollectionEventSeries can contain a geographical object (using
WGS84) such as a point, a line, an area, etc. To edit or
show the geographical object related to the CollectionEventSeries, either
click on the Geography button in the details next to the notes
field select the  Map in the header to
show the maps and use the GIS editor
Map in the header to
show the maps and use the GIS editor  .
.
Storage
The data of the CollectionEventSeries is stored in the table
CollectionEventSeries.
Diversity Collection
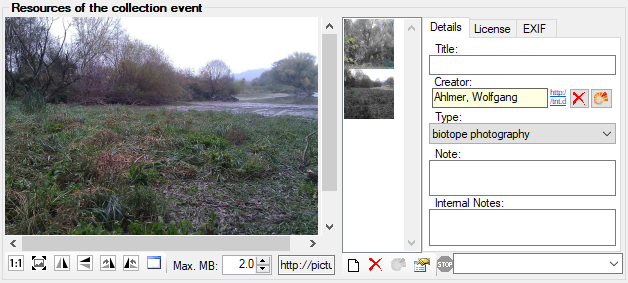
Event Images
The specimens stored in a collection are gathered during a
CollectionEvent. To insert an
image related to a CollectionEvent, select the event image
 in the header menu to display the images of
the collection event. In case the event images are not displayed, a
yellow (image(s) present) resp. gray (no image) backgroud of the tiny
buttons at the upper right corner indicates the presence of images
.
in the header menu to display the images of
the collection event. In case the event images are not displayed, a
yellow (image(s) present) resp. gray (no image) backgroud of the tiny
buttons at the upper right corner indicates the presence of images
.
In the list (see below) click on the new button. If you
want to delete an image, click on the button.
For more details see the section Images.
With the button
you can change to a new chromium
based browser for the display of images.
If for any reason an image should not be published i.e. shown on a
website, enter the reason in the field  Withholding reason. Only images where this field is empty will be
shown e.g. on websites. The EXIF data are extracted from the image
during the import, e.g. via
DiversityMobile.
Withholding reason. Only images where this field is empty will be
shown e.g. on websites. The EXIF data are extracted from the image
during the import, e.g. via
DiversityMobile.
Data is stored in the table
CollectionEventImage .
Diversity Collection
Localisation
Geography
As additional information to the description of the locality you can use
several localisation systems, e.g. georeferencing. These entries are
marked with an icon in the tree as shown
below.
To add a new entry choose the localisation system from the drop-down
list as shown below. Only items which are not already set for a
CollectionEvent will be shown. The items visible in the drop-down list
can be customized.
If a localisation should be removed, select it from the list and click
on the button.
GIS editor
To define an area for the locality you can use the GIS
editor. For further details please see the help sections
for the corresponding pages.
Coordinates (WGS84)
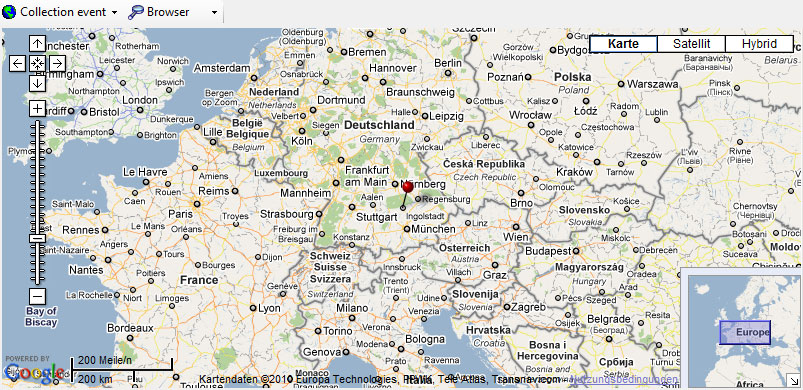
If you use geo-coordinates as georeferencing system (coordinates WGS84),
a button  will appear which will provide you
with the possibility to set or correct the coordinates via Google Maps.
Just click on the button and a window will
open with a map provided by Google Maps as shown below. If there are
already coordinates provided by a different localisation e.g. by the
DiversityGazetteer, these will be taken as a starting position. Thus,
you may use an entry for a named area (DiversityGazetteer) as an
approximate localisation and use additional coordinates for a more
accurate localisation.
will appear which will provide you
with the possibility to set or correct the coordinates via Google Maps.
Just click on the button and a window will
open with a map provided by Google Maps as shown below. If there are
already coordinates provided by a different localisation e.g. by the
DiversityGazetteer, these will be taken as a starting position. Thus,
you may use an entry for a named area (DiversityGazetteer) as an
approximate localisation and use additional coordinates for a more
accurate localisation.
If you start with existing geographic coordinates (WGS84) in your data,
the system will use these as starting point. You can zoom the map, drag
it to another position and change from map to satellite mode. The actual
position is symbolized by the symbol in the
middle of the map. The current coordinates are shown in the field at the
bottom of the map. To include these coordinates in your data simply
click OK.
With the Set start coordinates button you can set the coordinates which GoogleMaps should use as a starting
position.
Please keep in mind that Google Maps coordinates are based on WGS84.
If there are no entries for the altitude and the named area, this data
will be retrieved from the webservice
ws.geonames.org and entered into the database.
The source will be documented in the Notes field. Subsequent changes
in the coordinates using the GoogleMaps function will update the
altitude and named area entries provided they are derived from a
webservice (ws.geonames.org) as documented in the Notes field.
Please keep in mind that the place names provided by ws.geonames.org
may differ from those depicted in GoogleMaps.
To enter the localisations listed above simply enter the Coordinates
WGS84. If an appropriate webservice is available (e.g.
geonames) the Altitude and Named
area will be added automatically.
Named areas - DiversityGazetter
The localisation system DiversityGazetteer is linked to the module
DiversityGazetteer within the DiversityWorkbench and providing
information on geographical names as shown below. The module
DiversityGazetteer may contain several independent lists of geographical
names, e.g. political and biogeographical regions. You therefore may add
up to 5 links to the module DiversityGazetteer.
TK25 (MTB)
The source data for TK maps are stored in the module
DiversityGazetteer. You need a access to a database of this module containing these data. If you choose MTB or TK25, the button will open a window where you can set the TK25 as well as the quadrant (see image below). Choose the quadrant depending on your preferred resolution. The thick line shows the current quadrant, the thin line the entire TK25.
The needle in the center is placed at your current position. If you
click on it, a message box will display the TK25 information as shown
below.
If you click [OK], the TK25 values together with the coordinates
of the center of the selected quadrant will be entered into the
database.
Conversion of values
The values for any localisation system are stored in two text fields.
You can enter your values as simple text. This may, however, prevent any
calculations with said values. Thus, you should preferably enter your
values according to the measurement units available. Whatever obsolete
measurement units like feet or Fahrenheit may exist, within the
DiversityWorkbench measurement data is stored in units according to the
Système International d'Unités (SI).
For those who still need to use these obsolete units DiversityCollection
provides a possibility to convert them into their modern counterparts.
To enter a numeric value choose the unit you prefer from the list. The
form will change as shown below.

You can then edit the values and click on the  button to incorporate the changed values into your data. The system will
calculate the corresponding value for storage in the database together
with the default accuracy. You may correct this accuracy if you have
more exact values. To indicate that the shown values are calculated from
the values in the database the fields have a green background. When you
save the data DiversityCollection will store geographic coordinates and
the average altitude, if available, in separate fields.
button to incorporate the changed values into your data. The system will
calculate the corresponding value for storage in the database together
with the default accuracy. You may correct this accuracy if you have
more exact values. To indicate that the shown values are calculated from
the values in the database the fields have a green background. When you
save the data DiversityCollection will store geographic coordinates and
the average altitude, if available, in separate fields.
The altitude, the exposition or the slope may be entered as one value or
as a range of two values. If you use the conversion function and have
only one value, make sure that the second field is empty.
 Available units: meter and feet.
 Available units: Orientation (N, NE, ... ) and
degree rel. to North.
Available units: Orientation (N, NE, ... ) and
degree rel. to North.
 Available units: degree and percent.
The accuracy and uncertainty respectively will be calculated as an
approximation in parts derived from Wieczorek, J. 2001
(MaNIS/HerpNet/ORNIS Georeferencing Guidelines. University of
California, Berkeley: Museum of Vertebrate Zoology) and in parts
according to Wieczorek, J., Q. Guo, and R. Hijmans 2004 (The
point-radius method for georeferencing locality descriptions and
calculating associated uncertainty. International Journal of
Geographical Information Science 18: 745-767). The unit of the accuracy
will always be the unit stored in the database according to the Système
International d'Unités (SI) and degrees for angles respectively.
The data for the geography is stored in the table
CollectionEventLocalisation.
Diversity Collection
Maps of samples in the database
If there are WGS84 coordinates available for your collection site, an
event series or single organisms, you can use GoogleMaps to display
these locations.
To use this service you need access to the internet. Select the
Map for display in the header area to
show the maps. Here you can display maps of
CollectionEventSeries,
CollectionEvent,  Organism
as well as Distribution
maps. To display the maps you can either use the
Organism
as well as Distribution
maps. To display the maps you can either use the
 browser, the web viewer, the
 GIS viewer or the GIS
editor. By default the map will show the location of the
CollectionEvent using the browser as shown below.
GIS viewer or the GIS
editor. By default the map will show the location of the
CollectionEvent using the browser as shown below.
The two options browser
and web viewer in principle provide the same
function, but rely on different controls. Due to incompatiblities
between controls and the google web API you may have to test both to
display a map.
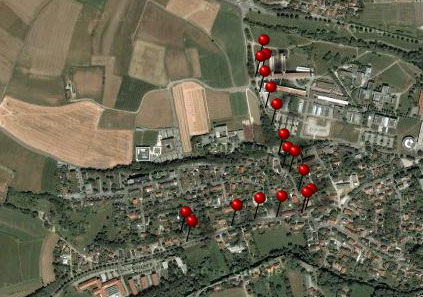
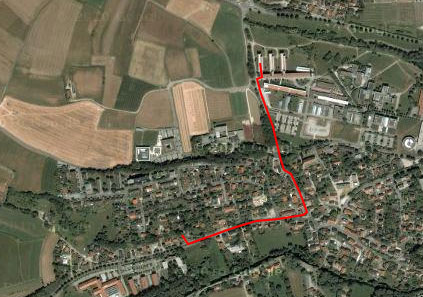
For the CollectionEventSeries, the
CollectionEvent or the
Organism you can use any geographical object like
points, lines, areas, etc. to describe the location. The browser will
always display these objects as points (see left image below) whereas
with the GIS editor you can see and edit the real
objects (see right image below).
The data of the geographical objects is stored in the table
CollectionEventSeries
for the collection event series, the table
CollectionEventLocalisation
for the collection event and the table
IdentificationUnitGeoAnalysis
for the organisms.
Diversity Collection
Distribution maps
If WGS84 coordinates are available for your collection sites, you can
create distribution maps of your samples in the database. To use this
service you need access to the internet. Choose
Map in the header to show the maps. To
display distribution maps choose the
appropriate option from the first drop down list in the mapscontrol.
To add data sets to the distribution search for the data sets you want
to see in the map, mark them in the list (either use the  button to mark all data sets, mark a
list/single data sets or check the
button to mark all data sets, mark a
list/single data sets or check the  option for the distribution map) and click
the add button. To display the map click on the
option for the distribution map) and click
the add button. To display the map click on the  button. The displayed localities in the map will
not change until you add new localities or click the button to start with a new distribution map. If
you want to set different icons for the positions of different series of
your samples, set the style of the icon (symbol, color, size etc.) in
the menu before you add them to the distribution list.
button. The displayed localities in the map will
not change until you add new localities or click the button to start with a new distribution map. If
you want to set different icons for the positions of different series of
your samples, set the style of the icon (symbol, color, size etc.) in
the menu before you add them to the distribution list.
To show a distribution map of all the specimens found in your query as
shown below, select the option
Distribution from the drop down menu. For the display in the map you
can choose either the Browser (see below) or
the GIS-Editor. In
the browser all objects will be shown with their center coordinates and
the number of specimens that can be depicted is limited, thus, it may be
necessary to restrict your query. With the GIS editor all objects will
be shown with their whole geography (e.g. an area will not be reduced to
its central coordinates) and there is no limit to the number.
Furthermore you can vary the symbols for different groups.
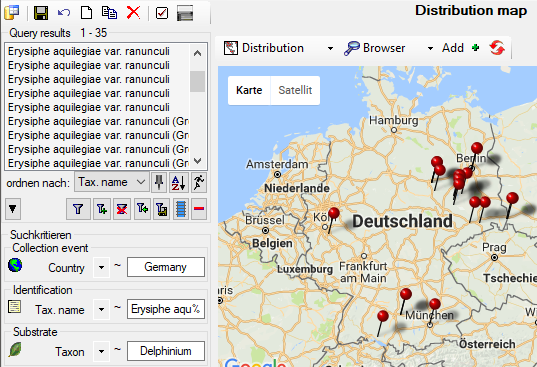
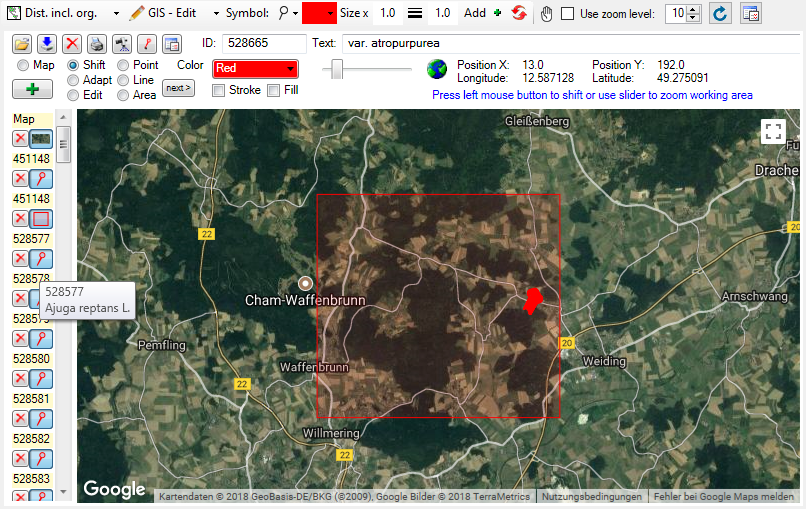
The upper distribution map is restricted
to coordinates of the collection event . If
you want to include coordinates from the organisms
, choose the distribution map including organisms
 . For the positions of the
organisms in this map, the ID of the organism ( = IdentificationUnitID,
528577 in example below) is shown as identifier and the last
identification ( = LastIdentificationCache) as display text (Ajuga
reptans L. in example below).
. For the positions of the
organisms in this map, the ID of the organism ( = IdentificationUnitID,
528577 in example below) is shown as identifier and the last
identification ( = LastIdentificationCache) as display text (Ajuga
reptans L. in example below).
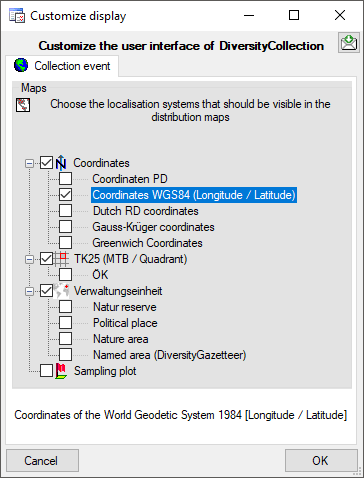
If you want to restrict the display to the organisms, click on
the  button to open the window for custimizing
the display (see below) and deselect all localisation systems for the
collection event.
button to open the window for custimizing
the display (see below) and deselect all localisation systems for the
collection event.
While in the GIS tool the objects are represented with their real
geography (see above), in the browser every object is reduced to a
single point. For an introduction see a short tutorial
 .
.
Diversity Collection
Sampling Plots
If your samples are collected at constant sampling plots, you may use
the module DiversitySamplingPots to describe said SamplingPlots. For a
better differentiation between events and the SamplingPlots there is a
brown text in the hierarchy as well as a different icon
 . A SamplingPlot can contain other
SamplingPlots and CollectionEvents. Information about the geographic
locality and properties of the collection site can be stored in the
SamplingPlot, while the collecting date must be stored in the
CollectionEvent. To show or hide the SamplingPlots you have
two options. In the panel on the left of the tree the button will show the superior SamplingPlots
of the current CollectionEvent as shown below.
. A SamplingPlot can contain other
SamplingPlots and CollectionEvents. Information about the geographic
locality and properties of the collection site can be stored in the
SamplingPlot, while the collecting date must be stored in the
CollectionEvent. To show or hide the SamplingPlots you have
two options. In the panel on the left of the tree the button will show the superior SamplingPlots
of the current CollectionEvent as shown below.
The  button will show the entire hierarchy of
the SamplingPlots as shown below.
button will show the entire hierarchy of
the SamplingPlots as shown below.
If you select a SamplingPlot in the hierarchy, two buttons will appear
in the bar to the left of the tree. With the  button will show the entire hierarchy of
the SamplingPlots as shown below.> button
you can retrieve a taxon list for the SamplingPlot.
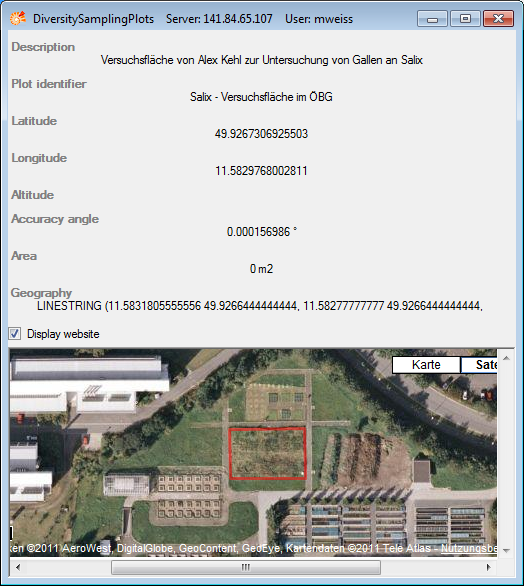
With the button you can retrieve a summary
of the information on a SamplingPlot (see image below).
button will show the entire hierarchy of
the SamplingPlots as shown below.> button
you can retrieve a taxon list for the SamplingPlot.
With the button you can retrieve a summary
of the information on a SamplingPlot (see image below).
To edit the data of a SamplingPlot please use the module
DiversitySamplingPlots.
Transfer of selected data
To transfer all resp. the selected data into a specific sampling plot, choose
from the menu. Several upcoming dialogs will guide you through the transfer.
The link to the module DiversitySamplingPlots is stored in the table
CollectionEventLocalisation.
Diversity Collection
Habitats and properties of the collection site
For the description of the habitat select the CollectionEvent
or an existing collection site property
 . The description is entered in the field
Habitat (see below).
. The description is entered in the field
Habitat (see below).
To enter a new property of the collection site select the
CollectionEvent or an existing collection site
property . Then choose the type of the
property you wish to enter from the drop-down menu as shown below. Only
items which are not already set for a CollectionEvent will appear in the
list. You can customize the selection of visible items.
The list is dependent on the availability of terminologies for site
descriptions. Details for the property can be entered if you choose the
item in the hierarchy. The person responsible for the entry as well as
notes can be entered in the corresponding fields as shown below.
To delete entries use the button. You can enter a
value by either typing the name of the collection site property or by
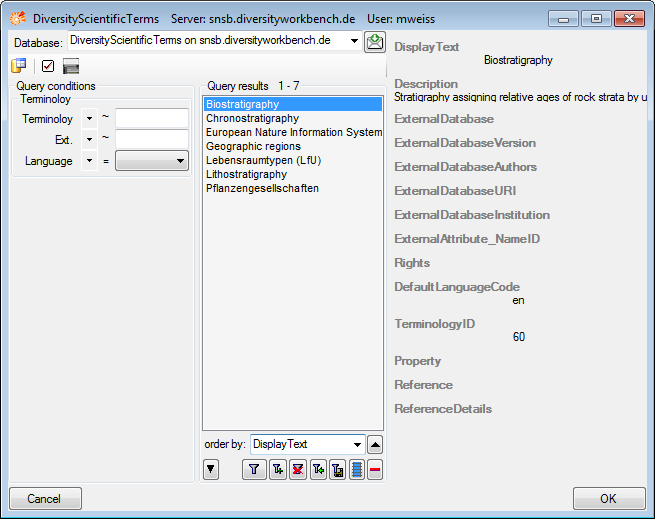
selection from the module DiversityScientificTerms. To search for
properties from this module click on
the  button. The current user’s name
will be inserted as the responsible user. You may change this by either
typing or through selection from the module DiversityAgents.
button. The current user’s name
will be inserted as the responsible user. You may change this by either
typing or through selection from the module DiversityAgents.
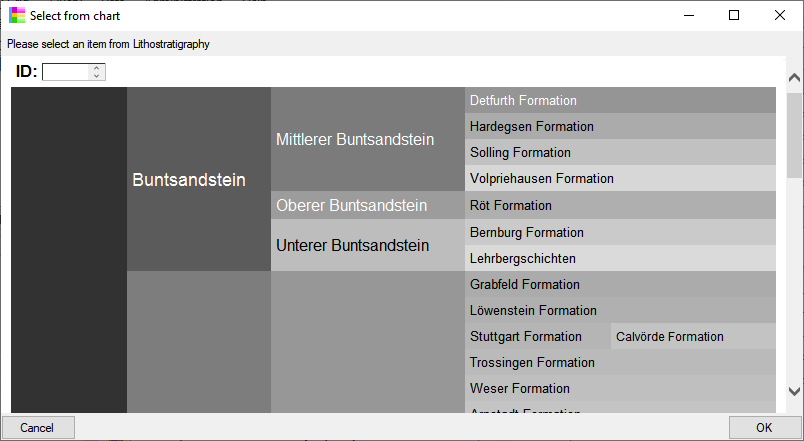
As an alternative to the DWB button, you
may select the property via a chart with a click on the
 button. A window as shown below will open. To
select an item from the chart click no the entry you want to select and
close the window with a click on the OK button.
button. A window as shown below will open. To
select an item from the chart click no the entry you want to select and
close the window with a click on the OK button.
The data concerning the habitats is stored in the table
CollectionEventProperty.
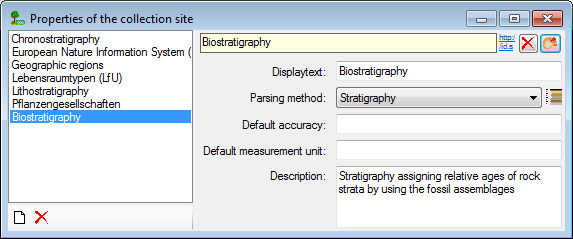
Administration of properties (resp. terminologies)
To administrate the available properties of collection sites, choose
Administration - Site properties…
from the menu. A window as shown below will open, where you can
delete existing site properties and
add new site properties.
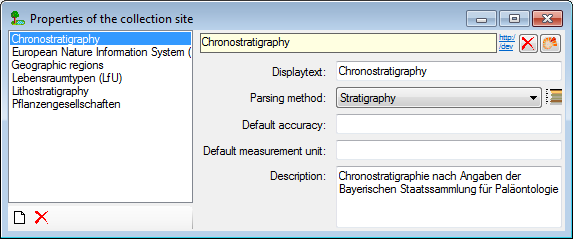
To add new properties, click on the button, select
the new entry in the list and choose the appropriate parsing method.
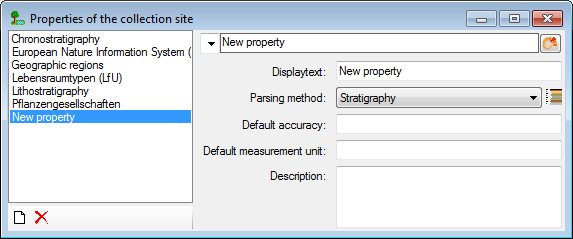
Properties should be linked to the module DiversityScientificTerms.
To link the property to the module, click on
the button. A window as shown below
will open, where you can search for the terminology provided by the
module. Please keep in mind, that the ID of the terminology will be used
for the new entry and that this ID must be unique. Turn to your
administrator if any difficulties occur.
After choosing the terminology from DiversityScientificTerms, the
new property will be displayed as shown below..


 To plot…