
The organisms in a
specimen can be analysed by
analysis types defined in the
database. In the tree the analysis entries are
symbolized with an
 icon. Only the types of analysis that were assigned to the group
of the organism can be selected. An analysis always refers to an
organism and
may also refer to a part of a specimen. An analysis that refers
to a part of a specimen
will be shown in the tree for the parts as shown in the examples
below.
icon. Only the types of analysis that were assigned to the group
of the organism can be selected. An analysis always refers to an
organism and
may also refer to a part of a specimen. An analysis that refers
to a part of a specimen
will be shown in the tree for the parts as shown in the examples
below.
To show or hide the analysis
items in the tree use the
button in the left panel. This button has 3 states. In the
default state
the analysis entries will be shown as above. If you click
a second time it will change to the hierarchy mode
 and the entries will appear as shown in the tree below. The
last state
and the entries will appear as shown in the tree below. The
last state
 will hide the entries.
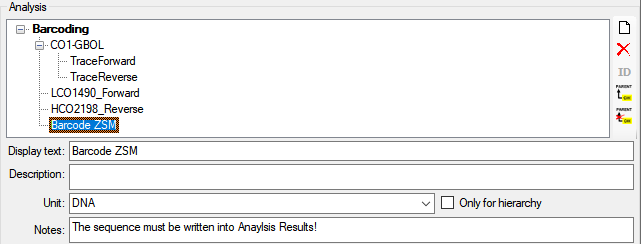
To insert a new analysis to an organism select the organism in the upper tree. Then select the type of the analysis from the drop down list as shown below.
To delete an analysis,
select it in the tree and
use the  button in the panel on the left. To edit the details of an
analysis, select it in
the tree and enter data into the fields as shown below. To
enter or inspect an URI given for a single analysis,
click on the
button in the panel on the left. To edit the details of an
analysis, select it in
the tree and enter data into the fields as shown below. To
enter or inspect an URI given for a single analysis,
click on the  button.
If an analysis refers to a part of the specimen, you can document this by choosing the respective part from the list (see field Part above). The analysis will then be shown in the tree for the parts of the specimen as well. Alternatively you may directly choose the organism in the part tree and create the analysis for this part of the organism in the part tree. If you used any tools defined in the tool section, you can include the usage of these tools.
In case the measurement unit of the analysis set to DNA (see below) ...
... the Result is edited as shown below.
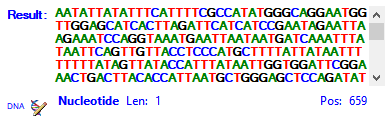
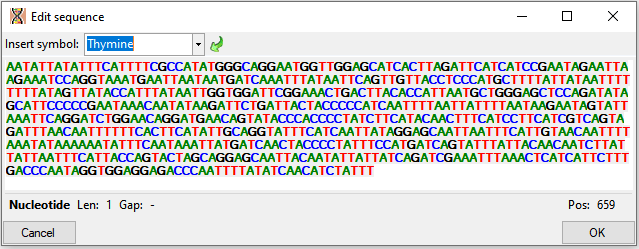
A click on the  button opens a separate window (see below) with additional
options for editing the
sequence.
button opens a separate window (see below) with additional
options for editing the
sequence.
If you require
further information about an analysis
click on the button. A window
for the analysis administration will open. If
you have the proper
rights you can edit the analysis types used in your collection
as shown below.
This window is also accessible via the menu entry
Administration
- Analysis...
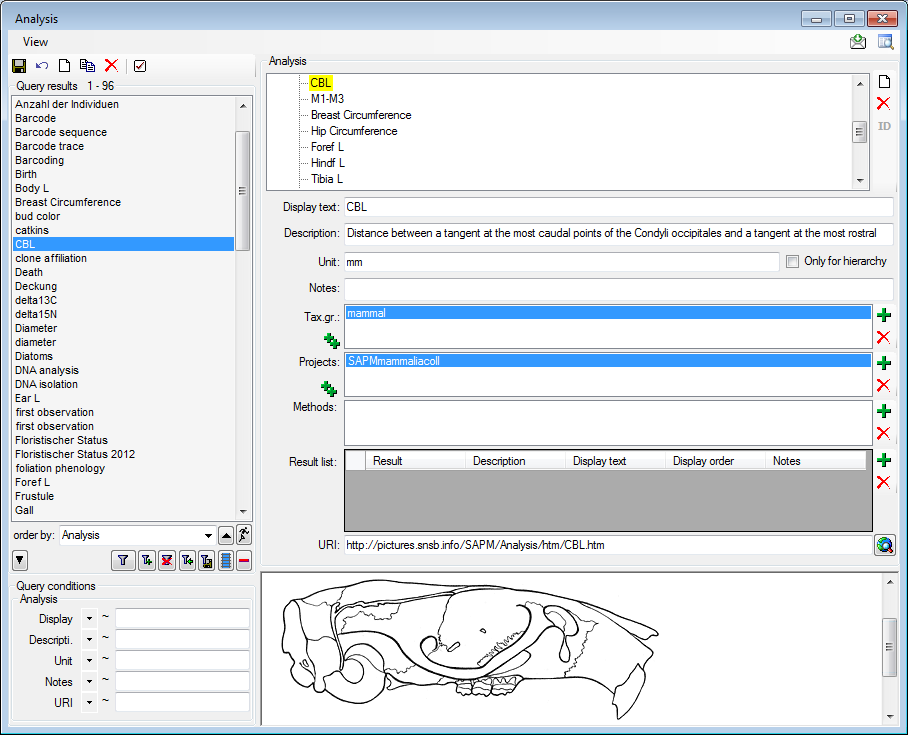
For the import and export of data it is sometimes necessary to know the IDs of the analysis types. To see the IDs, click on the ID button to display them as shown in the image below.
The types of an analysis are
restricted by the
taxonomic group of the organism or object to be
analysed and from the
projects. You may edit the list of
taxonomic groups resp. projects, which can use a certain analysis, using
the  and
button. To add all used taxonomic groups resp. projects, you can use the
and
button. To add all used taxonomic groups resp. projects, you can use the  buttons. For details about
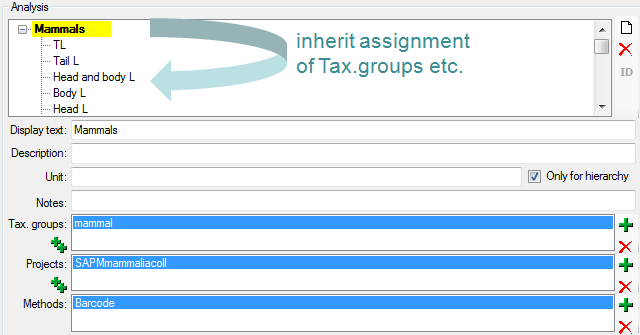
handling data see the data section. If you add a taxonomic
group or a project to an analysis, all children of this
analysis will be available
for these taxonomic groups resp. projects as well (see image below). Thus, in
the example above it is
sufficient to enter the taxonomic group and the project in
the analysis Mammals
to have access to all analysis within this superior analysis
as shown in the
tree. The different types of analysis are organized in a
hierarchy. To organize. Some of the entries may
only serve for structuring purposes (e.g. Mammals as shown
above) and should not be used
to document the analysis of the specimen. To ensure this,
check the checkbox
[Only hierarchy].
buttons. For details about
handling data see the data section. If you add a taxonomic
group or a project to an analysis, all children of this
analysis will be available
for these taxonomic groups resp. projects as well (see image below). Thus, in
the example above it is
sufficient to enter the taxonomic group and the project in
the analysis Mammals
to have access to all analysis within this superior analysis
as shown in the
tree. The different types of analysis are organized in a
hierarchy. To organize. Some of the entries may
only serve for structuring purposes (e.g. Mammals as shown
above) and should not be used
to document the analysis of the specimen. To ensure this,
check the checkbox
[Only hierarchy].
There are 3 states for result
lists in the main form.
(1) No result list will be generated if a measurement unit
is defined, for example
if you specify "mm" as the measurement unit. (2) If no
measurement unit is defined,
the program will collect all values given so far and
present these values as a
list. (3) Some types of analysis need categorized values.
Enter
these values together with their description in the
Result list as shown below using
the
 and
buttons respectively. To show values different from the
entries in the Result
column change the
entries
in the Display text column.
and
buttons respectively. To show values different from the
entries in the Result
column change the
entries
in the Display text column.
If you want to access
or inspect an URI given for an analysis
type, click on the  button.
The URI related to the analysis will then be
displayed in the window below.
button.
The URI related to the analysis will then be
displayed in the window below.
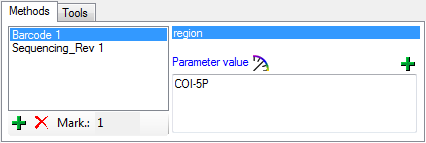
Besides of a plain text
description of the analysis, you may insert methods as
defined in the
chapter Methods. Use the
and
 buttons to add or remove methods
from the list
(see below). The added methods will be marked with sequential number (see Mark.: ... )
to allow several methods of the same type.
buttons to add or remove methods
from the list
(see below). The added methods will be marked with sequential number (see Mark.: ... )
to allow several methods of the same type.
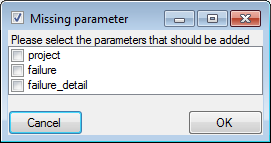
Every method may have several parameters  that will
automatically be available to take your values. If the definitions of the
parameters have been changed, you may add missing parameters with the
button. A window as shown below will open where you can
select the missing parameters you want to add.
that will
automatically be available to take your values. If the definitions of the
parameters have been changed, you may add missing parameters with the
button. A window as shown below will open where you can
select the missing parameters you want to add.
To view the history of a dataset,
click on the
 button. A
window with the
history will open. For more details see the section History.
button. A
window with the
history will open. For more details see the section History.