Description grid view
After starting a database query for descriptions select
 Grid ->
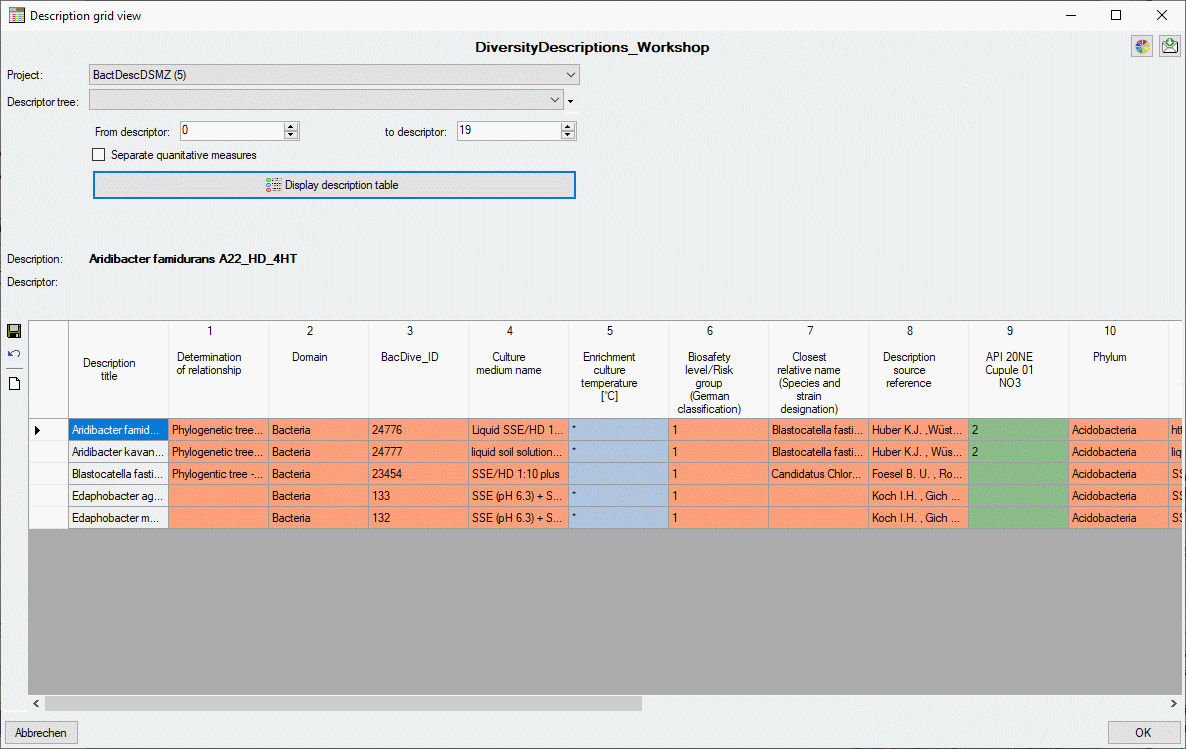
 Description grid view ... from the menu. The query result list is passed
to the description grid view form and a window as shown below opens (click the button
 Display description table to build the table output). In the first
line the database name is displayed. If you move the mouse cursor over the database
name, a tooltip shows the actual connection paramter.

The table in the lower part of the window shows the description
titles in the first column and the summary data in the other columns. Each summary
column holds the data of a certain descriptor. If a cell with summary data is selected,
the summary details and the descriptor status data are displayed in the upper right
part of the window. The upper left part of the window shows the selection parameters
that are used for building the description table. You may change the table colors
by clicking the button
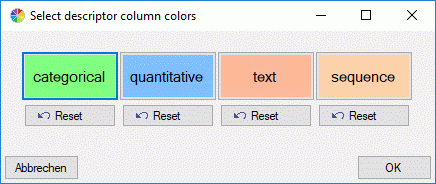
 . A form as shown below will be opened.

Click on buttons categorical,
quanitative, text or sequence to select
the corresponding table colors. By clicking the
 Reset button below the color, the corresponding default value will
be selected. After changing the table colors by a click on the OK
button, you must re-draw the table.
Selection parameters
In the upper left part of the parameters for the description
table can be adjusted. If in the query list passed to the form descriptions of different
projects are present, the displayed project can be selected with the Project:
drop-down box. The entries in the drow-down list include the project name, followed
by the number of descriptions for that project in brackets and an asterisk (*)
if the user has only read access for that project.
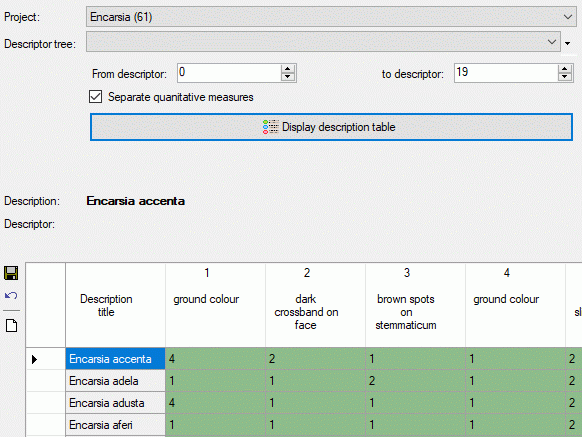
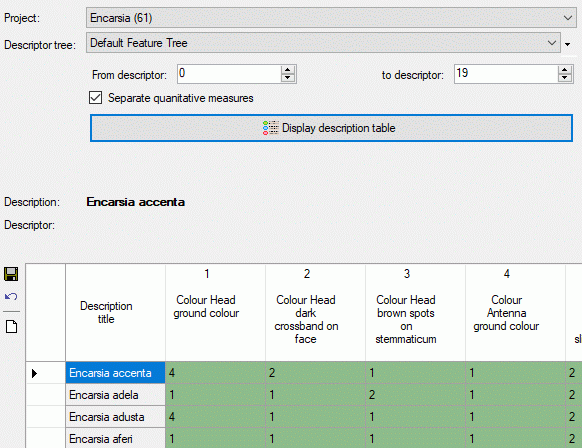
The Descriptor tree drop-down box restricts
the descriptor columns to the descriptors contained in the selected tree. Furthermore
the tree hierarchy is included in the descriptor names if a structured descriptor
tree is selected (see images below).


The values From descriptor and
to descriptor limit the range of descriptor sequence numbers that is included
in the discription tabe. Be aware that this restiction is additionally effective
to a selected desriptor tree! If you want to de-activate this restriction, select
"from" value 0 "to" value 999999 by a double-click on the labels From descriptor
rsp. to descriptor. The limitation of the number of descriptor
columns makes speeds up the description table generation, especally if many descriptor
(e.g. some hundrets) are present.
If you select option Separate statistical measures,
separate columns will be insterted in the data grid for each quantitative descriptor
and its recommended statistical measures. This option may be useful for editing
quantitative summary data that use other statistical measures than Min,
UMethLower, Mean, UMethUpper
and Max (see section Data
editing for details.
Finally click the button
 Display description table to build a new description table according to
your settings. During output of the description table the icon of the button changes
to
 and you may abort processing by clicking
the button.
Continue with:
 Grid ->
 Description grid view ... from the menu. The query result list is passed
to the description grid view form and a window as shown below opens (click the button
 Display description table to build the table output). In the first
line the database name is displayed. If you move the mouse cursor over the database
name, a tooltip shows the actual connection paramter.

 . A form as shown below will be opened.

 Reset button below the color, the corresponding default value will
be selected. After changing the table colors by a click on the OK
button, you must re-draw the table.


 and you may abort processing by clicking
the button.