Subsections of Editing
Diversity Collection
Data in tables
Besides the main form, DiversityCollection provides 3 editors of the
data in tabular form:
 Table editors : Provide
single table-based access to the data of the query results in the
main form
Table editors : Provide
single table-based access to the data of the query results in the
main form Grids : Provide predefined
tabular access to the data of the query results in the main form
Grids : Provide predefined
tabular access to the data of the query results in the main form Spreadsheets :
Provide predefined tabular access, including the possibility to query
and filter data and can be used as a starting form
Spreadsheets :
Provide predefined tabular access, including the possibility to query
and filter data and can be used as a starting form
See a short tutorial for an introduction
 .
.
| Property |
Table editors |
Grids |
Spreadsheets |
| Range |
One table |
Predefined selection of tables |
Predefined selection of tables |
| Query |
Depending on main form |
Depending on main form |
Own query |
| Filter |
Restricted |
Restricted |
Direct query in database |
| Column sequence |
Fixed |
Changeable |
Fixed |
| Start form |
No |
No |
Yes |
| Different versions |
No |
No |
Yes |
| Read only projects |
No access |
No access |
Read only mode |
| Data in map |
No |
No |
In TK25 sheet |
Subsections of Data in Tables
Diversity Collection
Grids
To edit the data in a data grid, select Grid mode
for the specimen
 , the organisms
 , the parts
 , the images
 the collection events
 or the collection event series
 from the menu. A window will open where
each dataset from the query result list is represented in a single line for
a specimen, an organism, a CollectionEvent or a CollectionEventSeries
respectively. Please note that in this view, only a limited part of the
data is visible. For example, only the most recent identification of an
organism is displayed. This is shown in the image below,
where two organisms (marked with red arrows) are not visible in
the grid view because only the latest identification per organism is shown.
from the menu. A window will open where
each dataset from the query result list is represented in a single line for
a specimen, an organism, a CollectionEvent or a CollectionEventSeries
respectively. Please note that in this view, only a limited part of the
data is visible. For example, only the most recent identification of an
organism is displayed. This is shown in the image below,
where two organisms (marked with red arrows) are not visible in
the grid view because only the latest identification per organism is shown.
When using grid mode for organisms, all organisms will appear, but only with their most recent identification.
Customise column headers
The names of the columns can be changed using the
database description.
Customise fiel visibility
The selection of the visible fields can be adjusted in the tree above the
list. Change the selection of the columns and click on the Set columns button.
Customise column width and sequence
To adjust the width of the columns or the height of the rows, either drag
the border with the mouse or double-click on the border to obtain the optimum
size for a column. You can also click the  button for the optimal height of the rows or the
  button for the optimal width of the columns. To change the
width and sequence of the columns, drag the
columns to the position of your choice or adjust the width to your
preference. These changes will be saved for this session and
the next time you use grid mode. To return to the original sequence
of the columns, click the Reset sequence button.
button for the optimal width of the columns. To change the
width and sequence of the columns, drag the
columns to the position of your choice or adjust the width to your
preference. These changes will be saved for this session and
the next time you use grid mode. To return to the original sequence
of the columns, click the Reset sequence button.
Sorting the data
To sort the data in the grid, click in the header of the column
you want to use as the sorting column. The sort will persist
even if you change values in that column. This means that if you change
a value in the sort column, the changed record will be placed in
the new position according to its new value. The sorting of a column
is indicated by an arrow indicating the direction of sorting (up or
down) and by a thicker right margin of that column (see image below).
Find and replace
To use the find and replace functions, you must either select several fields in this column or click the  button to select the whole column. You can then select the function you
wish to use (remove, insert, append or replace). To replace a part of
the text in the selected fields, type the text to be replaced
and type the replacement in the appropriate fields. To start the
replacement, click on the
button to select the whole column. You can then select the function you
wish to use (remove, insert, append or replace). To replace a part of
the text in the selected fields, type the text to be replaced
and type the replacement in the appropriate fields. To start the
replacement, click on the  button. To insert a
string to the beginning of all entries in the selected fields, click
the
button. To insert a
string to the beginning of all entries in the selected fields, click
the  button. To append a string to all entries
in the selected fields, click the
button. To append a string to all entries
in the selected fields, click the  button. To
remove all entries from the selected fields, click the
button. To
remove all entries from the selected fields, click the  button.
Transfer from spreadsheet
You can transfer data from a spreadsheet, such as Excel or Calc. Copy the
relevant columns from your spreadsheet and paste them into
DiversityCollection. Click in the top-left cell where the data
should be inserted, then open the context menu (click the right mouse
button) and select Insert to paste the data.
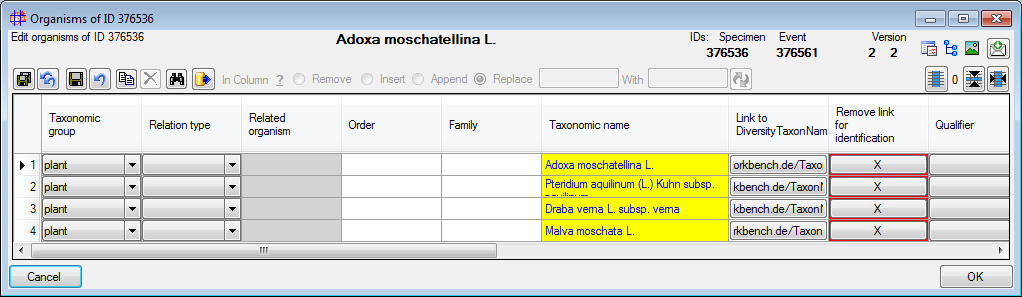
Editing
Some columns cannot be edited directly, but are linked to external
modules or services. These columns are displayed as buttons. Click on
the button to access the service. If a value is linked to an entry in an
external module, the background will change to
[yellow], and the text will no longer be editable.
Together with the links (as shown in the example above [Link to
DiversityAgents]), you can also select columns that
allow you to remove links to modules (e.g.
[Remove link for collector] in image above). These
columns appear as buttons  . Simply
click on the button associated with a link to remove the connection to the
corresponding module. After doing so, you can edit the text field containing
the previously linked value.
. Simply
click on the button associated with a link to remove the connection to the
corresponding module. After doing so, you can edit the text field containing
the previously linked value.
Some values are linked to a predefined list of options. To change such a value, use the drop-down list available in the column.
New dataset
If you click on the empty line at the base of the data grid, you will be
asked if you wish to create a new dataset. The program will ask you for
a new accession number and the project of the new dataset. Another way
to create a new dataset is to use the copy button  . Simply
click on the row you wish to create a copy of and then click on the
copy button . For details see the Data
section. A copy of the dataset will be inserted at the base of the data
grid.
. Simply
click on the row you wish to create a copy of and then click on the
copy button . For details see the Data
section. A copy of the dataset will be inserted at the base of the data
grid.
Saving the data
To save all changes, click the  button. To undo
all changes since the last time the datasets were saved, click the
button. To undo
all changes since the last time the datasets were saved, click the  button. To save the changes to the current dataset
use the
button. To save the changes to the current dataset
use the  save button. To undo the changes in the
current dataset, click the
save button. To undo the changes in the
current dataset, click the  undo button. If you click
the OK button, you will be asked if you want to save the changes before
the window closes. If you click the Cancel button or close the window, your changes will not be
saved. To export the data displayed in the grid as a text file with tabs as
column separators, click on the
undo button. If you click
the OK button, you will be asked if you want to save the changes before
the window closes. If you click the Cancel button or close the window, your changes will not be
saved. To export the data displayed in the grid as a text file with tabs as
column separators, click on the  export button.
Subsections of Grids
Diversity Collection
Grids
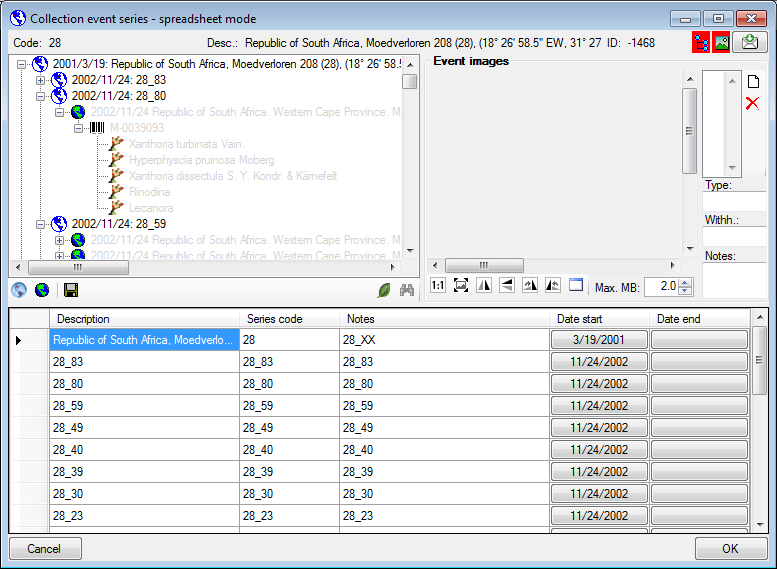
Collection Event Series
To edit the data in a data grid choose the Grid mode
for the CollectionEventSeries
from the menu. A window will open where
every data set for a CollectionEventSeries from the query result list is
restricted to one line (see below).
Customize the window
To change the width of a column simply use your mouse to adapt the width
to your preference. To hide or show parts of the window use the  button for the hierarchy tree and
the
button for the hierarchy tree and
the  button for the images in the upper right corner
of the window. If the parts are shown, the icon will have red background
e.g.
button for the images in the upper right corner
of the window. If the parts are shown, the icon will have red background
e.g.  .
.
History and feedback
To inspect the history of a data set click on the  button. A window will open as described in the
History chapter. To send a feedback use
the
button. A window will open as described in the
History chapter. To send a feedback use
the  button. Details are described in the
Feedback chapter.
button. Details are described in the
Feedback chapter.
Sorting of the data
To sort the data in the grid simply click in the header of the column
which you want to use as sorting column. The sorting sequence will be
kept even if you change values in this column. This means if you change
a value in the sorting column, the changed data set will be placed at
the new position according to its new value. The sorting of a column
will be indicated by an arrow for the direction of the sorting (up or
down) and by a thicker right border of this column (see image below).
Handling the data
To save the changes click on the save button. To insert
new data sets use the button for a
CollectionEventSeries and the button for a
CollectionEvent.
Diversity Collection
Grids
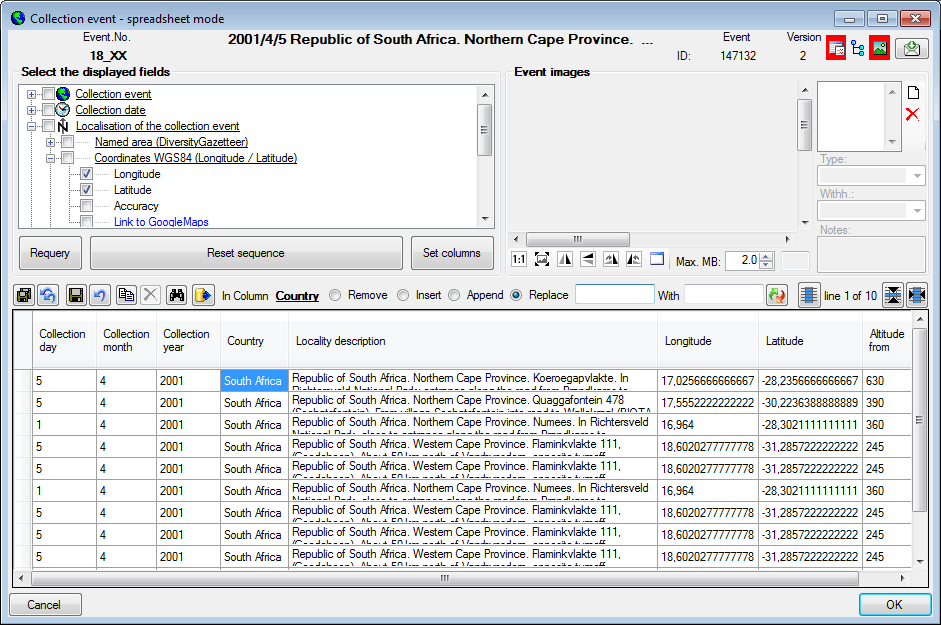
Collection Event
To edit the data of the CollectionEvents in a data grid choose the
Grid mode for the event
from the menu. A window will open where every data
set for a CollectionEvent from the query result list is restricted to
one line. Please keep in mind you can only see a limited part of the
data while in this view. For example only a part of the localisation
will be displayed (see below).
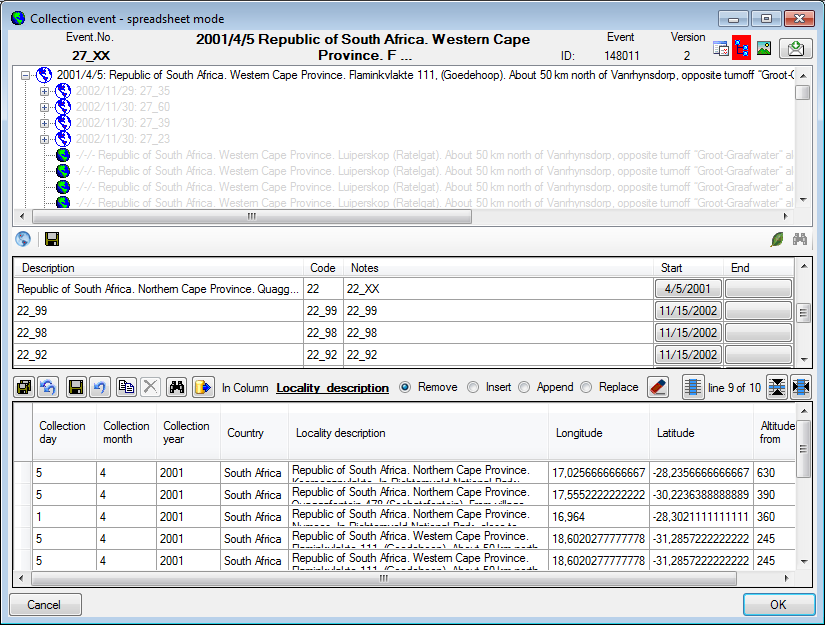
Customize the window
To change the width of a column simply use your mouse to adapt the width
to your preference. To hide or show parts of the window use the  button for the setting of the visible columns,
the button for the hierarchy tree
and the button for the images in the upper right
corner of the window. If the hierarchy tree is visible
(, see below), you have access to
the CollectionEventSeries which are linked to the CollectionEvents. Here
you can edit the hierarchy via drag & drop. Please keep in mind that
ramifications within the hierarchy can only be realized using
EventSeries with CollectionEvents
placed within and specimen
button for the setting of the visible columns,
the button for the hierarchy tree
and the button for the images in the upper right
corner of the window. If the hierarchy tree is visible
(, see below), you have access to
the CollectionEventSeries which are linked to the CollectionEvents. Here
you can edit the hierarchy via drag & drop. Please keep in mind that
ramifications within the hierarchy can only be realized using
EventSeries with CollectionEvents
placed within and specimen
 placed within the CollectionEvents. To insert a
new EventSeries use the button below the
tree.
placed within the CollectionEvents. To insert a
new EventSeries use the button below the
tree.
To change the width and sequence of the columns simply use your mouse to
drag the columns to the position of your choice or adapt the width to
your preference. These changes will be saved for this session as well as
for the next time you use the grid mode. To return to the original
sequence of the columns click on the Reset sequence button.
Customize visibility of fields
The selection of the visible fields can be adapted in the tree above the
list. Change the selection of the columns and click on the Set columns button.
Sorting of the data
To sort the data in the grid simply click in the header of the column
which you want to use as sorting column. The sorting sequence will be
kept even if you change values in this column. This means if you change
a value in the sorting column, the changed data set will be placed at
the new position according to its new value. The sorting of a column
will be indicated by an arrow for the direction of the sorting (up or
down) and by a thicker right border of this column (see image below).
To adapt the width of the columns or the height of the rows either drag
the border with the mouse or double click the border to get the optimal
size for one column. You may also click on the
button for an optimal height of the rows or the button for an optimal width of the columns.
Handling the data
Find and replace
To use the find and replace functions you must either select a part of
the field in this column or click on the
button to select the entire column. You may then choose the function you
wish to apply (remove, insert, append or replace). To replace a part of
a text in the selected fields enter the text which should be replaced
and enter the replacement in the corresponding fields. To start the
replacement click the button. To insert a
string to the beginning of all entries in the selected fields click
the button. To append a string to all entries
in the selected fields click the button. To
remove all entries from the selected fields click the button.
Editing
Some columns can not be edited directly but are linked to external
modules or services. These columns appear as buttons. Simply click on
the button to call the service. If a value is linked to an entry in an
external module, the background will change to
[yellow] and you will not be able to
change the text.
Together with the links (in the example above [Link to
DiversityAgents]) you can select columns that
provide the possibility to release the links to the modules (e.g.
[Remove link for collector] in image above). These
columns will appear as buttons . Simply
click on the button related to a link to release the link to the
corresponding module. After that you can edit the text field containing
the linked value.
Some values are linked to a list of values. Use the drop-down list to
change the value in one of these columns.
Saving the data
To save all changes click on the button. To undo
the all changes since the last time the data sets were saved click on
the button. To save the changes in the current
data set use the save button. To undo the changes in the
current data set click the undo button. If you click
the OK button, you will be asked whether you would like to save
the changes before the window will be closed. If you click the
Cancel button or close the window your changes will not be
saved. To export the data shown in the grid as a text file with tabs as
column separators click on the export button.
Diversity Collection
Grids
Collection Specimen
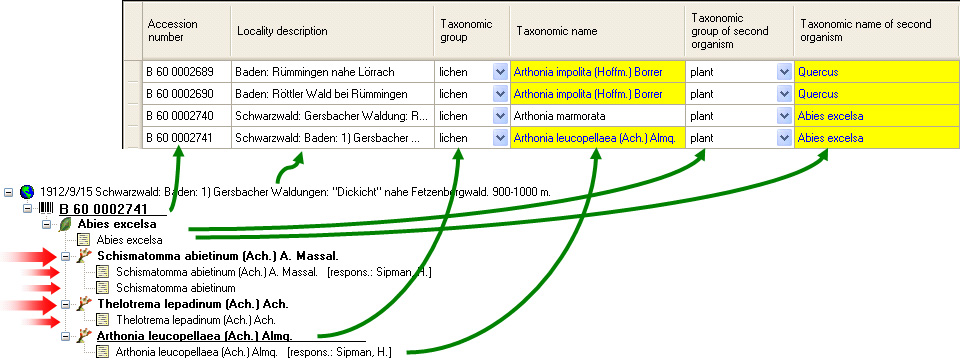
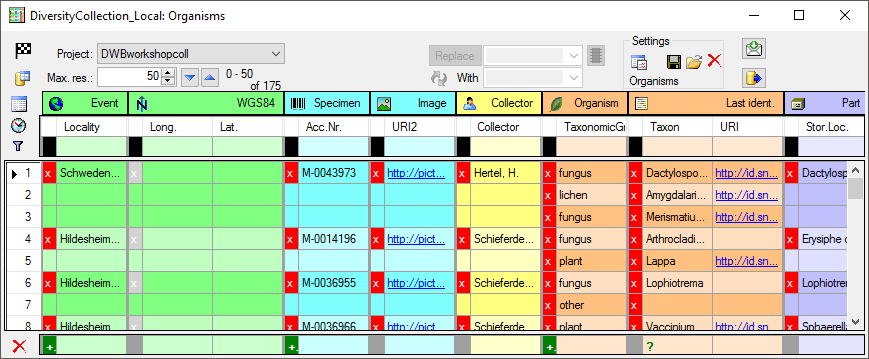
To edit the data of the specimens in a data grid choose the Grid mode for the specimen
from the menu. A window will open where every
data set for a specimen from the query result list is restricted to one
line. Please keep in mind you can only see a limited part of the data
while in this view. For example only the last identification of an
organism will be displayed. This is demonstrated in the image below
where two organisms, indicated with the red arrows, will not appear in
the grid. If you use the grid mode for the organisms, all organisms will
appear with their last identification.
Customizing
Customize visibility of fields
The selection of the visible fields can be adapted in the tree above the
list. If this part is hidden click on the
button to make it accessible. Change the selection of the columns and
click on the [Set columns] button.
Customize column width and sequence
To adapt the width of the columns or the height of the rows either drag
the border with the mouse or double click the border to get the optimal
size for one column. You may also click on the
button for an optimal height of the rows or the button for an optimal width of the columns. To change the
width and sequence of the columns simply use your mouse to drag the
columns to the position of your choice or adapt the width to your
preference. These changes will be saved for this session as well as for
the next time you use the grid mode. To return to the original sequence
of the columns click on the Reset sequence button.
Sorting of the data
To sort the data in the grid simply click in the header of the column
which you want to use as sorting column. The sorting sequence will be
kept even if you change values in this column. This means if you change
a value in the sorting column, the changed data set will be placed at
the new position according to its new value. The sorting of a column
will be indicated by an arrow for the direction of the sorting (up or
down) and by a thicker right border of this column (see image below).
Data handling
Find and replace
To use the find and replace functions you must either select a part of
the field in this column or click on the
button to select the entire column. You may then choose the function you
wish to apply (remove, insert, append or replace). To replace a part of
a text in the selected fields enter the text that should be replaced and
enter the replacement in the corresponding fields. To start the
replacement click the button. To insert a
string to the beginning of all entries in the selected fields click
the button. If the selected column is a link to a
module or webservice, a  button will
appear where you can search for a linked data set. The insert will set
the selected column and related columns according to the linked data
set. Thus, if you choose e.g. a value from the DiversityGazetteer, the
coordinates and the country will be changed as well. Click on the link
to see all related information. To reset the link use the
button will
appear where you can search for a linked data set. The insert will set
the selected column and related columns according to the linked data
set. Thus, if you choose e.g. a value from the DiversityGazetteer, the
coordinates and the country will be changed as well. Click on the link
to see all related information. To reset the link use the  delete button. To append a string to all entries in
the selected fields click the button. To
remove all entries from the selected fields click the button.
delete button. To append a string to all entries in
the selected fields click the button. To
remove all entries from the selected fields click the button.
Transfer from spreadsheet
You can transfer data from a spreadsheet e.g. Excel or Calc. Copy the
columns of this data from the spreadsheet and then insert it in
DiversityCollection. Click in the upmost left cell where this data
should be transferred to and use the context menu (click the right mouse
button) to insert the data.
Editing
Some columns can not be edited directly but are linked to external
modules or services. These columns appear as buttons. Simply click on
the button to call the service. If a value is linked to an entry in an
external module, the background will change to
yellow and you will not be able to
change the text.
Together with the links (in the example above [Link to
DiversityAgents]) you can select columns that
provide the possibility to release the links to the modules (e.g.
[Remove link for collector] in image above). These
columns will appear as buttons . Simply
click on the button related to a link to release the link to the
corresponding module. After that you can edit the text field containing
the linked value.
Some values are linked to a list of values. Use the drop-down list to
change the value in one of these columns.
If you click in the empty line at the base of the data grid, you will be
asked if you wish to create a new data set. The program will ask you for
a new accession number and the project of the new data set. Another way
to create a new data set is the copy button . Simply
click in the line you wish to create a copy of and then click on the
copy button . For details see the Data
section. A copy of the data set will be inserted at the base of the data
grid.
In the grid view for the organisms a part of the columns can not be
edited. These columns contain data which can be related to several
organisms. This is indicated by a gray background.
The Relation has two states:
either external  (the column
[Related specimen URL] will be shown in the interface)
or internal.
(the column
[Related specimen URL] will be shown in the interface)
or internal.  (the column
[Related specimen display text] will be shown in the interface)
Use the [Relation is internal] column to change the state and
the [Link to DiversityCollection for relation] column to set an
internal relation.
(the column
[Related specimen display text] will be shown in the interface)
Use the [Relation is internal] column to change the state and
the [Link to DiversityCollection for relation] column to set an
internal relation.
Saving the data
To save all changes click on the button. To undo
all changes since the last time the data sets were saved click on the button. To save the changes in the current data
set use the save button. To undo the changes in the
current data set click the undo button. If you click
the OK button, you will be asked whether you would like to save
the changes before the window will be closed. If you click the
Cancel button or close the window your changes will not be
saved. To export the data shown in the grid as a text file with tabs as
column separators click on the export button.
Inserting new data
To insert a new data set simply click in the last empty line of the data
grid. The program may ask you to specify a project in which the new data
should be placed. In the grid for the organisms a window will open as
shown below.
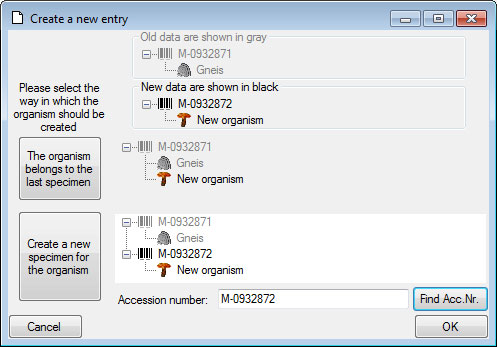
Here you have the option to insert the new data set of the organism in
the last specimen in the grid or to create a new specimen for the
organism. In the second case you can specify the accession number of the
new specimen. Use the Find Acc. Nr. button to search for the
next free accession number in the database which matches your entry in
the Accession number field.
For new data sets you can specify certain project settings e.g. the
material category of a part of the specimen. The taxonomic group of a
new organism will correspond to the first organism in your last specimen
unless you specify a certain taxonomic group in the project settings for
the project you are working in. To enter or change a setting you need
the module DiversityProjects. For further information please turn to
the documentation provided with this module.
Copy data
To copy a data set select the line of the data grid you wish to create a
copy of and click on the button. For further
details, see the chapter Copy specimen.
Diversity Collection
Grids
Organisms (Units)
To edit the data of the organisms in a data grid choose the Grid
mode for the organisms
from the menu. A window will open where every data set for an organism
from the query result list is restricted to one line. Please keep in
mind that you can only see a limited part of the data in this view. For
example only the last identification of an organism will be displayed.
In the grid view for the organisms a part of the columns can not be
edited. These columns contain data which can be related to several
organisms. This is indicated by a gray background.
Customize the window
To change the width and sequence of the columns simply use your mouse to
drag the columns to the position of your choice or adapt the width to
your preference. These changes will be saved for this session as well as
for the next time you use the grid mode. To return to the original
sequence of the columns click on the Reset sequence button.
To adapt the width of the columns or the height of the rows either drag
the border with the mouse or double click the border to get the optimal
size for one column. You may also click on the
button for an optimal height of the rows or the button for an optimal width of the columns.
The selection of the visible fields can be adapted in the tree above the
list. Change the selection of the columns and click on the Set columns button.
Analysis
In this grid you can edit up to 10 different types of analysis, however,
only the last analysis will be shown for each type. By default the
available analysis types will be generated dynamically depending on the
data. If you need an additional type in the grid, simply return to the
main form and enter the required type in one of the data sets. If you
wish to specify which analysis you want to see in the grid, you can set
the list in the options. Click on the button to open a
window as shown below.
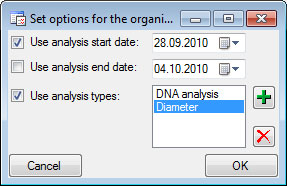
Here you can restrict the range of the dates of the analysis and the
types of the analysis which should be displayed. To change the entries
in the list use the  and buttons to add
or delete entries.
and buttons to add
or delete entries.
Sorting of the data
To sort the data in the grid simply click in the header of the column
which you want to use as sorting column. The sorting sequence will be
kept even if you change values in this column. This means if you change
a value in the sorting column, the changed data set will be placed at
the new position according to its new value. The sorting of a column
will be indicated by an arrow for the direction of the sorting (up or
down) and by a thicker right border of this column (see image below).
Handling the data
Some columns can not be edited directly but are linked to external
modules or services. These columns appear as buttons. Simply click on
the button to call the service. If a value is linked to an entry in an
external module, the background will change to
[yellow] and you will not be able to
change the text.
Together with the links (in the example above [Link to
DiversityAgents]) you can select columns that
provide the possibility to release the links to the modules (e.g.
[Remove link for collector] in image above). These
columns will appear as buttons . Simply
click on the button related to a link to release the link to the
corresponding module. After that you can edit the text field containing
the linked value.
Some values are linked to a list of values. Use the drop-down list to
change the value in one of these columns.
If you click in the empty line at the base of the data grid, you will be
asked if you wish to create a new data set. The program will ask you for
a new accession number and the project of the new data set. Another way
to create a new data set is the copy button . Simply
click in the line you wish to create a copy of and then click on the
copy button . For details see the Data
section. A copy of the data set will be inserted at the base of the data
grid.
In the grid view for the organisms a part of the columns can not be
edited. These columns contain data which can be related to several
organisms. This is indicated by a gray background.
Find and replace
To use the find and replace functions you must either select a part of
the field in this column or click on the
button to select the entire column. You may then choose the function you
wish to apply (remove, insert, append or replace). To replace a part of
a text in the selected fields enter the text which should be replaced
and enter the replacement in the corresponding fields. To start the
replacement click the button. To insert a
string to the beginning of all entries in the selected fields click
the button. To append a string to all entries
in the selected fields click the button. To
remove all entries from the selected fields click the button.
To save all changes click on the button. To
undo all changes since the last time the data sets were saved click on
the button. To save the changes in the current
data set use the save button. To undo the changes in the
current data set click the undo button. If you click
the OK button, you will be asked whether you would like to save
the changes before the window will be closed. If you click the
Cancel button or close the window your changes will not be
saved. To export the data shown in the grid as a text file with tabs as
column separators click on the export button.
To copy a dataset select the line of the data grid which you wish to
create a copy of and click on the button. A copy of
the selected data set will be added at the base of the spreadsheet.
Diversity Collection
Grid
Organisms of a specimen
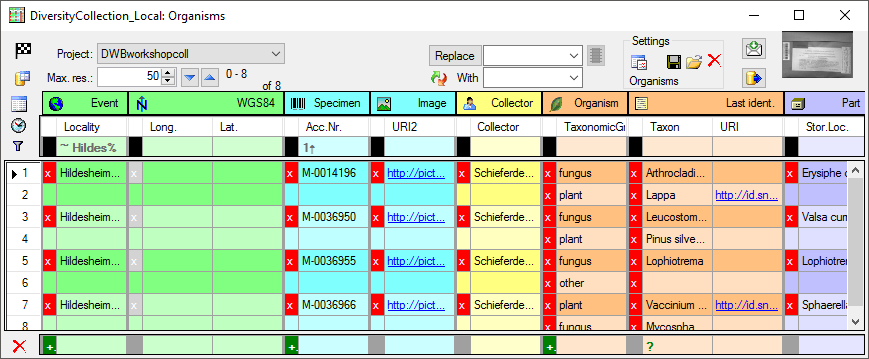
To edit the data of the organisms of a specimen select the specimen
entry in the tree and click on the  button in the panel on the right. A window as shown below will open with
the functionality of the grid for the organisms but
restricted to the organisms of the current specimen.
button in the panel on the right. A window as shown below will open with
the functionality of the grid for the organisms but
restricted to the organisms of the current specimen.
Diversity Collection
Grids
Specimen Parts
To edit the data of the parts in a data grid choose the Grid mode for the
Parts... from the menu. A window will open where every data set
for a part from the query result list is restricted to one line. Please
keep in mind you can only see a limited part of the data while in this
view. For example only the last processing or analysis of a certain type
of a part will be displayed.
Customize the window
To change the width and sequence of the columns simply use your mouse to
drag the columns to the position of your choice or adapt the width to
your preference. These changes will be saved for this session as well as
for the next time you use the grid mode. To return to the original
sequence of the columns click on the Reset sequence button.
To adapt the width of the columns or the height of the rows either drag
the border with the mouse or double click the border to get the optimal
size for one column. You may also click on the
button for an optimal height of the rows or the button for an optimal width of the columns.
The selection of the visible fields can be adapted in the tree above the
list. Change the selection of the columns and click on the Set columns button.
Analysis
In this grid you can edit up to 10 different types of processing,
however, only the last analysis will be shown for each type. To specify
which analysis you wish to see in the grid click on the button to open a
window as shown below.
Here you can restrict the range of the dates of the analysis and the
types of the analysis which should be displayed. To change the entries
in the list use the
and buttons to add
or delete entries. For taxonomic groups which miss certain types of
analysis the columns will be blocked.
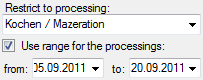
Processing
In this grid you can display up to 5 different processings, however,
only the last processing will be shown. You can define a time range for
the processing that should be displayed and / or restrict the processing
to a certain type (see image below). For material categories which miss
certain types of processing the columns will be
blocked.
Sorting of the data
To sort the data in the grid simply click in the header of the column
which you want to use as sorting column. The sorting sequence will be
kept even if you change values in this column. This means if you change
a value in the sorting column, the changed data set will be placed at
the new position according to its new value. The sorting of a column
will be indicated by an arrow for the direction of the sorting (up or
down) and by a thicker right border of this column (see image below).
Selecting of the data
To restrict the data in the grid you can filter an entry. Select the
entry for which you want to filter and click on the  filter button. To remove data from the grid select the
rows which should be removed and click on the
filter button. To remove data from the grid select the
rows which should be removed and click on the  button.
Handling the data
Some columns can not be edited directly but are linked to external
modules or services. These columns appear as buttons. Simply click on
the button to call the service. If a value is linked to an entry in an
external module, the background will change to
[yellow] and you will not be able to
change the text.
Together with the links (in the example above [Link to
DiversityAgents]) you can select columns that
provide the possibility to release the links to the modules (e.g.
[Remove link for collector] in image above). These
columns will appear as buttons . Simply
click on the button related to a link to release the link to the
corresponding module. After that you can edit the text field containing
the linked value.
Some values are linked to a list of values. Use the drop-down list to
change the value in one of these columns.
If you click in the empty line at the base of the data grid, you will be
asked if you wish to create a new data set. The program will ask you for
a new accession number and the project of the new data set. Another way
to create a new data set is the copy button . Simply
click in the line you wish to create a copy of and then click on the
copy button . For details see the Data
section. A copy of the data set will be inserted at the base of the data
grid.
In the grid view for the parts a part of the columns can not be edited.
These columns contain data which can be related to several parts. This
is indicated by a gray background.
Find and replace
To use the find and replace functions you must either select a part of
the field in this column or click on the
button to select the entire column. You may then choose the function you
wish to apply (remove, insert, append or replace). To replace a part of
a text in the selected fields enter the text which should be replaced
and enter the replacement in the corresponding fields. To start the
replacement click the button. To insert a
string to the beginning of all entries in the selected fields click
the button. To append a string to all entries
in the selected fields click the button. To
remove all entries from the selected fields click the button.
To save all changes click on the button. To undo
all changes since the last time the data sets were saved click on the button. To save the changes in the current data
set use the save button. To undo the changes in the
current data set click the undo button. If you click
the OK button, you will be asked whether you would like to save
the changes before the window will be closed. If you click the
Cancel button or close the window your changes will not be
saved. To export the data shown in the grid as a text file with tabs as
column separators click on the export button.
To copy a dataset select the line of the data grid which you wish to
create a copy of and click on the button. A copy of
the selected data set will be added at the base of the spreadsheet.
Diversity Collection
Grids
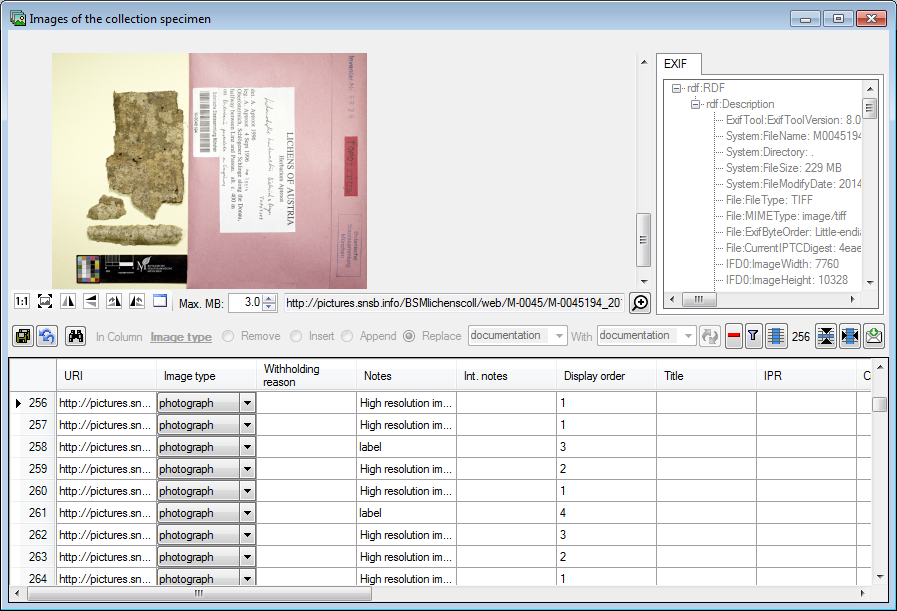
Specimen images
To edit the data of the images in a data grid choose the Grid mode for the
Images... from the menu. A window
will open where every data set for an image from the query result list
is restricted to one line (see below).
Sorting of the data
To sort the data in the grid simply click in the header of the column
which you want to use as sorting column. The sorting sequence will be
kept even if you change values in this column. This means if you change
a value in the sorting column, the changed data set will be placed at
the new position according to its new value. The sorting of a column
will be indicated by an arrow for the direction of the sorting (up or
down).
Selecting the data
To restrict the data in the grid you can filter an entry. Select the
entry for which you want to filter and click on the filter button. To remove data from the grid select the
rows which should be removed and click on the
button.
Handling the data
Some columns can not be edited directly because they are linked to
external modules or services. These columns appear as buttons. Simply
click on the button to call the service. If a value is linked to an
entry in an external module, the background will change to
[yellow] and you will not be able to
change the text.
Next to the links there are columns which allow you to remove a link to
the corresponding module . Simply click
on the button to remove the link. After that you can edit the text field
containing the linked value.
Some values are linked to a list of values (e.g. Image type). Use the
drop-down list to change the value in one of these columns.
Find and replace
To use the find and replace functions you must either select a part of
the field in this column or click on the
button to select the entire column. You may then choose the function you
wish to apply (remove, insert, append or replace). To replace a part of
a text in the selected fields enter the text which should be replaced
and enter the replacement in the corresponding fields. To start the
replacement click the button. To insert a
string to the beginning of all entries in the selected fields click
the button. To append a string to all entries
in the selected fields click the button. To
remove all entries from the selected fields click the button.
To data are automatically saved when you close the window. To undo all
changes click on the button.
Diversity Collection
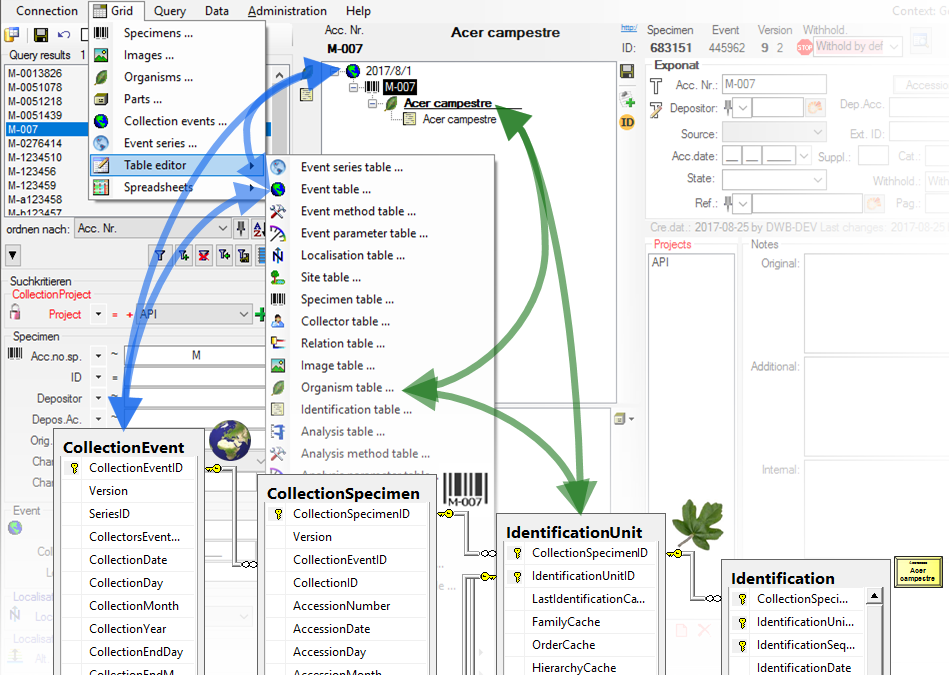
Table Editors
For the data selected in the main window the table editors offer a
direct access to the tables of the database as shown in the image below.
In the hierarchy tree of the main window every entry corresponds to a
table in the database, marked for the image below for the tables
CollectionEvent and IdentificationUnit. Underneath the menu
Grid select one of the Table editors (see below). For an introduction
see a short tutorial
.
A window with the content of the table will open. Columns with a [gray
background] can not be edited here.
Columns with a [light gray
background] are linked to the
contents of lookup tables where you can change according to the contents
of these tables. If you are using the optimzed query
 certain columns that are linked to lookup
tables show the translated content instead of the IDs. With the
[ ID ]
button you can change back to the original, not translated content of
the table. The tables below are examples for those that are included for
direct access via a table editor:
certain columns that are linked to lookup
tables show the translated content instead of the IDs. With the
[ ID ]
button you can change back to the original, not translated content of
the table. The tables below are examples for those that are included for
direct access via a table editor:
With the button you can set the widths of
the columns according to the header and the content. With the  button the width is set to the
content. After the column width is set, this will be indicated with a
yellow background
button the width is set to the
content. After the column width is set, this will be indicated with a
yellow background  . Click again on the button to release the setting of the
column width .
. Click again on the button to release the setting of the
column width .
Data Handling
For the data selected in the main window the table editors offer a
direct access to the tables of the database. The menu Data -
Table editors provide an editor for selected tables within the database.
A window with the content of the table will open. Columns with a gray
background can not be edited here. Columns with a light gray background
are linked to the contents of lookup tables where you can change
according to the contents of these tables.
Select  Set timeout ... from the menu to
increase the default timeout from 5 seconds to a higher value, e.g. for
greater amounts of data.
Set timeout ... from the menu to
increase the default timeout from 5 seconds to a higher value, e.g. for
greater amounts of data.
Editing
You can either edit the contents of the table directly or perform
changes to any number of marked fields. To mark a whole column use
the button. Once you have selected the
contents to change, select one of the modes of change that appear in the
upper left corner. The modes of change are:
- Insert: Insert the given value at the
beginning of the content
- Append: Append the given value at the end of
the content
- Replace: Replace a string in the content
with the given value
- Clear: Remove the content
After selecting the change mode, enter the text in the field where
necessary and click on the corresponding button to perform the changes
Deleting
If you select whole lines, a delete button will appear. Click on it to remove the selected datasets from the database.
Filtering
To filter the content of the table, click in the column that should be
used for filtering. Then choose the mode of comparision:
- = : The content must be exactly like the given value
- ~ : The content must contain the given value
- ≠ : The content must be different to the given value
If you want the filtering to be case sensitive, choose the
 a<>A option. After all parameters are set,
click on the filter button. To undo the filtering, click
on the
a<>A option. After all parameters are set,
click on the filter button. To undo the filtering, click
on the  button. This will reset the data to the
last saved version. If you want your changes to be saved, click the
button before you reset the filtering. If you close
the window all changes so far will be saved automatically. So if you do
not want to save your changes, click on the
button before closing the window.
button. This will reset the data to the
last saved version. If you want your changes to be saved, click the
button before you reset the filtering. If you close
the window all changes so far will be saved automatically. So if you do
not want to save your changes, click on the
button before closing the window.
Export
To export the data as a tab separated text file, click on the
button. The file will be automatically saved in
the client-folder.
To export the data in a SQLite database click on the
 button. The data
will be exported into the SQLite database DiversityAgentTables.sqlite in
the folder Export in your application directory. If you want to save
previous exports, please rename the SQLite database or copy it to a
different directory.
button. The data
will be exported into the SQLite database DiversityAgentTables.sqlite in
the folder Export in your application directory. If you want to save
previous exports, please rename the SQLite database or copy it to a
different directory.
Log data
To see the log data of the table, you can click on the
button. The content of the log table can not be
changed, but is read only.
Diversity Collection
Spreadsheets
The program provides several spreadsheets with different focus:
- Event
- Main table: CollectionEvent
- The focus is the collection event
- TK25
- Editing data that are linked to a TK25 entry.
- The sheet provides a link to distribution maps with the option to select data via these maps
- Organism
- Mineral
- Focus on mineral specimen
- Part
- Collector
- Main table: CollectionAgent
- All collectors of a specimen
- Image
- Main table: CollectionSpecimenImage
- All images of a specimen
- Analysis
- Main table: Analysis
- Administration of the analysis
The spreadsheets similar to the grids provide a tabular access to the
data. In addition you can search and filter data independent from the
main form. For an introduction see two short tutorials
(overview),
(tables and columns). To open a spreadsheet, choose
Grid -
Spreadsheets - and then one of the provided versions, e.g.
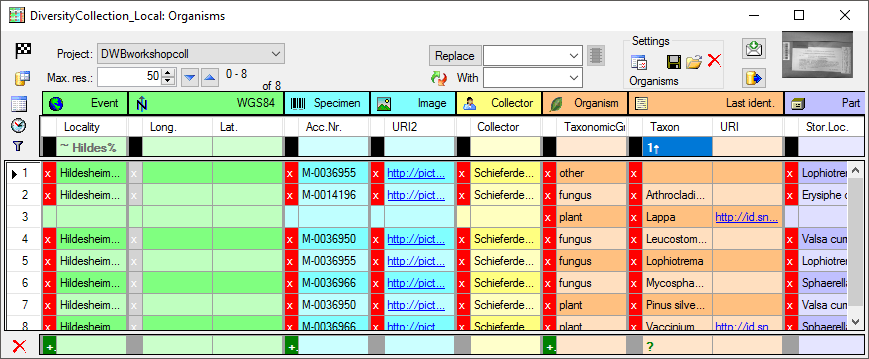
Organisms from the menu. A window as shown below will open where the data are marked and organized according to the database tables. If values in one of the tables are missing, this will be indicated with a grey background. The colors correspond to the overview for the database.
Start
To use any of the spreadsheets as a starting window, click on the  button. Now the application will directly open the spreadsheet with the same parameters when you close it.
Database
To change to another database, click on the  button and choose the database as described here.
Please keep in mind that the main form will connect to the new selected
database.
button and choose the database as described here.
Please keep in mind that the main form will connect to the new selected
database.
Project
 If a user has read only projects available, a
 button will appear in front of the project. Click on this button to change to the list of projects with read only access. The window will change into the Read only mode (see below). To return to the list of projects with write access, just click no the button again. After changing the source for the project list, the project label will blink with red to remind you, to select a project from the list.
Getting the data
The data are always restricted to one project, selected in the corresponding field (see image above) and restricted to the first top lines as specified in the Max. res. field. To change to the next or previous block of data, use the  resp.
resp.  button.
The program will organize the data in blocks indicated by the colors as
shown above. In the example above the first block contains 2
Organisms
all belonging to the block starting with Hildesheim...
for the Event
and M-0014196 for the
Specimen. The next block then starts with
Hildesheim... indicated by a
change in the color containing 2 Organisms. For most of the spreadsheets, the
presence of the Event in the data is a
prerequisit. As long as you do not sort or filter the data (see below), these blocks will be consistent with the data. As soon as you filter or sort the data, these blocks may be split and may not correspond to the data blocks in the database any more. In the example below you see the effect of sorting by the column Taxon on breaking up the blocks. E.g.
the block for the specimen M-0036950
is split into 2.
SQL
The query used for the retrieval of the data can be accessed with a click on the SQL button.
Filtering
To filter the content of a table you can apply a filter either on the whole table or on each of the columns of the table.
Table filter
This filter will apply on the whole table. Click in the black box next
to the filter area and select one of the filter options as shown below.
- ♦: Filled (all visible columns)
- ◊: Empty (all visible columns)
- •: Data in table do exist
- Ø: Data in table do not exist
Tutorial:
Column filter
Tutorial:
This filter will apply on a single column of a table. To set a filter click in the field underneath the column name. A window as shown below will open. With a click on the add button you can enter a value from the current content of the column as filter.
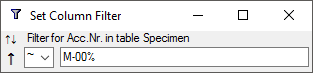
Here you set the sorting (see below), enter the search string and choose among several ways of comparison with the contents in the database:
- =: The content must be exactly like the given value
- ≠: The content must be different to the given value
- ~: The content must be similar to the given value, use wildcards % for any string or _ for a single character
- ¬: The content must NOT be similar to the given value, use wildcards % for any string or _ for a single character
- <: The content must be smaller than the given value
- >: The content must be bigger than the given value
- |: The content must be in a given list of values
- ∉: The content must NOT be in a given list of values
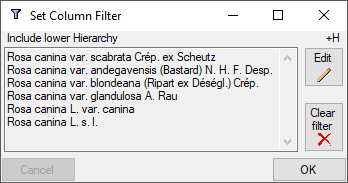
For columns linked to modules of the DiversityWorkbench there may be additional options. E.g. for a column linked to DiversityTaxonNames you get 3 additional options:
- +H: Include lower Hierarchy
- +S: Include Synonyms
- +H+S: Include lower Hierarchy and Synonyms
After selecting one of these options, you will be asked for the database
and the project where the data should be taken from. In the next step
the corresponding names as retrieved from the selected source will be
listed (see below). To change the filter click on the
 button and on the delete button to
remove it.
button and on the delete button to
remove it.
Sorting
↓↑ Tutorial:
The data can be sorted by each visible column. If you click into the field underneath the column name a window will open as described above. To change between the modes of sorting, just click on the current
sorting. The modes are:
- -: Not sorted
- ↑: Sorted in ascending sequence
- ↓: Sorted in descending sequence
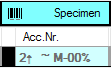
After all parameters are set, the sort mode and filter settings will be
shown in the field underneath the column name (see image below). The
number indicates the sequence within the sorting columns.
Timeout
After all parameters are set, click on the button. If for any reason you get a timeout, meaning the query for the data takes too long, either simplify your query or adapt the time for the query after a click on the button. If you do not want to restrict the time for the queries, set the value to 0. The
default value is 30 seconds.
Read only mode
<>  Tutorial:
The formatting of the sheet including the color indication of tables and data blocks is rather time consuming. If these are not needed, e.g. for exporting the data, you can switch to
the Read only mode for higher performance. For projects with read only access (see above), the mode is automatically set to Read only.
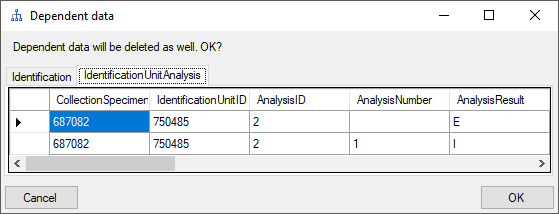
Editing
To edit the data, just change them. If data are missing, type or select a value in the corresponding field. To remove data, click on the x field. This will remove all entries dependent on this entry that means all data right from the entry in the same line resp. block and any depending data. If there are any depending data, a window will open as shown below listing these data. Click OK if you want to remove the selected data including all depending data as shown in the window.
To change the content of several values in a column, either select the whole column with a click on the button or select the fields manually. To avoid the pop-up of data-entry windows e.g. for columns with a lookup list, click no the  button. Once you have selected the
contents to change, select the mode of change:
button. Once you have selected the
contents to change, select the mode of change:
- Prepend: Insert the given value at the beginning of the content
- Append: Append the given value at the end of the content
 Overwrite: Remove current content and insert given value
- Replace: Replace a string in the content with the given value
- Clear: Remove the content
After selecting the change mode, enter the text in the field where necessary and click on the corresponding button to perform the changes.
With the context menu (mark area and right click) you can
Remove data (for single data fields with a list behind),  Tranfer or Copy the content into the clipboard and
  Insert the content
of the clipboard into the selected cells. Tutorial:
Insert the content
of the clipboard into the selected cells. Tutorial:
Locked columns
Columns that can not be edited are indicated with a lighter background color of the header and a gray text of title and content. These columns contain e.g. database generated content or data from lookup tables.
Inclusion of RowGUID
By default the primary key can not be changed in the spreadsheet. In some cases you may want to change parts of the primary key. To do this, you must include the column RowGUID in the list of selected columns. The program will ensure that the changed data do not collide with existing data, that is having the same primary key. See an example in a short tutorial:
Fixed sources
 Tutorial:
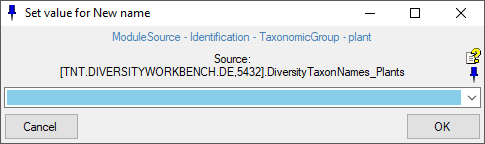
For columns that are linked to a remote module, you can fix the
source for the query. If the source is fixed, the query will directly contact the source as shown in the image below. To set resp. change the source, click on the button. A window will open where you can select either a webservice or a source database together with a project within the database. To remove the source, click on the
button (only visible if a source is present).
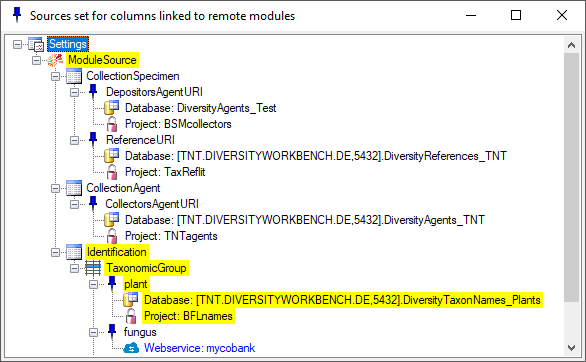
To see an overview for the fixed sources, click on the
 button. A window will open where all sources are listed with the source for the current
column marked with a yellow
background.
button. A window will open where all sources are listed with the source for the current
column marked with a yellow
background.
A "right-click" on the button in the main form will show the settings as well and with a click on the
button you can set the connection for the selected column. If a column depends on values from the data as for example the relations to the module DiversityTaxonNames with a dependence on the taxonomic group, the relation will change with the selected row, depending on the data retrieved from the selected row. If there is no connection to the related module defined, the button will appear gray
 and if the column has no relation to a module, the button will appear like
If the source is not fixed the query will start as described
here.
Settings
-
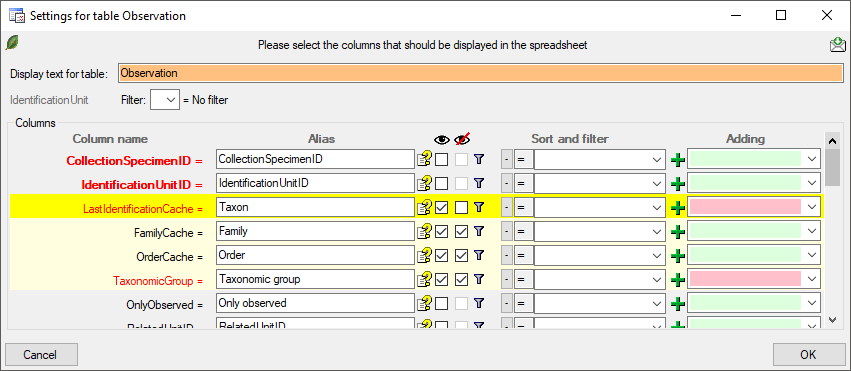
To change the data shown in the query results, either click on the header of the tables, e.g. Event for that table. A window as shown below will open where you can select or deselect columns, change their headers etc. Red columns need to be filled (either by the database, the program or the user). In the Alias field you can rename the columns to your preferences. The
button will show a description of the columns. For columns linked to a module, the current settings for the link will be shown in addition to the description. To display a column in the sheet use the  checkbox .
If a column is needed, but should be hidden, select the
checkbox .
If a column is needed, but should be hidden, select the
 checkbox. Displayed columns are indicated by a yellow background while hidden columns get a light yellow background. Certain columns are required (indicated by a purple color) and can not be removed e.g. if they are involved in a link to a remote module like in the example below the columns FamilyCache and OrderCache. Columns linked to a module are indicated by a blue color.
The  button allows you to include one of the tables missing in the sheet (see image below). After selection of the table, select the column(s) you want to include in the sheet as shown in the image above.
To store resp. load settings, use the resp.
 button. If a setting file has been corrupted click on the delete button to remove it and restart with factory settings. The spreadsheet will always start with the previous settings. The location where the settings are stored are set under
Administration -
button. If a setting file has been corrupted click on the delete button to remove it and restart with factory settings. The spreadsheet will always start with the previous settings. The location where the settings are stored are set under
Administration -  Resources directory ... . For an introduction see a short tutorial
.
Resources directory ... . For an introduction see a short tutorial
.
Column width
Tutorial:
The width of the columns can be set manually (in the filter area) or automatically with a click on the button. A window will open where you can choose and set the parameters for setting
the column width.
Adding
Tutorial:
To add new data, use the area underneath the data table. You can enter preset values that will be used for the new data. If the new data should be added to existing entries, select the corresponding row. Then click on the + field of the datarange that should be inserted. If preset values are given, all corresponding tables will be filled together with the new inserted data. Defaults for the responsibles can be set under Administration - Customize Display. If a column is linked to a remote module, the corresponding columns will be filled together with the selection of the link, so e.g. if you select a link for a taxonomic name to a DiversityTaxonNames the columns for the taxon and if available the familiy etc. will be filled as well. To remove a linked value, select it a choose Remove from the
context menu (right click).
Export
Tutorial:
To export the data as a tab separated text file (UTF8), click on the
button. You will be asked if you want to include the hidden columns. These are the primary keys you may need for statistic evaluations etc.
Feedback
To send a feedback to the developer of the software, create a screenshot and click on the button.
Details
Tutorial:
To see all details of a dataset, select the dataset in the sheet and click on the DWB button. A window, corresponding to the main form will open, showing all data related to the selected specimen.
Image
Tutorial:
If an image is present a preview will be shown in the right upper area of the window. Click on it to see the image in a separate form. The images are restricted to the first image of one source, so e.g. in the organisms sheet only the first image of the specimen linked with this organism will be shown while images of e.g. linked to none or another organism or the collection event will not be addressed.
Subsections of Spreadsheets
Diversity Collection
Spreadsheet
Maps
Introduction:
For certain spreadsheets you can display the content in a map. The
content will be displayed with the GIS-Editor like in the example below.
To set the symbols etc. representing the values, click on the  button. A window as shown below will open, where
you can set the parameters for the map.
button. A window as shown below will open, where
you can set the parameters for the map.
Transparency
For the creation of heat maps, the transparency of the symbols displayed
in the map can be set to a value below 255 (= no transparency).
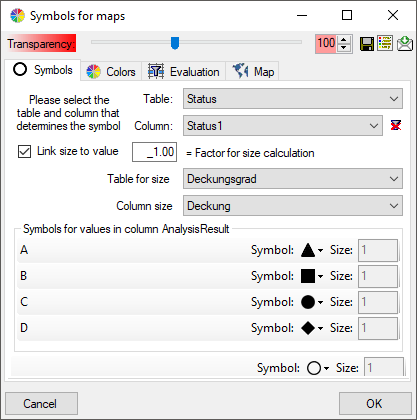
Symbols
Introduction to  Symbols:
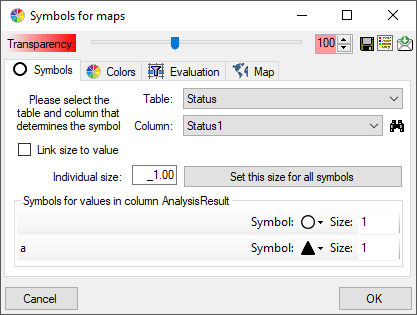
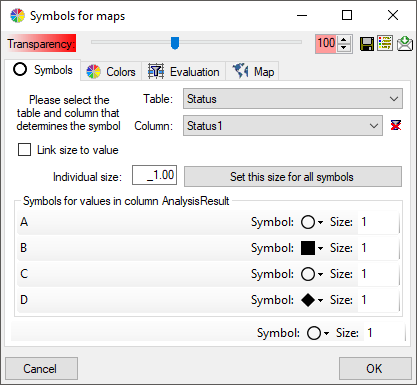
The symbols can be linked to the value within the database. A typical
example would be the status of a plant, e.g. endagered, rare etc. stored
as an analysis. Choose the Table where the values should
be taken from. Now you can choose the column within the table. The
different values will be listed and you can attribute a symbol together
with the size to every listed value. In the image below, the symbols are
linked to the values of a column named Last Nr for a certain analysis.
The tables in the drop down list (see above) correspond to the content
and definitions in the spreadsheets. Accordingly the values the symbols
are linked to are restricted to the current content of the spreadsheet.
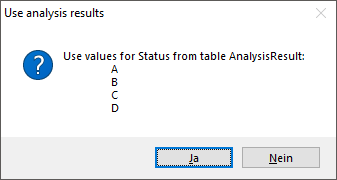
As an alternative and in preparation for data containing other values to
get the whole range of possible values you can select the source for the
values from the whole database. Click on the  button
to select the source table. The programm will try to find the relevant
data an make a proposal as shown in the image below.
button
to select the source table. The programm will try to find the relevant
data an make a proposal as shown in the image below.
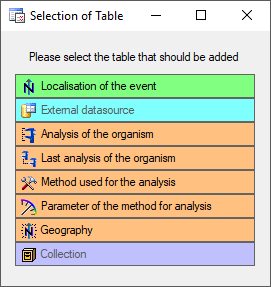
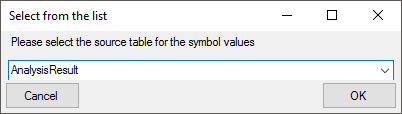
If the proposal does not fit, set the source manually: In the window
that will open as shown below, choose the source table for the values
and click OK. (The table names in this list correspond to those in the
database)
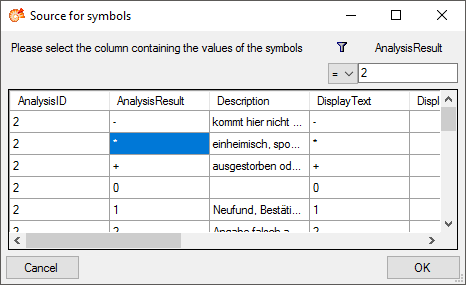
This will open the source table as shown below. Here choose the column
for a filter, e.g. AnalysisID, select the type of comparision and enter
the restriction value. Now you can click on the
button to restrict the values. In the example below the values were
restricted to the analysis with the ID = 2. Finally select the column
containing the values you need (AnalysisResult in the example below) and
click OK (see below).
Now all values from the source are listed, not only those contained in
the data form the spreadsheet (see below). The button
will change to  and will
now remove the source, to return to the values contained in the
spreadsheet. If certain values should not appear in the map, choose
as symbol.
and will
now remove the source, to return to the values contained in the
spreadsheet. If certain values should not appear in the map, choose
as symbol.
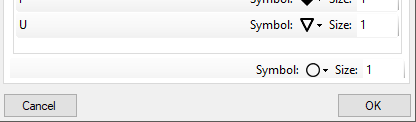
If the list does not contain a missing value, a separate control will
appear at the end of the list, where you can set the symbol for missing
values (see below).
The size of the symbols can be set either for every symbol or for all
symbols with the button Set this size for all
symbols. Another option is to link the size of the symbols to a
numeric value within the data (see below). Choose the table and the
column within this table containing the numeric value.
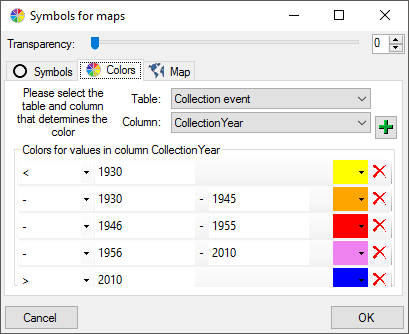
Colors
Introdoction to colors:
The colors can be linked to numeric values within the database. Select
the table and the column where the values should be taken from. Now
click on the add button to add colors and the
restrictions linked to the colors as shown below.
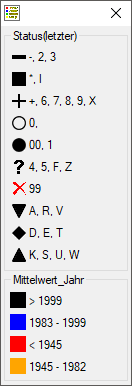
Legend
Introduction to  legend:
With a click on the button, you can open a window
listing all symbols and colors with their attributed values (see below).
In the spreadsheet window, click on the button
underneath the button to open the legend.
Evaluation
There are 3 types of maps available:
Map for WGS84 geography of organisms
For this map type you have to set the table and the column containing
the WGS84 geography, i.e. a content
like POINT(45 … ) for the organism as shown below. Every entry will
be shown in the map with its exact geography.
Map with WGS84 coordinates
 For this map type you have to set the table and the column containing
the WGS84 geography, i.e. a content
like POINT(45 … ) for the collection event as shown below. Every entry
will be shown in the map with the symbol placed in the center of its
geography.
For this map type you have to set the table and the column containing
the WGS84 geography, i.e. a content
like POINT(45 … ) for the collection event as shown below. Every entry
will be shown in the map with the symbol placed in the center of its
geography.
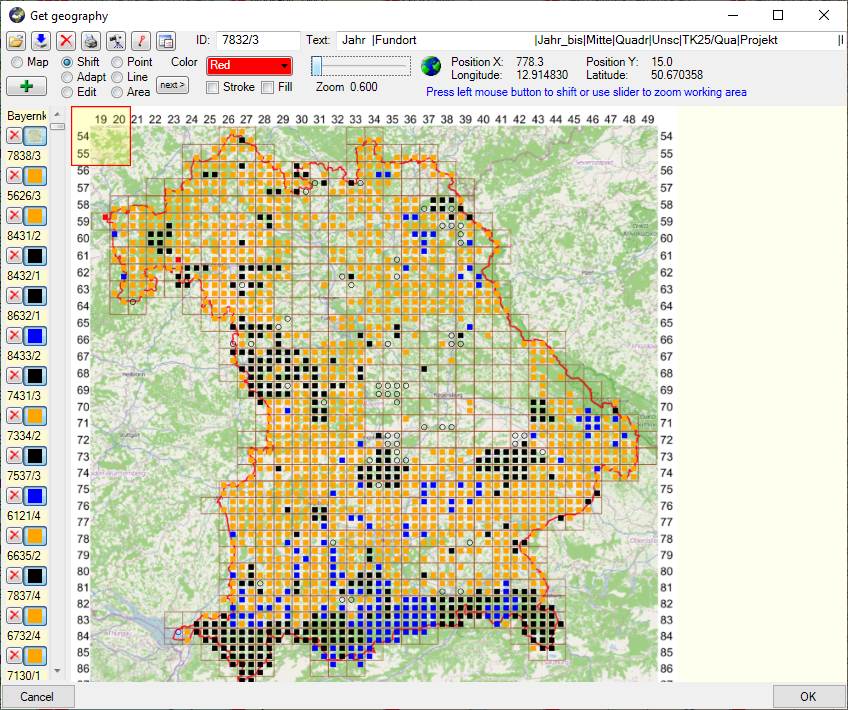
Map for objects aggregated according to TK25 quadrants
 Filter table /
Column: For this map type all objects within a TK25 quadrant will be aggregated to one
value. For the filter according to which the aggreagation is performed,
you have to select the table and the column containing the combination
of the TK25 identifier and the quadrant (see below).
Filter table /
Column: For this map type all objects within a TK25 quadrant will be aggregated to one
value. For the filter according to which the aggreagation is performed,
you have to select the table and the column containing the combination
of the TK25 identifier and the quadrant (see below).
 Gazetteer for
retrieval of TK25 coordinates. The coordinates for the symbols
will be obtained from a gazetteer module. Please select the source as
shown in the example below.
Gazetteer for
retrieval of TK25 coordinates. The coordinates for the symbols
will be obtained from a gazetteer module. Please select the source as
shown in the example below.
Sequence of the
symbols as shown in the map: The sequence of the symbols resp.
the states linked to these symbols can be set here. Use the add button to add an entry at the end of the list and
the delete button to clear the whole list. To remove a
single entry from the list, just click the entry you want to remove.
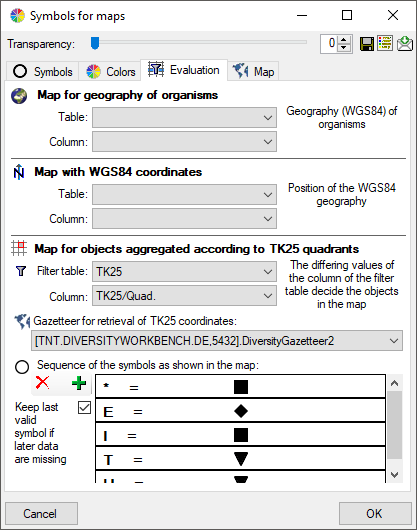
With the option Keep
last valid symbol if later data are missing you can keep the last
valid symbol if in the later evaluated data the correspondig values are
missing.
Map
To display your data in a predefined map you can set this map with a
click on the open button as shown below.
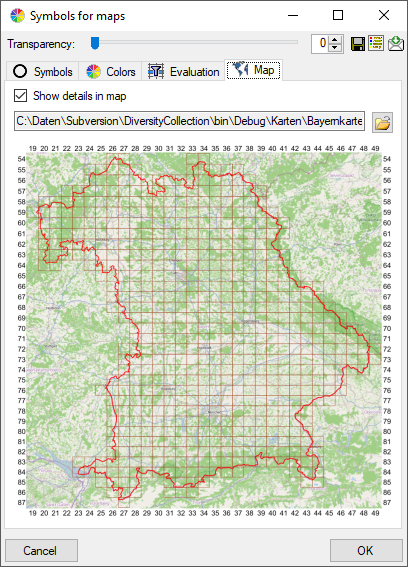
With the option Show details in map the tooltip
in the map will display the details of the data as selected in the
spreadsheet (see below). The widths in the tooltip roughly corresponds
to those set in the spreadsheet. Tutorial:
Maps for organism geography, WGS84 coordinates of the collection event and TK25
Tutorial:
After the parameters for the map are set you can choose among 3 types of
maps:
Map with WGS84 geography of the organisms
This map will show the geography of the organisms.
Map with WGS84 coordinates of the collection event
This map will show all entries with a WGS84
geography.
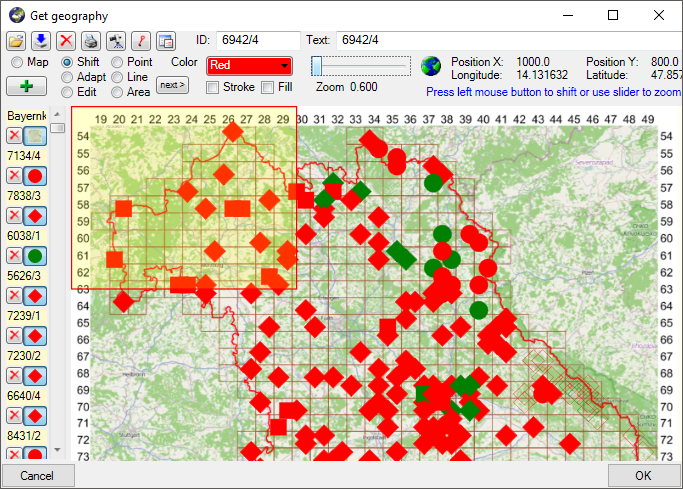
Map for objects aggregated according to TK25 quadrants
This map will aggregate all entries according to the TK25 quadrants as
shown below.
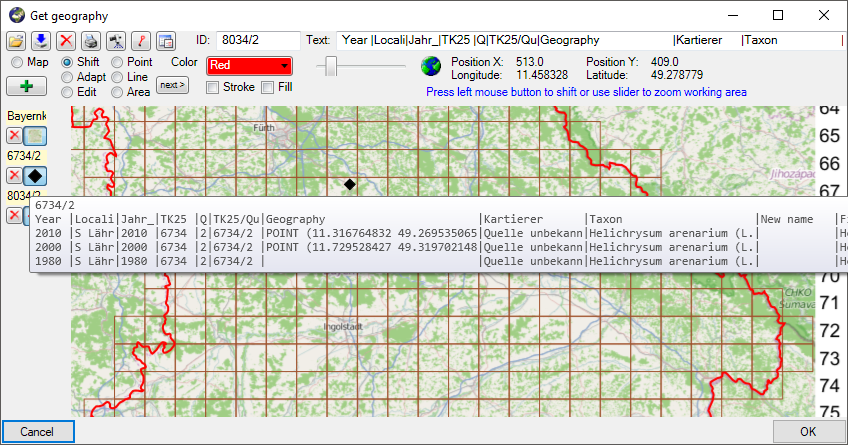
To select the data that should be edited either use the frame (as
described in GIS: Save samples and GIS:
Settings ) or select resp. deselect single data
with the mouse. Click OK to close the map and return to the spreadsheet
containing only the data selected in the map for further editing. For
the TK25 map the filter will be set for the TK25/Quadrant column while for the WGS84 map the filter will be set for the
column IdentificationUnitID
corresponding to organisms shown in the map. The column
IdentificationUnitID will be shown in the spreadsheet if you use the
later filter. Short tutorial:
As only one symbol and color can be shown for every quadrant, a certain
routine is used for the determination.
Color: For the color sortable
values must be provided, e.g. the year or a period. The sorting will be
according to the values were the highest value (e.g. the last year or
period as determined by the user, see above) is preferred.
Symbol: For the symbol the sorting
is determined by the user (see above).
The default routine for the determination:
- Reduce the values for the quadrant to the first digit e.g. 2413 will
be reduced to 2
- Test every data row in the table that corresponds to the filter value
(e.g. TK25 + Quadrant as determined by the user, see above).
- The geography can not be determined - ignore this row. (The
geography is determided via a gazetteer, see above)
- The value for the color is missing - ignore this row.
- The value for the color found in the data row is higher than the
value found so far
- Use this row to determine the color
- The value for the color in the data row is higher than the
color value associated with the symbol found so far
- Use this row to determine the symbol
- The row contains NO value for the symbol and the option
" Keep last valid symbol if later data
are missing" is NOT selected
- Use the symbol for missing values (determined by the user,
see above)
- The value for the color in the data row is equal to the color
value associated with the symbol found so far
- The value for the symbol in the row is above the value found so
far
- Use this row to determine the symbol
- No value for a symbol is found
- Use the symbol for missing values (determined by the user, see
above)
Diversity Collection
Collection Event
Main sectors
The image below gives you a overview of the main parts related to the collection event.
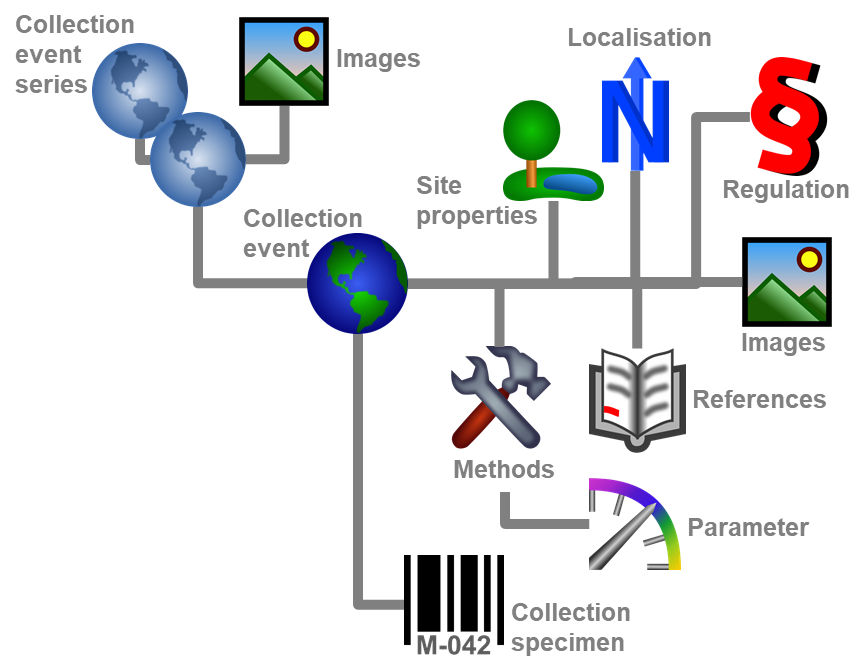
Specimens stored in a collection are gathered during a CollectionEvent.
This CollectionEvent keeps for example information about the geographic
locality, the habitat, the collection date. During a CollectionEvent
several specimens may have been collected. To create a new event for a
specimen click on the button. If a specimen has
not been assigned to a CollectionEvent, you can assign the specimens to
an existing event with a click on the  button. If you assign the specimen to an existing event, a window will
open where you can search for the events already included in the
database as shown below. Choose an event and click OK to assign the
specimen to this event. If you click OK without selecting any
CollectionEvent, the current CollectionEvent will be removed from the
CollectionSpecimen.
button. If you assign the specimen to an existing event, a window will
open where you can search for the events already included in the
database as shown below. Choose an event and click OK to assign the
specimen to this event. If you click OK without selecting any
CollectionEvent, the current CollectionEvent will be removed from the
CollectionSpecimen.
To get access to the collection event data independent of specimen select Data - Collection event… from the menu.
In the tree view the CollectionEvent is symbolized by an
icon as shown below.
The CollectionEvents can be organized in a hierarchy either by using
CollectionEventSeries or sampling plots. If your CollectionEvents belong
e.g. to an expedition, you should preferably use CollectionEventSeries
for the organization.
If your samples are taken e.g. on a regular basis from permanent
sampling plots, you may prefer to use the module DiversitySamplingPlots
to document the geography and other details of the sampling plots and
use the CollectionEvents only to document the collection date.
To edit the data of the CollectionEvent choose it in the tree view to
open the detail fields as shown below. If the collection date does not
correspond to a certain day, you may use the Suppl. field to enter
e.g. a range or a series of dates or the T.span field to document a
certain time span.
The text shown in the tree view is composed of the date of the
CollectionEvent and the description of the locality. For each
CollectionEvent you can enter several geographicallocations and properties. To see the
locality according to the coordinates stored in the database you can
check the Maps. For each CollectionEvent you can enter
images related to this event.
If other specimens were collected during the same CollectionEvent, they
will be displayed once the entire hierarchy of the EventSeries is shown.
To do this click on the button in
the panel on the left side of the tree. See
EventSeries for further details. You can also move a
specimen to another event by drag and drop.
Besides of a plain text description of the methods used during the
CollectionEvent, you may insert methods as defined in the chapter
Methods. Use the and
buttons to add or remove methods from the list
(see below)
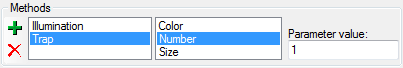
If parameters are added to the methods after you added the method to the
event, these new parameters will not automatically be available in the
event method. The new parameters must be added via the Maintenance or with a click on the add button. A window as shown below will open where you
can select the parameters that may be added.
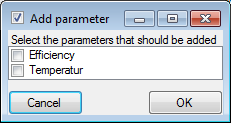
Data are stored in the table
CollectionEvent.
Subsections of Event
Diversity Collection
Collection Event Series
If you need a hierarchical order of your CollectionEvents or want to organize several CollectionEvents, for example, to document expeditions, you can achieve this with a CollectionEventSeries.
For a better differentiation between
events and CollectionEventSeries, there is blue text in the hierarchy as
well as the editing part, and a different icon
. A CollectionEventSeries can
contain other CollectionEventSeries and CollectionEvents. Information
about the geographic locality, properties of the collection site, date
of collecting etc., is stored in the CollectionEvent. To
show or hide the CollectionEventSeries, you have two options. In the
panel on the left of the tree the
button will show the superior EventSeries of the current CollectionEvent
as shown below.

The button will show the entire
hierarchy of the EventSeries as shown below.
To edit the data of an EventSeries, select it in the tree to display the
detail fields as shown below.
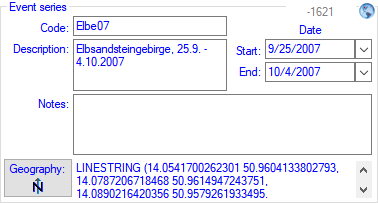
New Event Series
To insert a new CollectionEventSeries click on the
button. If there are no CollectionEventSeries so far, the
CollectionEvent will be placed within the new CollectionEventSeries. If
there are CollectionEventSeries present, the new CollectionEventSeries
will be placed below the selected CollectionEventSeries. To assign a
CollectionEvent to an existing CollectionEventSeries already available
in the database, click on the  button.
To move an item within the hierarchy, just drag it with the mouse to
whatever position it should be placed in. Keep in mind that specimens
can only be placed in CollectionEvents and CollectionEvents only in
CollectionEventSeries.
Removing EventSeries
If you want to delete a CollectionEventSeries or a CollectionEvent,
remove all depending CollectionEventSeries, CollectionEvents
and specimens and click on the button. A specimen
can not be deleted here.
If you want to remove a CollectionEvent from the
current CollectionEventSeries, click on the  button.
Moving into Event Series
 If you want to transfer the data selected in the query results into a
CollectionEventSeries, choose Data -
Transfer - to event series… from
the menu. If only a part of the items in the query results is selected,
you will be asked whether all data in the list should be transferred. To
transfer only the selected data, click NO. To transfer the entire list, click YES.
Note: Only samples that are already part of a collection event can be transferred.
Items without a collection event will not be included.
If you want to transfer the data selected in the query results into a
CollectionEventSeries, choose Data -
Transfer - to event series… from
the menu. If only a part of the items in the query results is selected,
you will be asked whether all data in the list should be transferred. To
transfer only the selected data, click NO. To transfer the entire list, click YES.
Note: Only samples that are already part of a collection event can be transferred.
Items without a collection event will not be included.
Images
To display the images, choose  Series images in the header menu. To add images to a CollectionEventSeries, click the
  button. To remove an image, use the delete button. With the button
  you can switch to a new Chromium-based browser for the display of
images. The presence of images in an event series is indicated by a
yellow background on the lower of the buttons in the upper right
corner. These buttons may be used as a shortcut to display the
images
you can switch to a new Chromium-based browser for the display of
images. The presence of images in an event series is indicated by a
yellow background on the lower of the buttons in the upper right
corner. These buttons may be used as a shortcut to display the
images  .
.
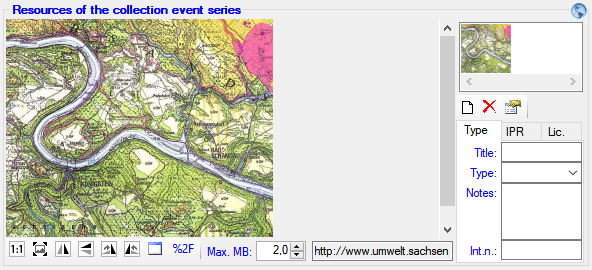
To zoom a sector of the image, simply move the mouse over the image. A
red square will indicate the zoomed area. To set the size of the image
to the original resolution, click on the  button. To adapt the size of the image to the available space in the
form, click on the
button. To adapt the size of the image to the available space in the
form, click on the  button. To change the
orientation of the image use the appropriate buttons (
button. To change the
orientation of the image use the appropriate buttons (
 flip horizontally,
 flip vertically,
 rotate right,
 rotate left). To view the image in a
separate form, click on the button. If the image
should not be published, e.g., on the internet, enter any reason in the
Withhold reason field. Besides images, you can also store other
media.
rotate left). To view the image in a
separate form, click on the button. If the image
should not be published, e.g., on the internet, enter any reason in the
Withhold reason field. Besides images, you can also store other
media.
Descriptors
To add descriptors to an event series, you must first add descriptor types. Choose Administration - Enumerations - Event series -  Desprictor from the menu, or
click the button in the descriptor section. A window will open where you can manage the available descriptor types. Use the resp. buttons to add or remove a descriptor to the event series.
Desprictor from the menu, or
click the button in the descriptor section. A window will open where you can manage the available descriptor types. Use the resp. buttons to add or remove a descriptor to the event series.
Hierarchy
 If you want to change to another specimen listed in the
CollectionEventSeries, select it in the hierarchy and click on
the button.
If you want to change to another specimen listed in the
CollectionEventSeries, select it in the hierarchy and click on
the button.
The current specimen, together with the event and all superior
CollectionEventSeries will be highlighted.
Geography
The
CollectionEventSeries can contain a geographical object (using
WGS84) such as a point, a line, an area, etc. To edit or
show the geographical object related to the CollectionEventSeries, either
click on the Geography button in the details next to the notes
field select the  Map in the header to
show the maps and use the GIS editor .
Map in the header to
show the maps and use the GIS editor .
Storage
The data of the CollectionEventSeries is stored in the table
CollectionEventSeries.
Diversity Collection
Event Images
The specimens stored in a collection are gathered during a
CollectionEvent. To insert an
image related to a CollectionEvent, select the event image
 in the header menu to display the images of
the collection event. In case the event images are not displayed, a
yellow (image(s) present) resp. gray (no image) backgroud of the tiny
buttons at the upper right corner indicates the presence of images
.
in the header menu to display the images of
the collection event. In case the event images are not displayed, a
yellow (image(s) present) resp. gray (no image) backgroud of the tiny
buttons at the upper right corner indicates the presence of images
.
In the list (see below) click on the new button. If you
want to delete an image, click on the button.
For more details see the section Images.
With the button
you can change to a new chromium
based browser for the display of images.
If for any reason an image should not be published i.e. shown on a
website, enter the reason in the field  Withholding reason. Only images where this field is empty will be
shown e.g. on websites. The EXIF data are extracted from the image
during the import, e.g. via
DiversityMobile.
Withholding reason. Only images where this field is empty will be
shown e.g. on websites. The EXIF data are extracted from the image
during the import, e.g. via
DiversityMobile.
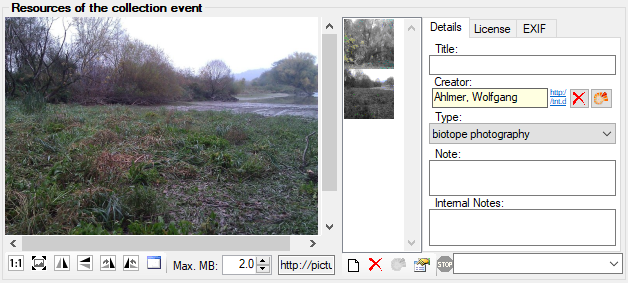
Data is stored in the table
CollectionEventImage .
Diversity Collection
Localisation
Geography
As additional information to the description of the locality you can use
several localisation systems, e.g. georeferencing. These entries are
marked with an icon in the tree as shown
below.
To add a new entry choose the localisation system from the drop-down
list as shown below. Only items which are not already set for a
CollectionEvent will be shown. The items visible in the drop-down list
can be customized.
If a localisation should be removed, select it from the list and click
on the button.
GIS editor
To define an area for the locality you can use the GIS
editor. For further details please see the help sections
for the corresponding pages.
Coordinates (WGS84)
If you use geo-coordinates as georeferencing system (coordinates WGS84),
a button  will appear which will provide you
with the possibility to set or correct the coordinates via Google Maps.
Just click on the button and a window will
open with a map provided by Google Maps as shown below. If there are
already coordinates provided by a different localisation e.g. by the
DiversityGazetteer, these will be taken as a starting position. Thus,
you may use an entry for a named area (DiversityGazetteer) as an
approximate localisation and use additional coordinates for a more
accurate localisation.
will appear which will provide you
with the possibility to set or correct the coordinates via Google Maps.
Just click on the button and a window will
open with a map provided by Google Maps as shown below. If there are
already coordinates provided by a different localisation e.g. by the
DiversityGazetteer, these will be taken as a starting position. Thus,
you may use an entry for a named area (DiversityGazetteer) as an
approximate localisation and use additional coordinates for a more
accurate localisation.
If you start with existing geographic coordinates (WGS84) in your data,
the system will use these as starting point. You can zoom the map, drag
it to another position and change from map to satellite mode. The actual
position is symbolized by the symbol in the
middle of the map. The current coordinates are shown in the field at the
bottom of the map. To include these coordinates in your data simply
click OK.
With the Set start coordinates button you can set the coordinates which GoogleMaps should use as a starting
position.
Please keep in mind that Google Maps coordinates are based on WGS84.
If there are no entries for the altitude and the named area, this data
will be retrieved from the webservice
ws.geonames.org and entered into the database.
The source will be documented in the Notes field. Subsequent changes
in the coordinates using the GoogleMaps function will update the
altitude and named area entries provided they are derived from a
webservice (ws.geonames.org) as documented in the Notes field.
Please keep in mind that the place names provided by ws.geonames.org
may differ from those depicted in GoogleMaps.
To enter the localisations listed above simply enter the Coordinates
WGS84. If an appropriate webservice is available (e.g.
geonames) the Altitude and Named
area will be added automatically.
Named areas - DiversityGazetter
The localisation system DiversityGazetteer is linked to the module
DiversityGazetteer within the DiversityWorkbench and providing
information on geographical names as shown below. The module
DiversityGazetteer may contain several independent lists of geographical
names, e.g. political and biogeographical regions. You therefore may add
up to 5 links to the module DiversityGazetteer.
TK25 (MTB)
The source data for TK maps are stored in the module
DiversityGazetteer. You need a access to a database of this module containing these data. If you choose MTB or TK25, the button will open a window where you can set the TK25 as well as the quadrant (see image below). Choose the quadrant depending on your preferred resolution. The thick line shows the current quadrant, the thin line the entire TK25.
The needle in the center is placed at your current position. If you
click on it, a message box will display the TK25 information as shown
below.
If you click [OK], the TK25 values together with the coordinates
of the center of the selected quadrant will be entered into the
database.
Conversion of values
The values for any localisation system are stored in two text fields.
You can enter your values as simple text. This may, however, prevent any
calculations with said values. Thus, you should preferably enter your
values according to the measurement units available. Whatever obsolete
measurement units like feet or Fahrenheit may exist, within the
DiversityWorkbench measurement data is stored in units according to the
Système International d'Unités (SI).
For those who still need to use these obsolete units DiversityCollection
provides a possibility to convert them into their modern counterparts.
To enter a numeric value choose the unit you prefer from the list. The
form will change as shown below.

You can then edit the values and click on the  button to incorporate the changed values into your data. The system will
calculate the corresponding value for storage in the database together
with the default accuracy. You may correct this accuracy if you have
more exact values. To indicate that the shown values are calculated from
the values in the database the fields have a green background. When you
save the data DiversityCollection will store geographic coordinates and
the average altitude, if available, in separate fields.
button to incorporate the changed values into your data. The system will
calculate the corresponding value for storage in the database together
with the default accuracy. You may correct this accuracy if you have
more exact values. To indicate that the shown values are calculated from
the values in the database the fields have a green background. When you
save the data DiversityCollection will store geographic coordinates and
the average altitude, if available, in separate fields.
The altitude, the exposition or the slope may be entered as one value or
as a range of two values. If you use the conversion function and have
only one value, make sure that the second field is empty.
 Available units: meter and feet.
 Available units: Orientation (N, NE, ... ) and
degree rel. to North.
Available units: Orientation (N, NE, ... ) and
degree rel. to North.
 Available units: degree and percent.
The accuracy and uncertainty respectively will be calculated as an
approximation in parts derived from Wieczorek, J. 2001
(MaNIS/HerpNet/ORNIS Georeferencing Guidelines. University of
California, Berkeley: Museum of Vertebrate Zoology) and in parts
according to Wieczorek, J., Q. Guo, and R. Hijmans 2004 (The
point-radius method for georeferencing locality descriptions and
calculating associated uncertainty. International Journal of
Geographical Information Science 18: 745-767). The unit of the accuracy
will always be the unit stored in the database according to the Système
International d'Unités (SI) and degrees for angles respectively.
The data for the geography is stored in the table
CollectionEventLocalisation.
Diversity Collection
Maps of samples in the database
If there are WGS84 coordinates available for your collection site, an
event series or single organisms, you can use GoogleMaps to display
these locations.
To use this service you need access to the internet. Select the
Map for display in the header area to
show the maps. Here you can display maps of
CollectionEventSeries,
CollectionEvent,  Organism
as well as Distribution
maps. To display the maps you can either use the
Organism
as well as Distribution
maps. To display the maps you can either use the
 browser, the web viewer, the
 GIS viewer or the GIS
editor. By default the map will show the location of the
CollectionEvent using the browser as shown below.
GIS viewer or the GIS
editor. By default the map will show the location of the
CollectionEvent using the browser as shown below.
The two options browser
and web viewer in principle provide the same
function, but rely on different controls. Due to incompatiblities
between controls and the google web API you may have to test both to
display a map.
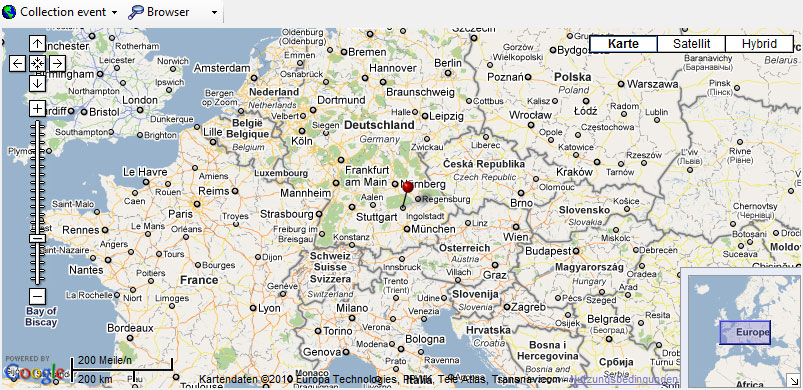
For the CollectionEventSeries, the
CollectionEvent or the
Organism you can use any geographical object like
points, lines, areas, etc. to describe the location. The browser will
always display these objects as points (see left image below) whereas
with the GIS editor you can see and edit the real
objects (see right image below).
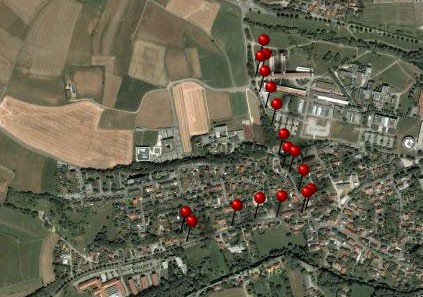
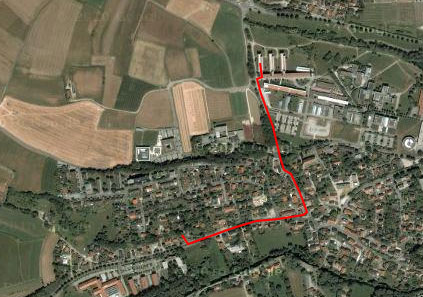
The data of the geographical objects is stored in the table
CollectionEventSeries
for the collection event series, the table
CollectionEventLocalisation
for the collection event and the table
IdentificationUnitGeoAnalysis
for the organisms.
Diversity Collection
Distribution maps
If WGS84 coordinates are available for your collection sites, you can
create distribution maps of your samples in the database. To use this
service you need access to the internet. Choose
Map in the header to show the maps. To
display distribution maps choose the
appropriate option from the first drop down list in the mapscontrol.
To add data sets to the distribution search for the data sets you want
to see in the map, mark them in the list (either use the button to mark all data sets, mark a
list/single data sets or check the
option for the distribution map) and click
the add button. To display the map click on the  button. The displayed localities in the map will
not change until you add new localities or click the button to start with a new distribution map. If
you want to set different icons for the positions of different series of
your samples, set the style of the icon (symbol, color, size etc.) in
the menu before you add them to the distribution list.
button. The displayed localities in the map will
not change until you add new localities or click the button to start with a new distribution map. If
you want to set different icons for the positions of different series of
your samples, set the style of the icon (symbol, color, size etc.) in
the menu before you add them to the distribution list.
To show a distribution map of all the specimens found in your query as
shown below, select the option
Distribution from the drop down menu. For the display in the map you
can choose either the Browser (see below) or
the GIS-Editor. In
the browser all objects will be shown with their center coordinates and
the number of specimens that can be depicted is limited, thus, it may be
necessary to restrict your query. With the GIS editor all objects will
be shown with their whole geography (e.g. an area will not be reduced to
its central coordinates) and there is no limit to the number.
Furthermore you can vary the symbols for different groups.
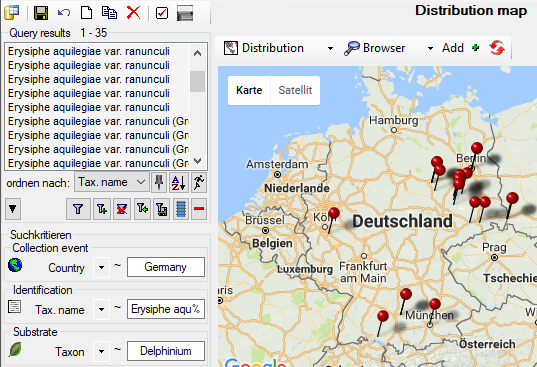
The upper distribution map is restricted
to coordinates of the collection event . If
you want to include coordinates from the organisms
, choose the distribution map including organisms
 . For the positions of the
organisms in this map, the ID of the organism ( = IdentificationUnitID,
528577 in example below) is shown as identifier and the last
identification ( = LastIdentificationCache) as display text (Ajuga
reptans L. in example below).
. For the positions of the
organisms in this map, the ID of the organism ( = IdentificationUnitID,
528577 in example below) is shown as identifier and the last
identification ( = LastIdentificationCache) as display text (Ajuga
reptans L. in example below).
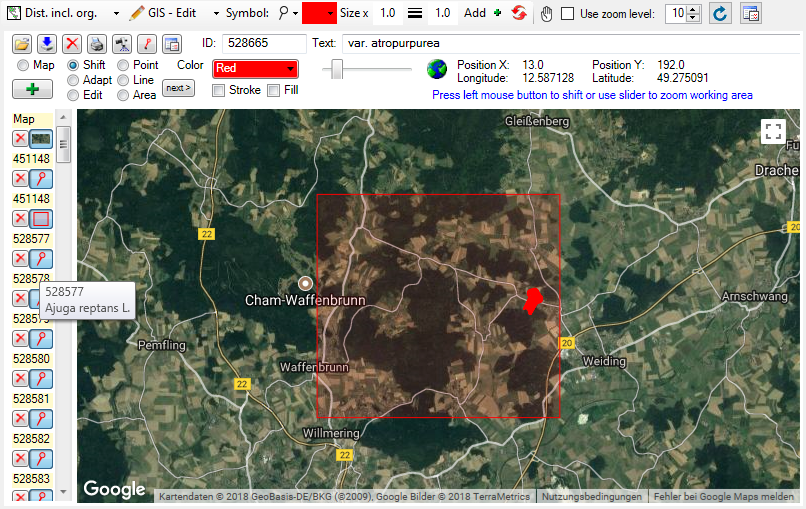
If you want to restrict the display to the organisms, click on
the button to open the window for custimizing
the display (see below) and deselect all localisation systems for the
collection event.
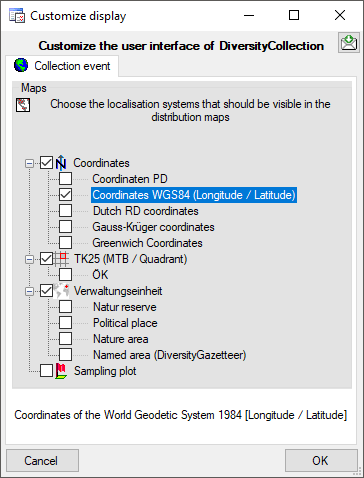
While in the GIS tool the objects are represented with their real
geography (see above), in the browser every object is reduced to a
single point. For an introduction see a short tutorial
.
Diversity Collection
Sampling Plots
If your samples are collected at constant sampling plots, you may use
the module DiversitySamplingPots to describe said SamplingPlots. For a
better differentiation between events and the SamplingPlots there is a
brown text in the hierarchy as well as a different icon
 . A SamplingPlot can contain other
SamplingPlots and CollectionEvents. Information about the geographic
locality and properties of the collection site can be stored in the
SamplingPlot, while the collecting date must be stored in the
CollectionEvent. To show or hide the SamplingPlots you have
two options. In the panel on the left of the tree the button will show the superior SamplingPlots
of the current CollectionEvent as shown below.
. A SamplingPlot can contain other
SamplingPlots and CollectionEvents. Information about the geographic
locality and properties of the collection site can be stored in the
SamplingPlot, while the collecting date must be stored in the
CollectionEvent. To show or hide the SamplingPlots you have
two options. In the panel on the left of the tree the button will show the superior SamplingPlots
of the current CollectionEvent as shown below.
The  button will show the entire hierarchy of
the SamplingPlots as shown below.
button will show the entire hierarchy of
the SamplingPlots as shown below.
If you select a SamplingPlot in the hierarchy, two buttons will appear
in the bar to the left of the tree. With the  button will show the entire hierarchy of
the SamplingPlots as shown below.> button
you can retrieve a taxon list for the SamplingPlot.
With the button you can retrieve a summary
of the information on a SamplingPlot (see image below).
button will show the entire hierarchy of
the SamplingPlots as shown below.> button
you can retrieve a taxon list for the SamplingPlot.
With the button you can retrieve a summary
of the information on a SamplingPlot (see image below).
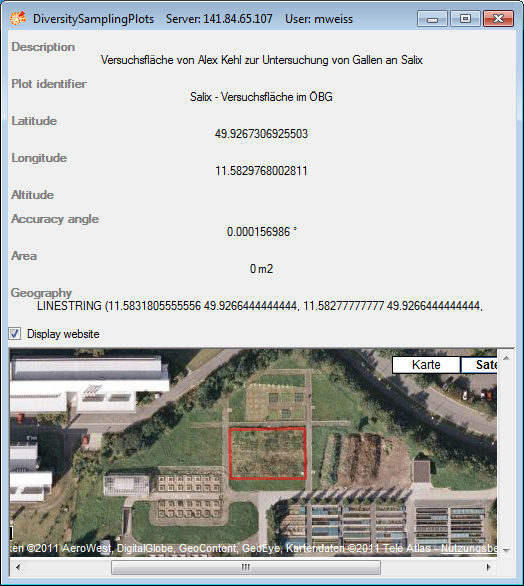
To edit the data of a SamplingPlot please use the module
DiversitySamplingPlots.
Transfer of selected data
To transfer all resp. the selected data into a specific sampling plot, choose
from the menu. Several upcoming dialogs will guide you through the transfer.
The link to the module DiversitySamplingPlots is stored in the table
CollectionEventLocalisation.
Diversity Collection
Habitats and properties of the collection site
For the description of the habitat select the CollectionEvent
or an existing collection site property
 . The description is entered in the field
Habitat (see below).
. The description is entered in the field
Habitat (see below).
To enter a new property of the collection site select the
CollectionEvent or an existing collection site
property . Then choose the type of the
property you wish to enter from the drop-down menu as shown below. Only
items which are not already set for a CollectionEvent will appear in the
list. You can customize the selection of visible items.
The list is dependent on the availability of terminologies for site
descriptions. Details for the property can be entered if you choose the
item in the hierarchy. The person responsible for the entry as well as
notes can be entered in the corresponding fields as shown below.
To delete entries use the button. You can enter a
value by either typing the name of the collection site property or by
selection from the module DiversityScientificTerms. To search for
properties from this module click on
the button. The current user’s name
will be inserted as the responsible user. You may change this by either
typing or through selection from the module DiversityAgents.
As an alternative to the DWB button, you
may select the property via a chart with a click on the
 button. A window as shown below will open. To
select an item from the chart click no the entry you want to select and
close the window with a click on the OK button.
button. A window as shown below will open. To
select an item from the chart click no the entry you want to select and
close the window with a click on the OK button.
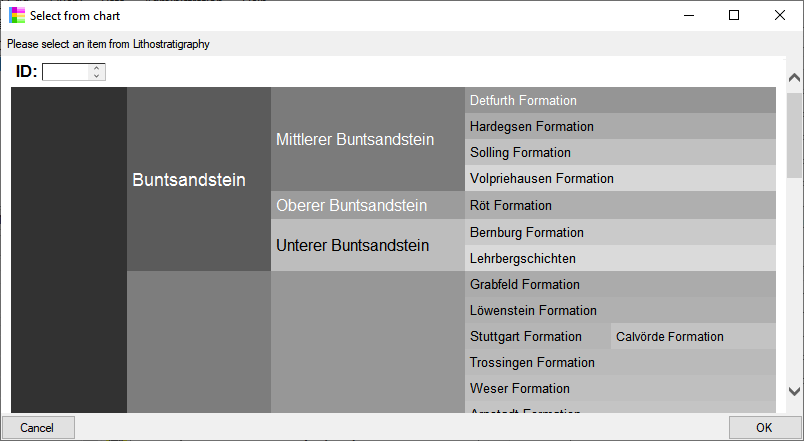
The data concerning the habitats is stored in the table
CollectionEventProperty.
Administration of properties (resp. terminologies)
To administrate the available properties of collection sites, choose
Administration - Site properties…
from the menu. A window as shown below will open, where you can
delete existing site properties and
add new site properties.
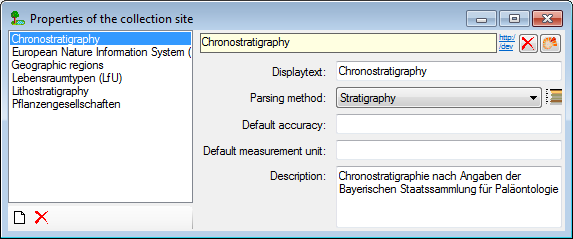
To add new properties, click on the button, select
the new entry in the list and choose the appropriate parsing method.
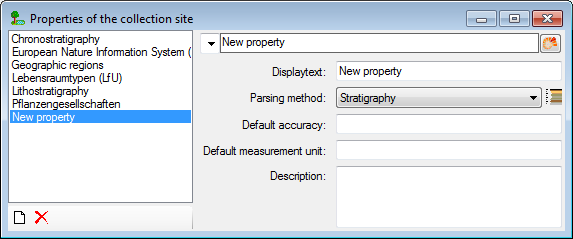
Properties should be linked to the module DiversityScientificTerms.
To link the property to the module, click on
the button. A window as shown below
will open, where you can search for the terminology provided by the
module. Please keep in mind, that the ID of the terminology will be used
for the new entry and that this ID must be unique. Turn to your
administrator if any difficulties occur.
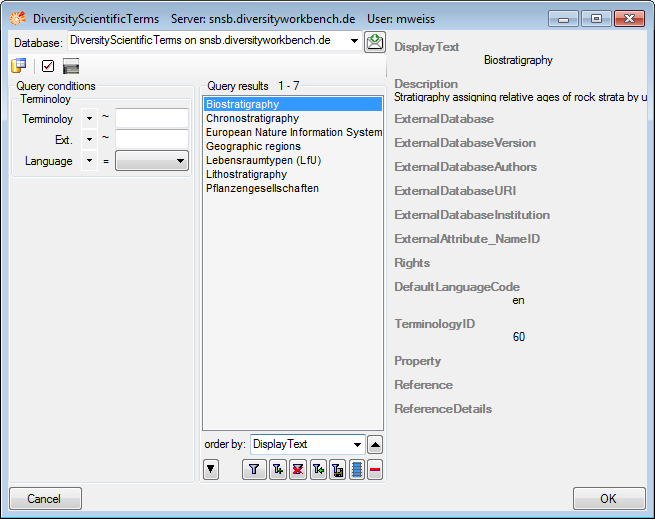
After choosing the terminology from DiversityScientificTerms, the
new property will be displayed as shown below..
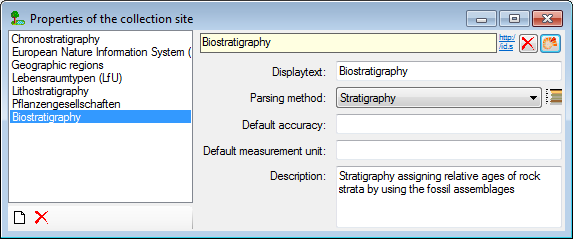
Diversity Collection
Specimens
Main sectors
The image below gives you an overview of the main sectors related to the collectiom specimen.
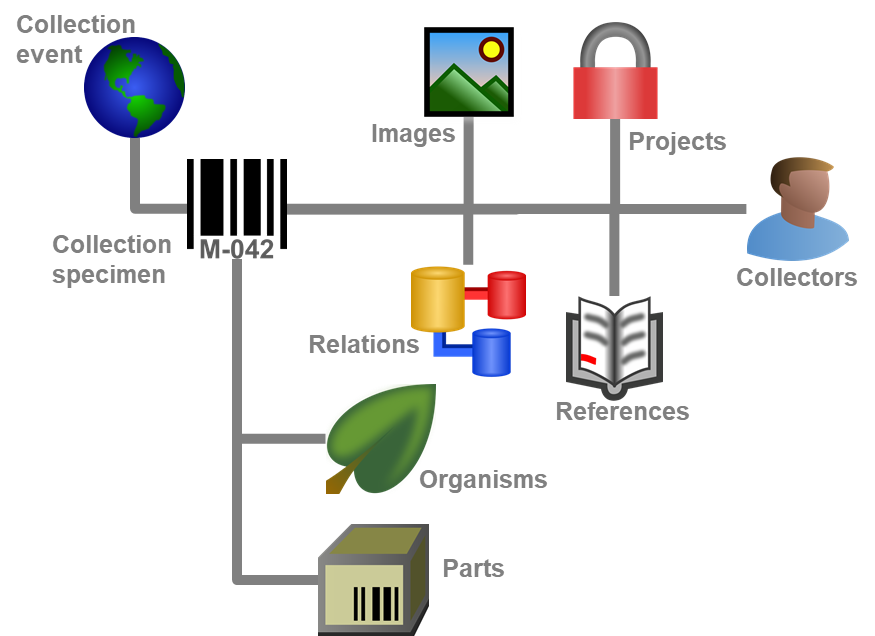
Specimens are the entities stored in a collection. For handling the data
use the appropriate buttons (new specimen , copy
, delete). See the
Data section for further details. Directly attached to the
specimen is the data about accession,
label, exsiccatae, notes,
reference and the
availability. A specimen may be composed of
several units. Any problems concerning the
specimen should be entered into the problems field.
The header of the main window shows some important parameters for the
selected specimen. On the left side the accession number is shown.
In the center you find the last identification of
the main IdentificationUnit according to the
display order. The [http:/] link shows
the public address of the selected item. Click on it to see the public
available values. The next field shows the internal IDs (field
CollectionSpecimenID in table
CollectionSpecimen and
CollectionEventID in table
CollectionEvent) and the
Versions for the specimen and the CollectionEvent. For details about
the version of a data set see the Version topic.
The availability of a specimen can be changed
by entering an appropriate reason in the field Withholding reason.

If the specimen is a type, the header will show the type state and the
identification connected with the type (see below).

To inspect the history of a specimen click on the button. For further details see the
History section.
Top area
In the header menu you can determine what is shown in the upper part of
the window. Choose on of the options:  will show
the printing area,
will show
the printing area,  images for the
specimen, the images for the collection
event and the images of the collection event
series. will show the maps. To hide the
upper part, select Hide.
images for the
specimen, the images for the collection
event and the images of the collection event
series. will show the maps. To hide the
upper part, select Hide.
The tiny buttons in the upper right corner provide a shortcut to the
image displays and indicate the existence of images by a yellow
background .
The data are stored in the table
CollectionSpecimen .
Subsections of Specimen
Diversity Collection
Data handling
The controls for handling data sets in the database are located in the
left upper part of the window as shown in the image below. A
step-by-step introduction for the creation of new data sets is provided
in the Tutorial.
- To SAVE the
changes in a data set click on the save button. If you
select another data set from the list of results, the current changes
will be saved automatically.
- To UNDO the changes in a data set, click on
the undo button. This will recover the original data
unless the changes have been saved or changes were done in certain
tables or hierarchies were the data must be stored to display the
hierarchy.
- To create a NEW entry in the database click
on the button. This will create a new record of a
specimen and show it in the list of results.
- To COPY the data of a specimen record choose
it from the list and click on the button. For
further details, see the chapter Copy specimen.
- - To DELETE a data set you must have the
proper rights (e.g. be a member of the group Administator). Select the
dataset you want to delete it in the list and click on the delete button.
To delete all selected specimen choose Data -
Remove specimen... from the menu. A window as shown below will open
where you can choose if the data from the log
and the collection events should be included in
the removal.
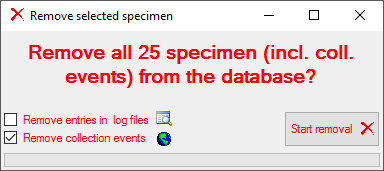
Diversity Collection
Copy specimen
For an introduction see a short tutorial
.
To copy specimen click on the button. A window will
open where you can choose several options for your copies.
In the first tab choose in which way the CollectionEvent - if
present - for the new data sets should be created (see image below). In
the first option the new specimen will be located in the same collection
event as the original dataset. In the second option a new collection
event copied from the original will be created while in the last option
the data in the collection event will be ignored altogether.
In the Accession number tab you can search for or enter the
accession number you wish to use for your new data set (see below).
In the Projects tab you can add additional projects for you new
datasets (see below).
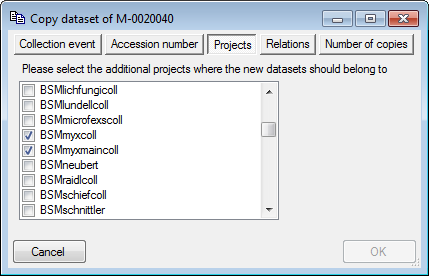
In the Relations tab you can add relations between the original
dataset and the copy in either direction (see below).
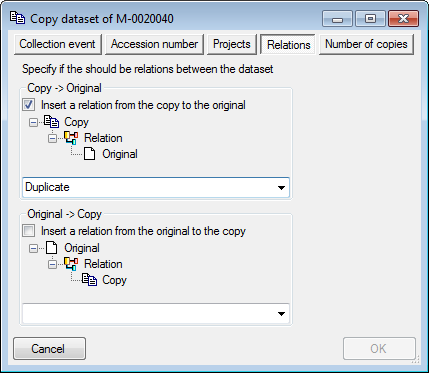
In the Include... tab you can choose the ranges of data that should
be included in the copy (see below). Click on the All or  None buttons to
select all resp. none of the tables.
None buttons to
select all resp. none of the tables.
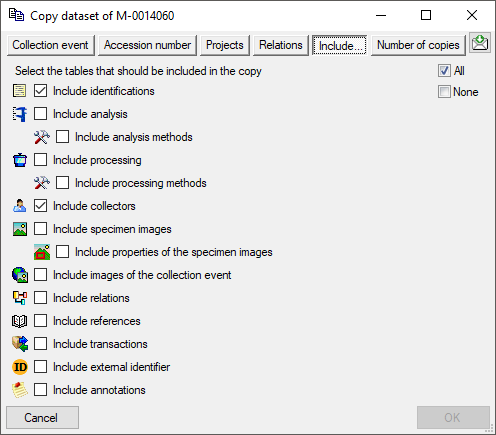
In the Number of copies tab you can specify the number of copies. If
you checked Create an accession number for the new data set, the
program will list all accession numbers which will be created (see
below). After you changed the number of copies, click on the button to refresh the list.
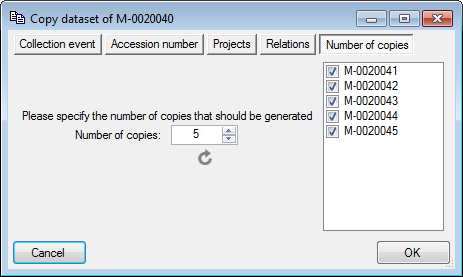
If you do not wish to create new accession numbers for the copies the
list will not be shown (see below).
Copy event
If only the event data should be copied and a selected specimen should
be transferred into the new event you can choose the last option (see
below). This option is only available for events containing several
specimen.
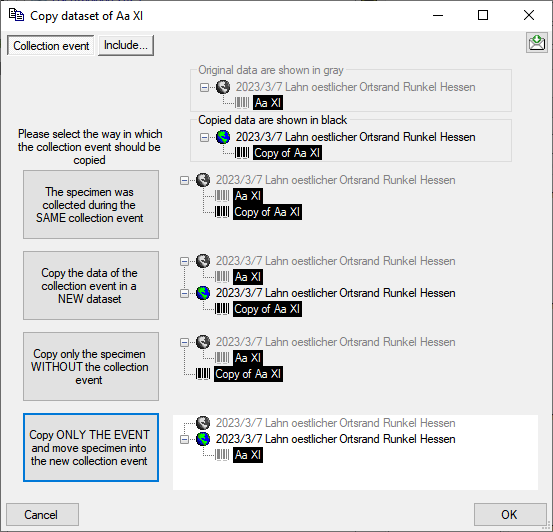
Diversity Collection
Tree for the specimen
The upper tree in the window provides an overview for all the data
linked with the specimen. With the buttons in the left panel you may
hide or show certain nodes in the tree. If for example you do not wish
to see the collectors, simply click on the  button
and they will be hidden in the tree. The button will change to a grey
version
button
and they will be hidden in the tree. The button will change to a grey
version  and the background will turn
yellow to show that there is hidden data of the collectors.
and the background will turn
yellow to show that there is hidden data of the collectors.
If the CollectionEvent is part of a CollectionEventSeries, a drop-down
button will appear where you may select between 3 states:
- = show the parent EventSeries
-
= show the entire hierarchy of the EventSeries
- = hide the EventSeries
- = hide the EventSeries
If the CollectionEvent is linked to a SamplingPlot, a drop-down button
will appear where you may select between 3 states:
- = show the parent SamplingPlots
- = show the entire hierarchy of the SamplingPlots
 = hide the SamplingPlots
- = hide the SamplingPlots
If both options are available, you may choose between the
CollectionEventSeries or the SamplingPlot hierarchy. If the entire
hierarchy for the EventSeries or the SamplingPlots is displayed, the
items not included in the current data set will be displayed with gray
icons, e.g.  . To change to one of these use the button. For the
Events, the EventSeries, the Plots and the Specimen the button will appear which will give you access to a taxon list
of the selected item.
. To change to one of these use the button. For the
Events, the EventSeries, the Plots and the Specimen the button will appear which will give you access to a taxon list
of the selected item.

The panel on the right side of the tree is used for editing the data,
for example the
button will insert a new collector. For further details see the special
sections. For data with [Read
only] access these panels are
disabled except the button for adding annotations
 .
.
Diversity Collection
Display order
Tutorial:
The display order defines the sequence in which the units within this
specimen will appear on e.g. a label. The first unit will
be printed in the header of the label, others are included in the text
below. You can change the display order by using
the 
 buttons. If a unit
should not appear on the label, transfer it to the hide list using
the
buttons. If a unit
should not appear on the label, transfer it to the hide list using
the  button. The
  button returns it to the list to be shown on a label. The first unit can
not be transferred to the hide list.
button returns it to the list to be shown on a label. The first unit can
not be transferred to the hide list.
The upper section shows the display orders of the units within the whole
specimen. The lower section shows the display orders in a specimen part.
If you print a label without reference to a part, the display order for
the entire specimen as in the upper section will be used. This part is
also accessible if you click on the button in the
right panel of the upper tree, which will appear if you e.g. select the
specimen.
If you print a label with reference to a part, the display order for the
part as in the lower section will be used. This area will be shown when
you select a specimen part in the lower tree. In addition to the display
order you can specify whether an organism is present in a selected part
of a specimen. With the
button you can
transfer all organisms into the part.
To change the sequence of the parts according to e.g. the name instead
of setting all entries one by one, you may choose among the options
shown in the image below (Name, Identifier, ID).
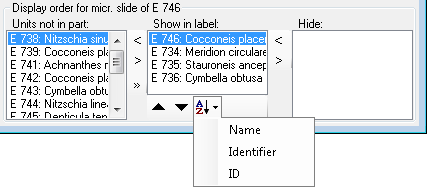
Diversity Collection
Accession
The accession of a specimen in a collection is documented with its
accession number and the date of the accession if available.
If the specimen was received from another collection, this may be
documented with the name of the depositor and the number in the original
collection (Dep.Nr).
If the current project (= as selected in the query list) contains a
duplicate of the accession number, a button will
appear. This gives you the opportunity to switch to the specimen with
the duplicate accession number.

If a new specimen is entered you can use the  button to search for the next free accession number. A window will open
as shown below, where you can begin the search. The search will start
with the number you provide as a starting point.
button to search for the next free accession number. A window will open
as shown below, where you can begin the search. The search will start
with the number you provide as a starting point.
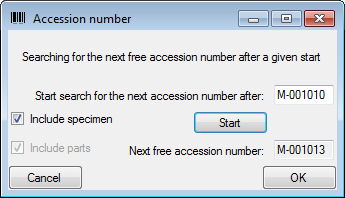
The system will try to find the next free number based on the accession
numbers available in the database. As accession numbers can be assigned
to a specimen as well as a part of a specimen, you have the option to
include accession numbers in both places in the query. Click OK to use
the recommended number for the specimen.
Data concerning the accession and deposition are stored in the table
CollectionSpecimen.
Diversity Collection
Specimen image
To see the specimen images select the specimen image
in the header menu. Each specimen may be
documented with several images. The images are stored as their path,
either locally or provided by a server. To enter a new image click on
the button. For more details see the section
Images.
To delete an image select it from the list and click on the delete button (see below).
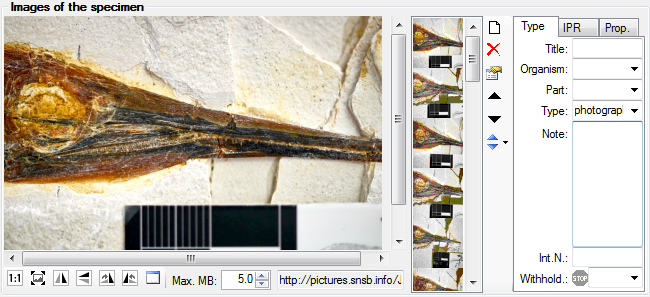
To change the sequence of the images, use the
resp. buttons to change the position of the
selected image. To adapt the sequence of the whole list, you can select
one of the options offered when you click on the
 button: Ordering ascending resp. descending
by the name (= URI) or the creation date of the images. For a short
introduction see the tutorial
.
button: Ordering ascending resp. descending
by the name (= URI) or the creation date of the images. For a short
introduction see the tutorial
.
With the button you can
change to a new chromium based browser for the display of images.
To change the image sequence for a whole project, use the functionality
within maintenance maintenance.
To document the relation of an image to an organism or a part of
the specimen choose the corresponding entries from the drop-down lists
Organisms: and/or Part:.
To restrict the displayed images to either images which are related to a
certain part or a certain organism within the specimen, choose e.g. the
organism in the tree. If the selected organism is related to any image
the  button
(see below) will change to .
button
(see below) will change to .

Click on the button to restrict the images
displayed in the list to those, which are related to e.g. the selected
organism. The button will receive a red background
to remind you of
the restriction. Next to the image list a button
will appear which enables you to show all
images again.
The data is stored in the table
CollectionSpecimenImage.
Diversity Collection
Projects
|
Setting of projects |
Effect on specimen within Projects |
|
Full access to all projects |
User can edit data |
 |
Any project read only |
User can read data |
|
Any project locked |
No user can edit data |
 |
No access to project |
User cannot see data |
Every CollectionSpecimen may be assigned to any number of projects. To
assign a specimen to a project click on the button.
To add a project where you have no access to, use the button. To remove a specimen from a project
select the project from the list and click on the
button.
If there are projects, to which you have [no
access] to, these will be
listed in a separate list at the top as shown below.
Projects, to which you have Read only access will be listed
in a separate list at the top as shown below.
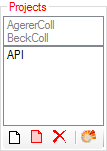
Data from Read only projects can be seen but not edited. Only Annotations
 can be added (see image below).
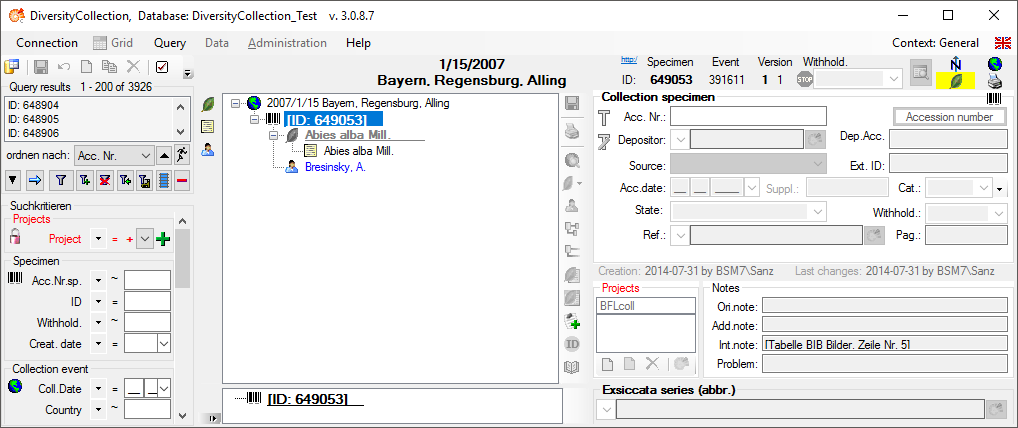
To transfer all selected specimen into an additional project choose
Data → Transfer →
To project... from the menu. A window
will open where you can select the project to which the specimen should
be added.
To remove all selected specimen from an additional project choose Data
→ Remove from project... from the menu. A
window will open where you can select the project from which the
specimen should be removed. The last project in which a specimen is
placed can not be removed.
The data are stored in the table
CollectionProject.
Details of the projects within the DiversityWorkbench are stored in the
database DiversityProjects. To access further information on a project
click on the DWB button. To edit details
in projects you require the application DiversityProjects.exe in
your application directory and access to the database DiversityProjects.
To synchronize the projects listed in DiversityProjects you may use the
synchronize function in the useradministration window as shown below. If
DiversityProjects is not available, you may create a new project by
clicking the project button. If DiversityProjects is
available, use the synchronize function
 .
.
To import new projects from the DiversityProjects, select
Administration - Projects from the
menu. A window as below will open where the available projects are
restricted to the type "Collection"
 . (Short introduction:
)
. (Short introduction:
)
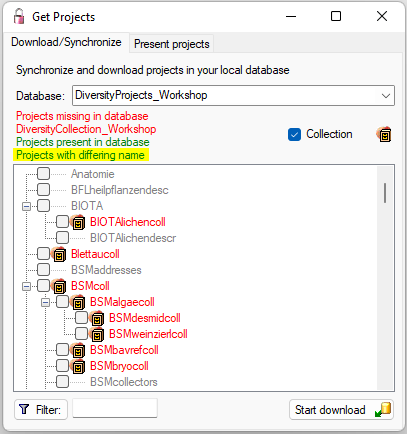
To select a project of a different type or missing type, deselect the
restriction (see below).
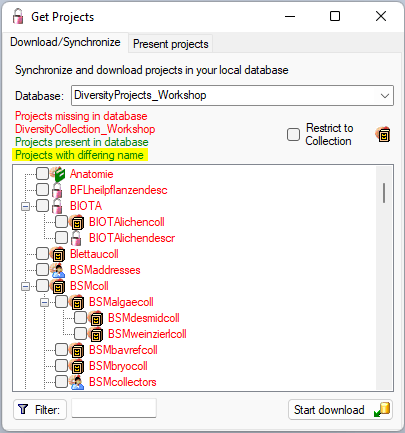
The present project list details about the projects available in
DiversityCollection.
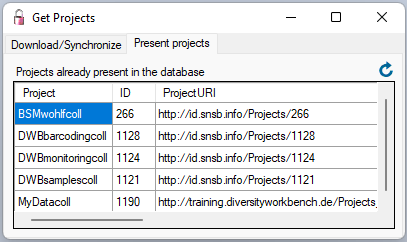
the diagram below shows all tables with direct relations to the project
tables. For more details see the sections Analysis,
Processing and Image
description.
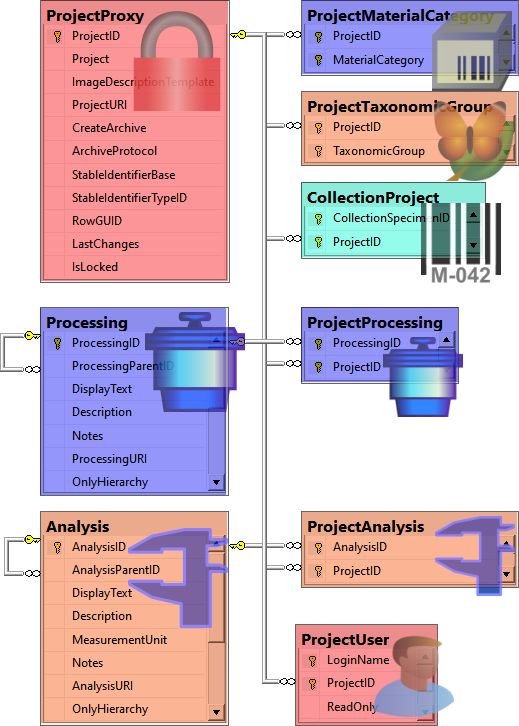
Diversity Collection
Notes and problems
To enter notes or problems connected with the specimen select it in the
hierarchy. The data form will open the corresponding fields. The
Original notes are the notes found on the label of the specimen,
made by the original collector or from a later revision. Additional
notes are those made by the editor of the specimen record, e. g.
doubtful identification or locality.
In the Problems area enter the description of a problem which
occurred during data editing. Typically these entries should be deleted
after help has been obtained. Do not enter scientific problems here. Use
Additional notes for such permanent problems!
The data is stored in the table
CollectionSpecimen.
For notes on data created by users with no permission for editing see
the chapter Annotation.
Diversity Collection
Organisms And Identifications
Main sectors
The image below gives you an overview of the main sectors related to the organisms.
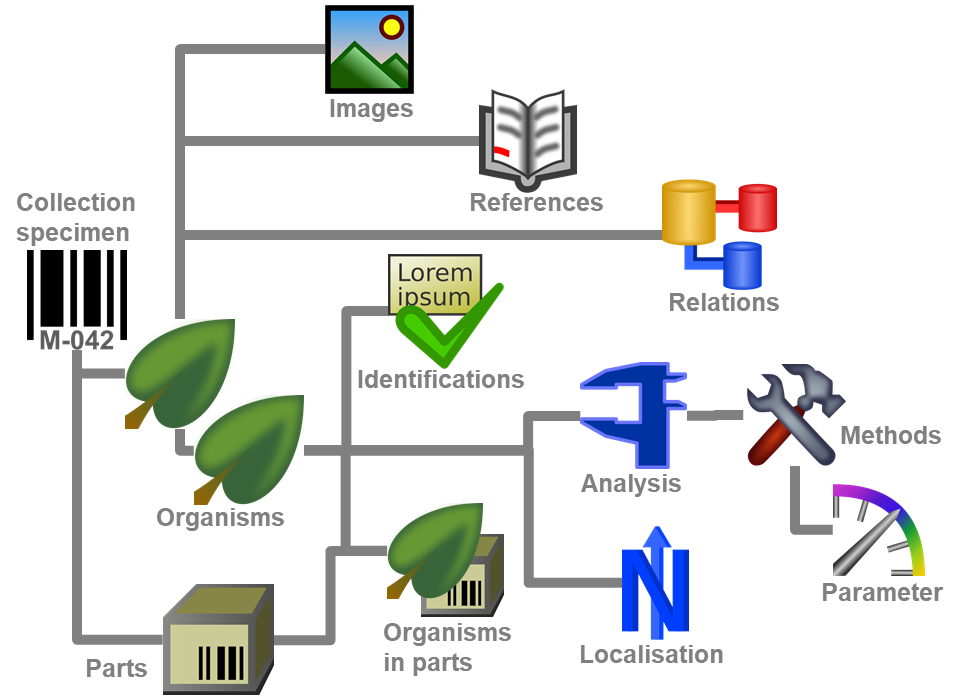
Each specimen can contain several organisms
and each organism may have been identified several
times as shown in the image below.
To see the list of organisms within a Specimen, CollectionEvent,
EventSeries or SamplingPlot use the taxon list
function.
Subsections of Organisms
Diversity Collection
Organisms
(= Identification Units)
The items or organisms in one CollectionSpecimen are regarded as
IdentificationUnits. One specimen can contain several
IdentificationUnits e.g. an insect (1) feeding on a fungus (2) growing
as a parasite on a plant (3). To add a new organism use the drop-down
menu as shown below to select the taxonomic group to which the new
organism belongs to.
To specify the taxonomic groups that are shown in the drop-down menu
select Administration - Customize display ... from the
menu.
The organisms of the specimen are shown in the tree. To edit the
relations between the organisms simply drag and drop. In case of a
shortcut in the hierarchy you will be asked to select the start of the
hierarchy as described in the video:
.
The name of the organism under which the specimen is stored in the
collection is [underlined]. To
delete an organism select it in the tree and click on the delete button.
To enter details about one of the organisms like e.g. gender or life
stage, select it in the tree. The fields for the details of this
organism will be displayed in the right area of the window as shown
below.
If the Identification unit is e.g. not a complete organism you can enter
a description for this IdentificationUnit. Either type you description
or choose one of the predefined descriptions via combobox or hierarchy:
Use the combobox to select a description as found for the same taxonomic
group in the database or use the hierarchy-selector
to select a predefined description. An additional description can be
entered for an IdentificationUnit within part of a
CollectionSpecimen.
Taxonomic hierarchy - family and order
The entries for the family and the order of the taxon are either set
when linking to a taxonomic database or set manually when no link to a
taxonomic database exists.

If no link to a taxonomic database exists you may enter the family and
the order after clicking on the edit button. To transfer
these entries to other specimens with the same genus use the maintenance
functions as described under Maintenance - family andorder.
Parts of units
If a unit contains parts which have to be documented, you can do this by
setting the relation to the substrate to "Part of".
In the tree the background of a part will be grey as shown below for the
unit-tree und the tree depicting the storage of a sample. The name of
the part will correspond to the identifier set for this part. The icon
will correspond to the description of the part provided you choose one
of the preset options contained in the drop-down list. You may of course
enter any description for the unit. A unit that is part of another unit
can not get an identification. Identifications are restricted to the
main unit.
Parent-child relations
If a unit is a genetic child of a parent, choose "Child of" as
type of the relation. If there are 2 parents like mother and father that
you want to document, click on the  button next to
the relation type. A window will open where you can choose among the
organisms (= units) in your sample. The second parent will be indicated
with the symbol in the tree (see below).
button next to
the relation type. A window will open where you can choose among the
organisms (= units) in your sample. The second parent will be indicated
with the symbol in the tree (see below).
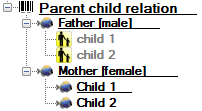
For details about exsiccatal series and
analysis see the related topics. You can sort your
IdentificationUnits e.g. for display on a label with the displayorder button. Each IdentificationUnit can have
several identifications.
With the template you can define  and
copy
and
copy  predefined values into the data (see
chapter Template).
predefined values into the data (see
chapter Template).
If there are images which are related to the
current organism, the button for the restriction of the images will be
enabled ( → ). Click on
it to restrict the images to this organism. The button will get a red
background to
remind you about the restriction and in the image list a button
will appear that enables you to show all
images.
Non biological units
Non biological units like  soil,
soil,
 rock or
  mineral do not have
biology related characters like family or sex. These are therefore not
displayed for these groups.
mineral do not have
biology related characters like family or sex. These are therefore not
displayed for these groups.
The data for the organisms and non biological units are stored in the
table IdentificationUnit.
Diversity Collection
Taxonomic Group
The organisms and corresponding objects stored in the database are
organized in taxonomic groups to facilitate the recognition in multi
organism samples and to enable a specific design for the
analysis where e.g. plants differ in recorded
measurements from mammals. The taxonomic groups are roughly orientated
on the taxonomy but are not meant to replace the
taxonomy for which there are other possibilities
for entry. The list of taxonomic groups visible for the creation of new
entries may be restricted as described in the chapter about the
customization.
To administrate the taxonomic groups, choose Administration -
Taxonomic groups... from the menu. A window as shown below will
open.
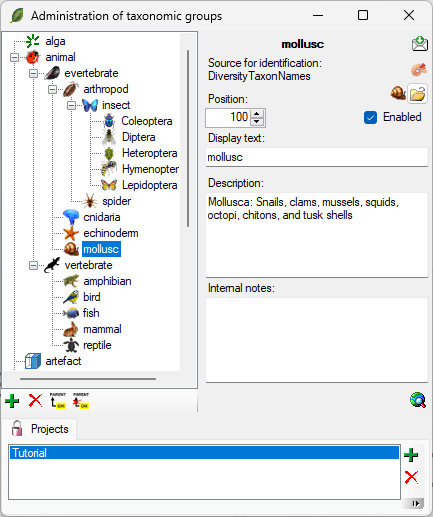
To add resp. remove a taxonomic group use the resp. the delete button. To set the superior taxonomic group use
the  button. With the open button you can set a symbol for the taxonomic
group. Please keep in mind, that this will be converted into a 16 x 16
size icon. In the lower part of the window, you can add and edit
translations for display texts, abbreviations etc. for all contexts
available.
button. With the open button you can set a symbol for the taxonomic
group. Please keep in mind, that this will be converted into a 16 x 16
size icon. In the lower part of the window, you can add and edit
translations for display texts, abbreviations etc. for all contexts
available.
If a taxonomic group has been disabled it will not appear in the lists for the user and will be displayed without an image in with grey text color in the tree (see below). After reenabling a group you have to reopen the form to see the icon for the group.
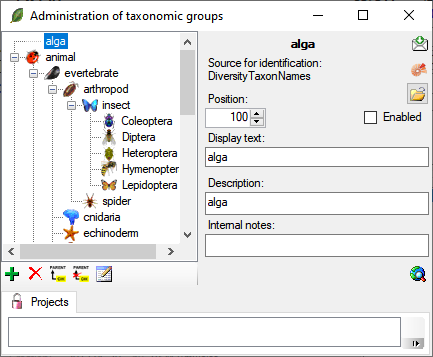
At the base of the window, the projects that are restricted to an entry
are listed (see
).
To administrate the projects that should restrict the available
taxonomic groups, choose Administration - Enumerations - Project -
Taxonomic group... from the menu. A window as shown below will open.
If a project is restricted, the client settings will be ignored (see
chapter Customize).
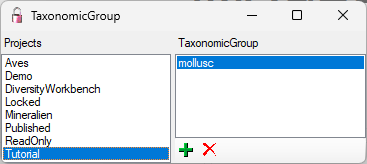
To add resp. remove a material category for a project use the resp. button.
The non-biological taxonomic groups like soil,
rock or mineral will for an
identification not be linked to DiversityTaxonNames but to
DiversityScientificTerms (see image below and the short tutorial
 ).
If you add a new taxonomic group anything outside the predefined groups
animal, alga, bacterium, bryophyte, fungus, gall, lichen, myxomycete,
plant or virus will be regarded as non-biological. The sources for
direct access using the buttons are linked to the
taxonomic groups (see Settings).
).
If you add a new taxonomic group anything outside the predefined groups
animal, alga, bacterium, bryophyte, fungus, gall, lichen, myxomycete,
plant or virus will be regarded as non-biological. The sources for
direct access using the buttons are linked to the
taxonomic groups (see Settings).
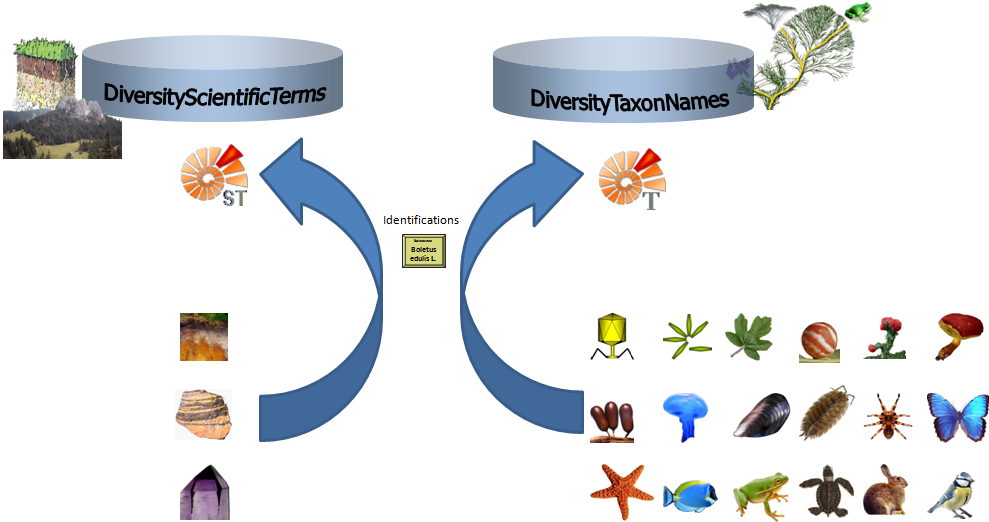
Diversity Collection
Retrieval Type
The ways the data about organisms and corresponding objects stored in
the database are retrieved are documented as retrieval type.
To administrate the retrieval types, choose Administration -
 Retrieval types... from the menu. A
window as shown below will open.
Retrieval types... from the menu. A
window as shown below will open.
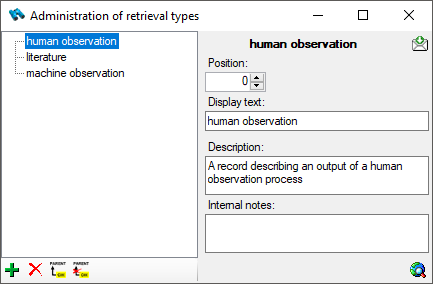
To add resp. remove a retrieval type use the resp. the delete button. To set the superior type use the button.
Diversity Collection
Analysis
The organisms in a specimen can be analysed by analysis types defined in
the database. In the tree the analysis entries are symbolized with an
 icon. Only the types of analysis that were
assigned to the group of the organism can be selected. An analysis
always refers to an organism and may also refer to a part of a specimen.
An analysis that refers to a part of a specimen will be shown in the
tree for the parts as shown in the examples below.
icon. Only the types of analysis that were
assigned to the group of the organism can be selected. An analysis
always refers to an organism and may also refer to a part of a specimen.
An analysis that refers to a part of a specimen will be shown in the
tree for the parts as shown in the examples below.
To show or hide the analysis items in the tree use the button in the left panel. This button has 3
states. In the default state the analysis
entries will be shown as above. If you click a
second time it will change to the hierarchy mode
 and the entries will appear as shown
in the tree below. The last state
and the entries will appear as shown
in the tree below. The last state  will hide
the entries.
will hide
the entries.
To insert a new analysis to an organism select the organism in the upper
tree. Then select the type of the analysis from the drop down list as
shown below.
To delete an analysis, select it in the tree and use the delete button in the panel on the left. To edit the
details of an analysis, select it in the tree and enter data into the
fields as shown below. To enter or inspect an URI given for a single
analysis, click on the button.
If an analysis refers to a part of the specimen, you can document this
by choosing the respective part from the list (see field Part
above). The analysis will then be shown in the tree for the parts of the
specimen as well. Alternatively you may directly choose the organism in
the part tree and create the analysis for this part of the organism in
the part tree. If you used any tools defined in the toolsection, you can include the usage of these tools.
In case the measurement unit of the analysis set to DNA (see below)
...
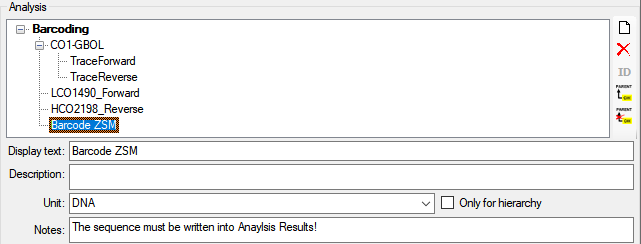
... the Result is edited as shown below.
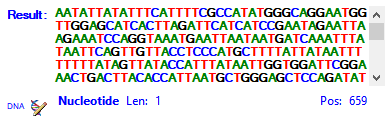
A click on the  button opens a separate window
(see below) with additional options for editing the sequence.
button opens a separate window
(see below) with additional options for editing the sequence.
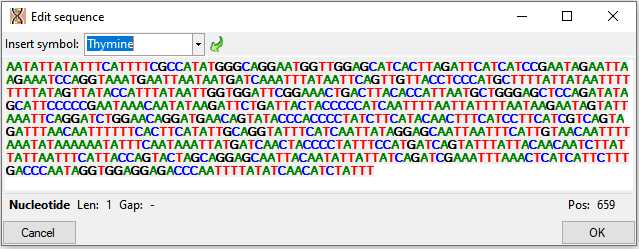
Administration
If you require further information about an analysis click on the button. A window for the analysis
administration will open. If you have the proper rights you can edit the
analysis types used in your collection as shown below. This window is
also accessible via the menu entry Administration - Analysis...
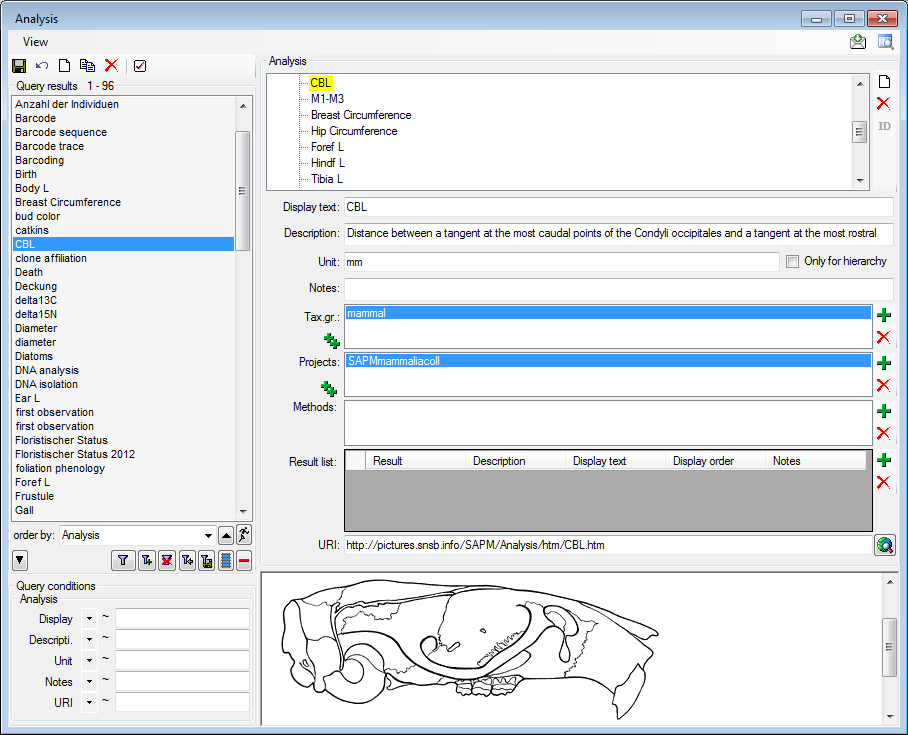
For the import and export of data it is sometimes necessary to know the
IDs of the analysis types. To see the IDs, click on the [
ID] button to display them as shown
in the image below.
The types of an analysis are restricted by the taxonomic group of
the organism or object to be analysed and from the projects. You may
edit the list of taxonomic groups resp. projects, which
can use a certain analysis, using the and the delete button. To add all used taxonomic groups resp.
projects, you can use the  buttons. For details
about handling data see the data section. If you add a
taxonomic group or a project to an analysis, all children of this
analysis will be available for these taxonomic groups resp. projects as
well (see image below). Thus, in the example above it is sufficient to
enter the taxonomic group and the project in the analysis Mammals to
have access to all analysis within this superior analysis as shown in
the tree. The different types of analysis are organized in a hierarchy.
To organize. Some of the entries may only serve for structuring purposes
(e.g. Mammals as shown above) and should not be used to document the
analysis of the specimen. To ensure this, check the checkbox [Only
hierarchy].
buttons. For details
about handling data see the data section. If you add a
taxonomic group or a project to an analysis, all children of this
analysis will be available for these taxonomic groups resp. projects as
well (see image below). Thus, in the example above it is sufficient to
enter the taxonomic group and the project in the analysis Mammals to
have access to all analysis within this superior analysis as shown in
the tree. The different types of analysis are organized in a hierarchy.
To organize. Some of the entries may only serve for structuring purposes
(e.g. Mammals as shown above) and should not be used to document the
analysis of the specimen. To ensure this, check the checkbox [Only
hierarchy].
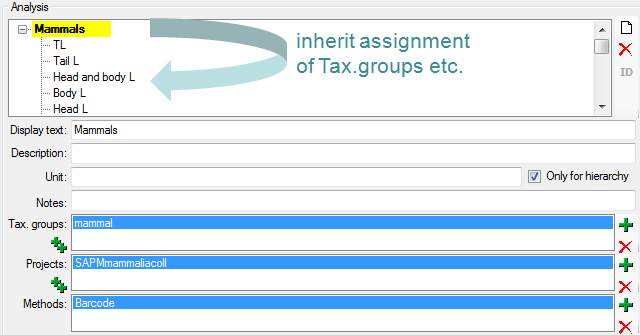
There are 3 states for result lists in the main form. (1) No result list
will be generated if a measurement unit is defined, for example if you
specify "mm" as the measurement unit. (2) If no measurement unit is
defined, the program will collect all values given so far and present
these values as a list. (3) Some types of analysis need categorized
values. Enter these values together with their description in the
Result list as shown below using the and
buttons respectively. To show values different
from the entries in the Result column change the entries in the
Display text column.
If you want to access or inspect an URI given for an analysis type,
click on the button. The URI related to the
analysis will then be displayed in the window below.
Methods
Besides of a plain text description of the analysis, you may insert
methods as defined in the chapter Methods. Use the and buttons to add or remove
methods from the list (see below). The added methods will be marked with
sequential number (see Mark.: ... ) to allow several methods of the
same type.
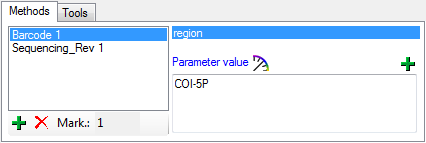
Every method may have several parameters  that
will automatically be available to take your values. If the definitions
of the parameters have been changed, you may add missing parameters with
the add button. A window as shown below will open where
you can select the missing parameters you want to add.
that
will automatically be available to take your values. If the definitions
of the parameters have been changed, you may add missing parameters with
the add button. A window as shown below will open where
you can select the missing parameters you want to add.
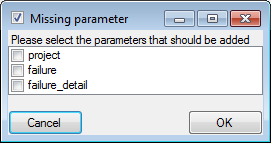
History
To view the history of a dataset, click on the
button. A window
with the history will open. For more details see the section
History.
Diversity Collection
Geography of organisms
The geographical position of organisms (using WGS84)
can be recorded along with the date, for example, to document migration patterns or the
distribution of an organism. In the tree, the geographical entries are
symbolised by an icon, as shown below.
To display the corresponding map, activate Maps and
click the button. To edit an existing
geographical entry, use the GIS editor. If
you are adding a new geographical position and existing entries are already shown on the map,
remove them from the map before inserting the new location.
Diversity Collection
Identification
Each organism or unit may have been identified several times. The
identifications are listed in the tree under the organism as shown in
the image below. To create a new identification choose the organism from
the tree and click on the  identification icon. The last
identification will always be taken as the valid one and set at the top
of the list. To insert an older identification at the base of the list
click on the
identification icon. The last
identification will always be taken as the valid one and set at the top
of the list. To insert an older identification at the base of the list
click on the  identification to base icon.
To hide / show the identifications in the tree click on the identification icon on the right panel next to the tree.
To enter a confirmation of an identification choose it in the tree and
then click on the  confirmation button. To move an
identification to the end or the start of the list use the
confirmation button. To move an
identification to the end or the start of the list use the  identification down or
 identification up button respectively. To delete an
identification select it in the tree and click the delete button. To enter details for an identification
choose it in the tree. You can then enter the details in the form
opening on the right side of the tree as shown below.
identification up button respectively. To delete an
identification select it in the tree and click the delete button. To enter details for an identification
choose it in the tree. You can then enter the details in the form
opening on the right side of the tree as shown below.
The taxonomic name of an organism can be selected from either the names
already available in DiversityCollection or from the module
DiversityTaxonNames. To choose from the local names type the
beginning of the name and click on the drop-down button
to get a list of available names. You can use
wildcards according to SQL.
To select a taxonomic name from an external database click on the module button. A
window will open where you can search for a
taxonomic name. For taxonomic names provided by the module
DiversityTaxonNames you can use a shortcut. Click on the pin button to set the source in the window that will
open. After the source is set, the pin and drop-down
box will change their colors as shown below to indicate that the
taxonomic names are not longer derived from the content in
DiversityCollection but from the selected DiversityTaxonNames database.
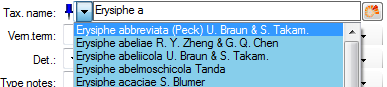
The links will be set separate for every taxonomic group and may be
changed at any time with a click on the pin button. To
release the link to the remote database, click on
the pin button and than select Cancel in the window
where you select the database. The pin will change to
gray and the data will again be derived from the local values in DiversityCollection.
For identifications linked to a DiversityTaxonNames database you may
activate the Show accepted names option. Accepted
names will then be shown with a green color while for synonyms the
accepted name will be displayed above the current name (see below).

In the database the data for the identification is stored in the table
Identification.
Subsections of Identification
Diversity Collection
Identification
Additional identifier
upcoming
Available in upcoming version
For biological objects you may add an additional person or group responsible for the identifiaction.
Click on the Add a new identifier button. The new entry will be shown in the tree.
Diversity Collection
Identification
Sources
Diversity Workbench
The source for names for biological taxa is the module DiversityTaxonNames
Webservices
As an alternative to DiversityTaxonNames you may use several Webservices
Catalogue of life
DiversityWorkbench provides the possibility to link your data to an
external webservice. The webservice provided by the  Catalogue of Life is possible through the
module DiversityTaxonNames. To establish a connection to this external
webservice click on the DWB button. A
window will open where you may choose this webservice (see below).
Catalogue of Life is possible through the
module DiversityTaxonNames. To establish a connection to this external
webservice click on the DWB button. A
window will open where you may choose this webservice (see below).
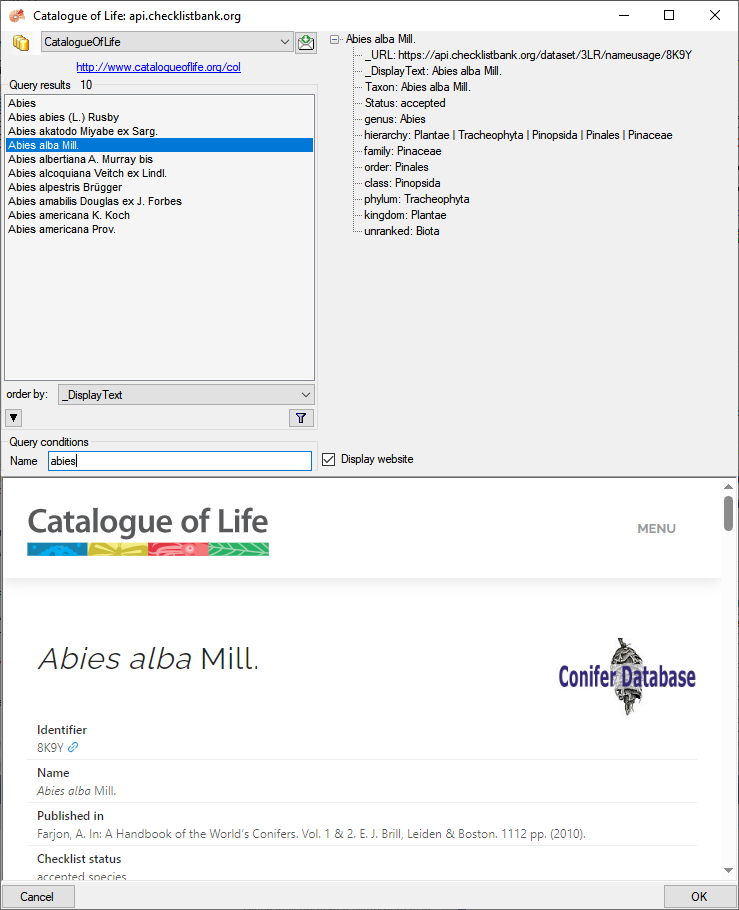
In the field Name in Query conditions enter your search string and
click on the filter button to start the query. In the
list of the left upper part the results of the query will be listed. In
the right part of the window additional information is shown as provided
by the webservice.
To include the link from the webservice into your
database choose one of the entries in the list and click OK. The entry
will change as shown below.

If you double-click on the link
area, a window will open providing you with the
retrieval information of the webservice (e.g.:https://api.checklistbank.org/dataset/3LR/nameusage/8K9Y).
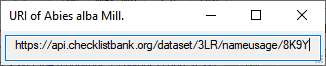
To receive the information related to an entry as provided by the
webservice click on the  button. A
window will open as shown below where information on the webservice is
listed in the upper part. If available, additional information provided
on a corresponding website will be shown in the lower part.
button. A
window will open as shown below where information on the webservice is
listed in the upper part. If available, additional information provided
on a corresponding website will be shown in the lower part.
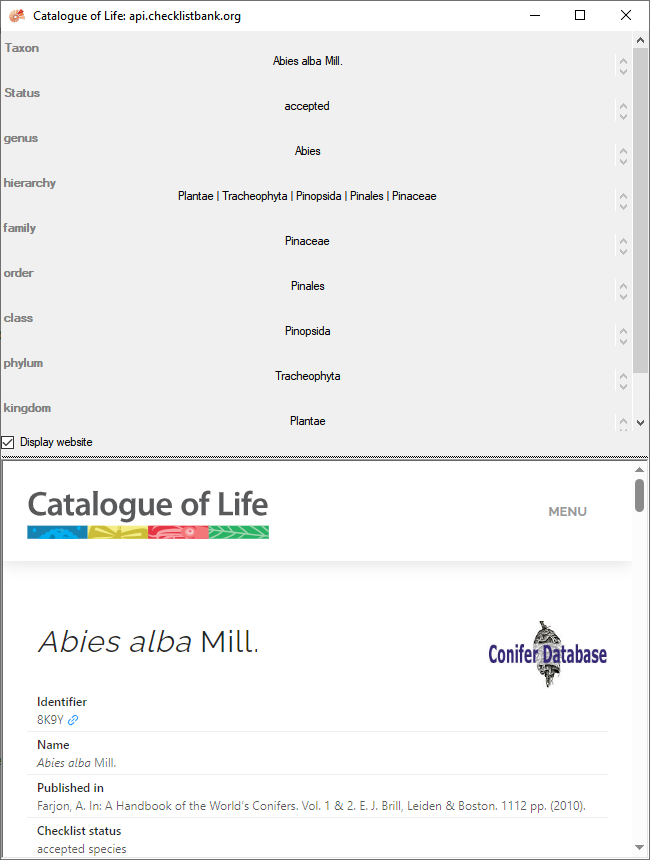
If you wish to remove the link to the webservice, click on the
button. This will only remove the relation to the
webservice, not the cached name.
Index Fungorum
Some modules within the DiversityWorkbench provide the possibility to
link your data to an external webservice. For example
DiversityTaxonNames gives you access to the taxonomic names of  Index
Fungorum. To establish a connection to this webservice, click on the
button. A window will open where you
may choose Index Fungorum from the database list (see below).
Index
Fungorum. To establish a connection to this webservice, click on the
button. A window will open where you
may choose Index Fungorum from the database list (see below).
Enter the query restriction for the name in the Name field in Query
conditions. The maximum number of records you receive may be set in the
max. results field  (choose a low
number, if you have a slow connection to the internet). Click on the
search button to start the query. In the list in
the left upper part the results of the query will be listed. In the
right part of the window additional information is shown as provided by
the webservice. For certain entries buttons will appear, as e.g. shown
above for the basionym and the current name of a scientific name. Click
on these buttons, if you wish to change to one of these related data
sets from the webservice. If available, the information provided on the
corresponding website is shown in the lower part. To include the link
from the webservice into your database choose one of the entries and
click OK. The entry will change as shown below.
(choose a low
number, if you have a slow connection to the internet). Click on the
search button to start the query. In the list in
the left upper part the results of the query will be listed. In the
right part of the window additional information is shown as provided by
the webservice. For certain entries buttons will appear, as e.g. shown
above for the basionym and the current name of a scientific name. Click
on these buttons, if you wish to change to one of these related data
sets from the webservice. If available, the information provided on the
corresponding website is shown in the lower part. To include the link
from the webservice into your database choose one of the entries and
click OK. The entry will change as shown below.

If you double-click on the link area
 , a window will open providing you with the retrieval
information of the webservice.
, a window will open providing you with the retrieval
information of the webservice.
To receive the entire information related to this entry as provided by
the webservice click on the DWB button. A window will
open as shown below where information on the webservice is listed. If
available, the lower part will show the corresponding information of a
website.
If you wish to remove the link to the webservice, click on the
button. This will only remove the relation to
the webservice, not the cached name.
Mycobank
Some modules within the DiversityWorkbench provide the possibility to
link your data to an external webservice. For example
DiversityTaxonNames gives you access to the taxonomic names of Mycobank.
To establish a connection to this webservice, click on the
button. A window will open where you
may choose Mycobank from the database list (see below).
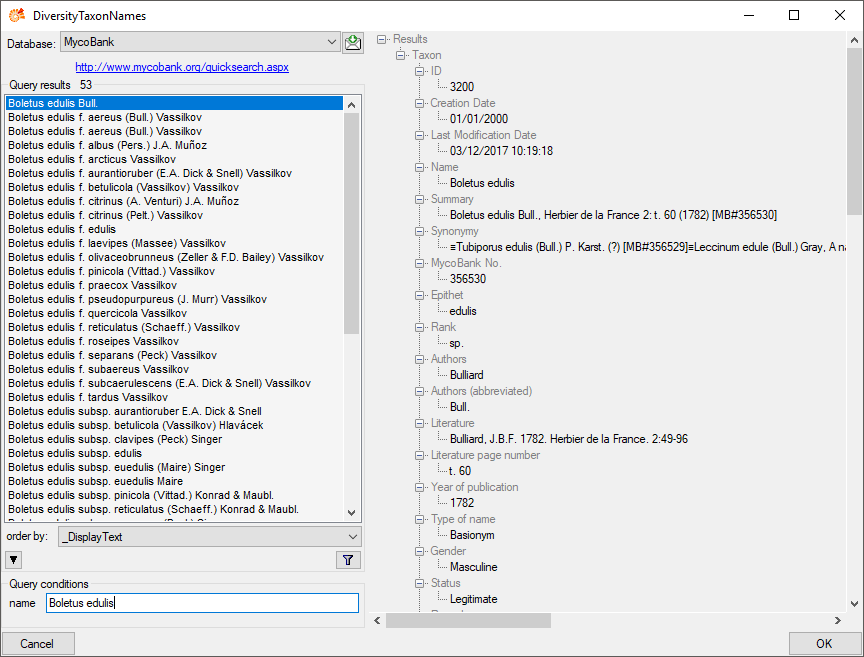
Enter the query restriction for the name in the Name field in Query
conditions. Click on the search button to start
the query. In the list in the left upper part the results of the query
will be listed. In the right part of the window additional information
is shown as provided by the webservice. To include the link from the
webservice into your database choose one of the entries and click OK.
The entry will change as shown below.
If you double-click on the link area
 , a window will open providing you with the retrieval
information of the webservice.
, a window will open providing you with the retrieval
information of the webservice.

To receive the entire information related to this entry as provided by
the webservice click on the DWB button. A
window will open as shown below where information on the webservice is
listed.
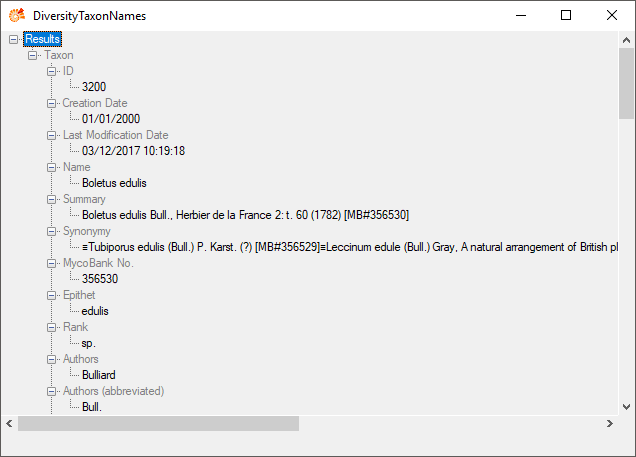
If you wish to remove the link to the webservice, click on the
button. This will only remove the relation to the
webservice, not the cached name.
Pan-European Species directories Infrastructure
Some modules within the DiversityWorkbench provide the possibility to
link your data to an external webservice. For example
DiversityTaxonNames gives you access to the taxonomic names of the  Pan-European Species directories Infrastructure (PESI). To establish a
connection to this webservice, click on the
button. A window will open where you
can choose PESI from the database list (see below).
Pan-European Species directories Infrastructure (PESI). To establish a
connection to this webservice, click on the
button. A window will open where you
can choose PESI from the database list (see below).
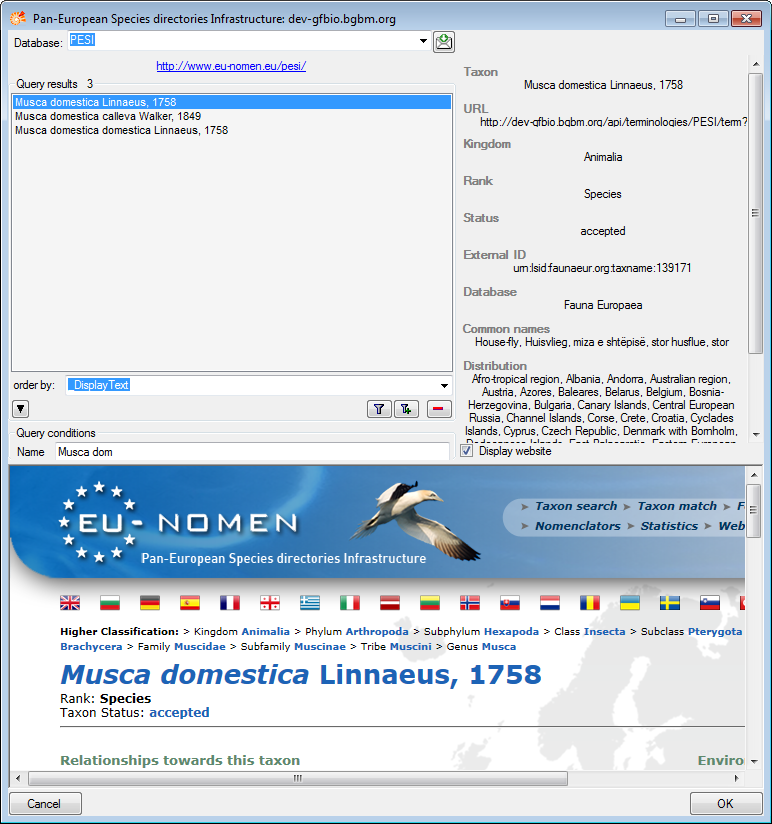
Enter the query restriction for the name in the Name field in Query
conditions. Click on the search button to start
the query. In the list in the left upper part the results of the query
will be listed. On the right part of the window additional information
is shown as provided by the webservice. If available, the information
provided on the corresponding website is shown in the lower part. To
include the link from the webservice into your database choose one of
the entries and click OK. The entry will change as shown below.
If you double-click on the link area
, a window will open providing you with the retrieval
information of the webservice.

To receive the entire information related to this entry as provided by
the webservice click on the DWB button. A
window will open as shown below where information on the webservice is
listed. If available, the lower part will show the corresponding
information of a website.
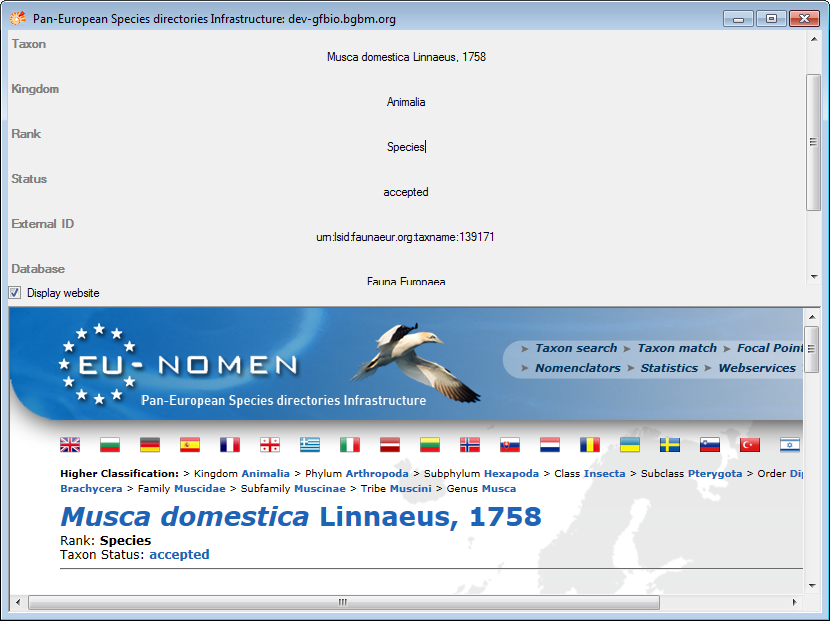
If you wish to remove the link to the webservice, click on the
button. This will only remove the relation to the
webservice, not the cached name.
Diversity Collection
Identification
Non biological units
Non biological units like soil,
rock or mineral do not have
biology related information like a qualifier or a type status. These are
therefore not displayed for these groups. Furthermore the source for the
names is not DiversityTaxonNames but DiversityScientificTerms (see a
short tutorial
,
).
If the source for a non biological unit is set to a
DiversityScientificTerms database (see above ) a
chart button will appear. With a click on this button
you can select the term from a chart as shown below.
In the database the data for the identification is stored in the table
Identification.
Diversity Collection
Identification
Sources for non biological objects
Diversity Workbench
The source for names for non taxonomic objects is the module DiversityScientificNames
Diversity Collection
Supplementary (dependent) identification
For an identification of a non biological unit with the source
DiveristyScientificTerms you may add a supplementary identification
 . The availability of this option
depends on the first identification. For example a geological sample
with the identification "Basanit" may get supplementary
identifications like "Glasige Matrix" of the type "Zement/Matrix"
and "Porphyrisch" of the type "Relative Korngrösse". The available
supplementary types are defined in the module DiversityScientificTerms.
For further information about dependencies among terms please consult
the manual of DiversityScientificTerms.
. The availability of this option
depends on the first identification. For example a geological sample
with the identification "Basanit" may get supplementary
identifications like "Glasige Matrix" of the type "Zement/Matrix"
and "Porphyrisch" of the type "Relative Korngrösse". The available
supplementary types are defined in the module DiversityScientificTerms.
For further information about dependencies among terms please consult
the manual of DiversityScientificTerms.
To insert a supplementary identification related to
DiversityScientificTerms click on the
button. A window as shown below will open with the database set
according to the main identification and the available term restricted
to those as defined as dependent to the selected type of the main
identification as defined in the DiversityScientificTerms database.
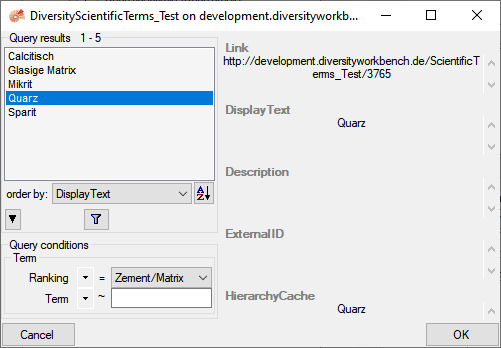
The type of the supplemental name is included in front of the
supplementary name as shown below and a type can be given several times
to indicate ranges or distinct items.
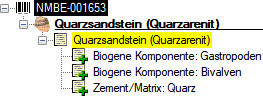
Diversity Collection
Taxon List
Tutorial:
To see the list of organisms within a Specimen
, CollectionEvent
, EventSeries
or SamplingPlot
click on the button which
will appear, if you select one of the corresponding items in the tree
(see below).
A window will open as shown below where you can gather additional
information stored in the module DiversityTaxonNames. You may include
the sex and the sum of the number of units as stored in table
IdenticationUnit or the number based on the organisms in the list.
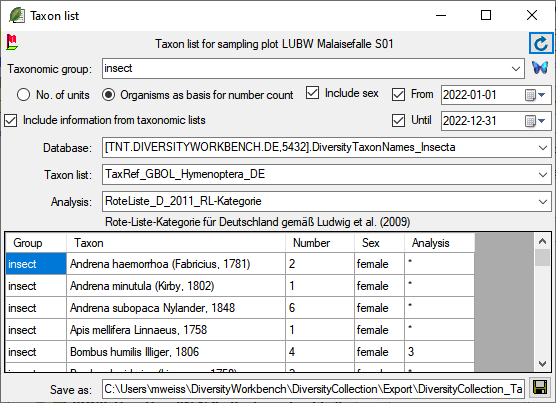
To retrieve information stored in the module DiversityTaxonNames for
names which are linked to this module select the taxonomic group of the
organism. Then select the option Include information from taxonomic lists. A combobox will appear where you may select the taxonomic
database. Next, select the project in the combobox and finally the
analysis. After all options are selected, click the button to
refresh the data. With the From and Until option you can
restrict the result depending on the collection date. To export the
results in a tab-separated list use the save button.
Diversity Collection
Parts
Storage and trees for the parts of the specimen
Main sectors
The image below gives you an overview of the main sectors related to the organisms.
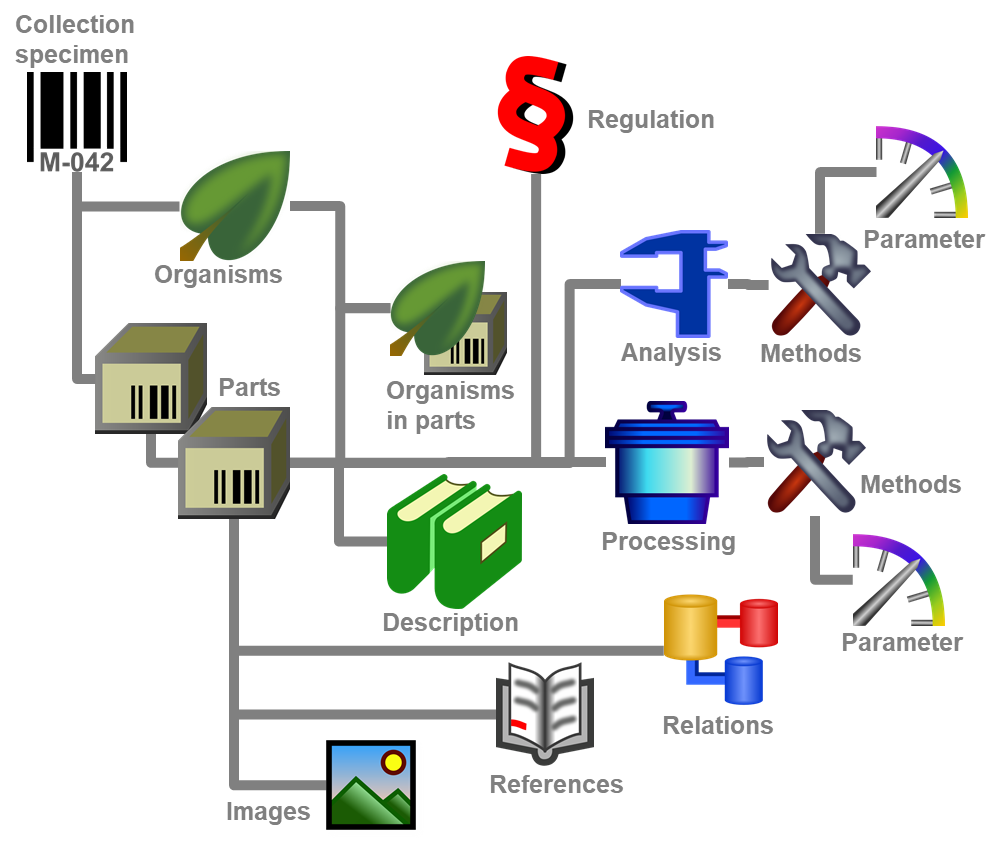
In the tree at the base of the window the parts of the specimen with
their related data are shown. This tree is only shown when parts are
present. To insert parts when the tree is hidden use the
 button and follow the upcoming dialogs. This
tree depicts the parts either in accordance to their relation to each
other in the specimen tree (click on the icon
in the panel on the left) ...
button and follow the upcoming dialogs. This
tree depicts the parts either in accordance to their relation to each
other in the specimen tree (click on the icon
in the panel on the left) ...
... or depending on the collections where the parts are stored (click
on the  icon in the panel on the left).
With the buttons in the left panel you may hide or show certain nodes in
the tree. If e.g. you do not wish to see the processings, simply click
on the  button and they will be hidden in the
tree. The button will change to a grey version
button and they will be hidden in the
tree. The button will change to a grey version
 and the background will turn
yellow, to show you that there is hidden data of the processings.
and the background will turn
yellow, to show you that there is hidden data of the processings.
The panel on the right of the tree is for editing the data, for example
the  button will insert a new transaction.
For data with [Read only]
access these panels are disabled except the button for adding
annotations . For further details see the
sections Transaction and
Processing.
button will insert a new transaction.
For data with [Read only]
access these panels are disabled except the button for adding
annotations . For further details see the
sections Transaction and
Processing.
Subsections of Storage
Diversity Collection
Part
Parts of the specimen
A specimen can contain several parts which may be stored in several
collections. These parts may represent different material categories,
e.g. herbarium sheets, microscopic slides etc. The parts are shown in
the part tree under the main tree. This tree depicts the parts either in
accordance to their relation to each other in the specimen tree (click
on the icon in the panel on the left) - see
first image below - or in relation to the collections where the parts
are stored (click on the icon in the panel on
the left) - see second image below. Here the two parts of the specimen
are located in two collections. To add a new part use the drop-down
field in the panel on the right of the
tree and choose the material category of the new part. The material
categories which appear in this list can be customized.
You can set the a default collection for new parts. If
the default collection is not set, you will be asked to name the
collection of the new part. If the part is derived from another part,
select this in the tree before creating the new part. The new part will
then be added as a child of the old part. You can later edit these
relations by drag & drop. If you wish to create a copy of a part, use
the button in the panel on the right side of the
tree. To insert parts when the tree is hidden use the button and follow the upcoming dialogs. As
another option you can transfer all specimens in the result list of a
query via the menu Data -
Transfer - To collection ... into a collection. Please keep in mind
that next to adding part existing part will be transferred to the
selected collection as well.
Subcollection
To see the whole content of a collection, click on the
 button. All specimens within the
collections will be listed as shown below with e.g. their accession
number, accession number of the part, storage location, collection date
and/or locality as set in Customize
.
button. All specimens within the
collections will be listed as shown below with e.g. their accession
number, accession number of the part, storage location, collection date
and/or locality as set in Customize
.
Display order
If an organism is present in a part of the specimen, it will be shown in
the tree. To edit its presence select the specimen part in the tree and
edit the Display order as shown below.
In the example above, all organisms are present in the specimen.
However, the fungus Cystotheca lanestris was chosen not to appear on
the label and was transferred to the Hide list. This is symbolized
by a grey icon  in the tree. You may enter a
description for an organism as a whole or for
the organism within a certain part. The slide, symbolized by the
in the tree. You may enter a
description for an organism as a whole or for
the organism within a certain part. The slide, symbolized by the
 icon, was created from the sample. Thus, in the
specimen tree it is shown as a child of the specimen symbolized by the
icon. Concerning the organisms only the
fungus Arthrocladiella is found on the slide. Thus, in the tree it is
the only organism shown as child of the slide. In the display order the
two other organisms appear in the Units not in part list (see
below).
icon, was created from the sample. Thus, in the
specimen tree it is shown as a child of the specimen symbolized by the
icon. Concerning the organisms only the
fungus Arthrocladiella is found on the slide. Thus, in the tree it is
the only organism shown as child of the slide. In the display order the
two other organisms appear in the Units not in part list (see
below).
To move the organisms between the lists use the > and <
buttons. In the list Show in label you may change the sequence of
the organisms with the and
buttons in the panel at the base of the list. The organism at the top
will be the one taken as the main organism, e.g. for printing a label.
To see changes of the stock of the part click on the button
 . A window will open listing all previous volumns
together unit, the date and the responsible user.
. A window will open listing all previous volumns
together unit, the date and the responsible user.
To change the sequence of the parts according to e.g. the name instead
of setting all entries one by one, you may choose among the options
shown in the image below (Name, Identifier, ID).
Details
To edit the details of a part select it in the tree to open the fields
as shown below.
The identifier, e.g. the taxonomic name under which the specimen can be
found in the collection is entered in the field Storage location.
You can search for this entry in the query.
With the template you can define and
copy predefined values into the data (see
chapter Template).
To search for a free accession number use the
button (see chapter Accession). To enter the storage
location you may use the drop-down button to
select from e.g. the identifications within the specimen. The source for
the list can be specified under Administration - Customize display ... (see below).
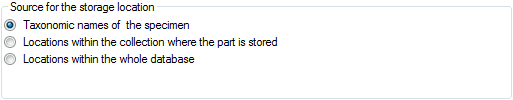
The drop-down button for the Notes will
provide you with a list of all entries in this field, filtered with your
entry in the text field. You may use wildcards like "%" or "_" (see
Wildcards).
Collection
In the collection tree, the specimens are shown with their dependence
upon each other based on their location in Collections. To get
information about a collection simply select it in the tree. If you have
the required rights, you may use the button
to open the administration of the collections. This form is accessible
under the menu entry Administration -
Collections... as
well.
Material
The material category of a specimen part is indicated by the icon in
the hierarchy.
Here some examples:
 bones: bones or skeleton from vertebrates
 cultures: living cultures of organisms
 drawing: original line or color drawing
 herbarium sheets: capsules or sheets as
stored in a botanical collection
herbarium sheets: capsules or sheets as
stored in a botanical collection
icons: icons, images etc. stored in a botanical
collection
micr. slide: glass plate with sections of specimen
for microscopic studies
specimen: specimen stored in a collection\
Transaction and processing
Specimens can be included in a transaction. Every
stored part of a specimen may be treated with several
processings.
Images
If there are images which are related to the
current part, the button for the restriction of the images will be
enabled ( → ). Click on
it to restrict the images to this part. The button will receive a red
background to
remind you of the restriction and in the image list a button
will appear which enables you to show all
images.
Editing in tables
To edit the parts of the specimens in a table see the chapter Grid forparts, use the Table
editor for the Part
table or the Part sheet from the
Spreadsheets.
The data is stored in the table
CollectionSpecimenPart.
Diversity Collection
Parts
Material categories
The objects stored in a collection is organized in material categories
to facilitate the recognition of specimen containing diverse materials
and to enable a specific design for the processing
where e.g. bones differ in treatment from DNA samples. The list of
material categories visible for the creation of new entries may be
restricted as described in the chapter about the
customization.
To administrate the material categories, choose Administration -
Material categories... from the menu. A window as shown below will
open.
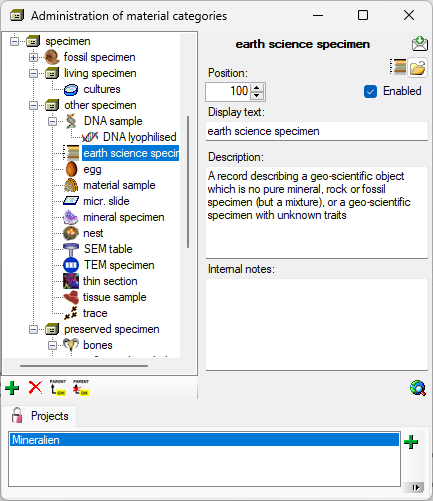
To add resp. remove a material category use the
resp. the delete button. To set the superior material
category use the button. With the open button you can set a symbol for the material
category. Please keep in mind, that this will be converted into a 16 x
16 size icon with black regarded as background and translated to
transparent
.
For the translations for display texts, abbreviations etc. please see
the chapter about database description.
At the base of the window, the projects that are restricted to an entry
are listed (see
).
To administrate the projects that should restrict the available material
category choose Administration - Enumerations - Project - Material
category... from the menu. A window as shown below will open. If a
project is restricted, the client settings will be ignored (see chapter
Customize).
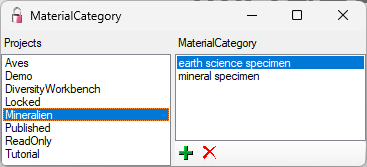
To add resp. remove a material category for a project use the resp. button.
To add a more detailed description of a part, please use the Descriptions of specimen parts and are involved in the mapping for ABCD.
Diversity Collection
Processing
Every specimen resp. part can be processed, e.g. for preparation or preservation.
Processings can be applied to a specimen or parts of a specimen. In the
hierarchy for the parts the processings are indicated by the icon and a blue text. If there are any
processings available, they will be indicated by the icon in the tool
bar. Please keep in mind that the availability of the
processings depend upon the material category and the current
project as described below. You can hide
or show the
processings in the hierarchy with a click on the icon in the very left
bar (see below). The images below show a processing in the collection
and the specimen tree for the parts respectively.
You can enter a new processing for either the entire specimen or a part
of the specimen. To do this select the specimen or part in the hierarchy
and choose a processing from the list as shown below.
The duration of the processing is saved in ISO8601 format by
default indicated by the ISO icon with separate fields
for year to second (see below). To change to text format, click on the
ISO icon that will change to ISO and the
separate fields will be replaced by a text box containing the value. If
separate fields are only available if the value is in ISO 8601 format.
If the start date for the processing is given the processing duration
can be set via the calender. In case of the ISO format
selected this will be translated into the corresponding period. In case
of the ISO format deselected the date will be inserted.
See a short introduction for an overview:
To delete a processing select it and click on the
button. To edit the data for a processing select it in the hierarchy.
The window will show you the fields related to the processing. You may
add methods for the processing as defined in section
Method.
For an example including synthetic material from a 3D-printer see chapter artefact
(If you previously used any tools defined in the toolsection, these are deprecated and replaced by methods).
Administration
If you have the required rights you may edit the processing types in the
menu entry Administration - Processing...
In this window you can define the processings used in your collection.
To add a new processing click on the button, to
delete a processing select it and click on the
button. The processings are related to material categories within the
database. To add a new material category or projects,
which should be connected to the selected processing, click on the button in the panel right of the material categories
or the projects. A window will open where you need to select the desired
material category or project respectively (see below).
The processing types are organized in a hierarchy. Some of the entries
may only serve for structuring as Maceration in the example below and
should not be used to document the processing of specimen parts. To
ensure this check the checkbox [Only hierarchy]. For the import
and export of data it is sometimes necessary to know the ID's of the
analysis types. To see the ID's of the data sets click on the
[ID] button. The ID's will then be displayed as in the image
shown below.
Methods
Besides of a plain text description of the processing, you may insert
methods as defined in the chapter Methods. Use the and buttons to add or remove
methods from the list (see below). The added methods will be marked with
sequential number to allow several methods of the same type. Every
method may have several parameters that will
automatically be available to take your values. If the definitions of
the parameters have been changed, you may add missing parameters with
the add button. A window will open where you can select
the missing parameters you want to add.
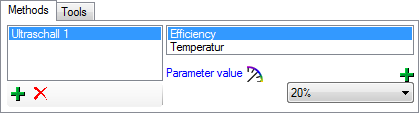
To view the history of a data set, click on the button. A window
with the history will open. For more details see the section
History.
The data of the processing is stored in the table
CollectionSpecimenProcessing.
Diversity Collection
Description of the parts of the specimen
Tutorial:
A part of a specimen may be characterized with links to a standardized
vocabulary from DiversityScientificTerms. Use the add button to add and the delete button
to delete descriptions (see below). If the description refers to a
certain unit, you may select it in the list as shown below.
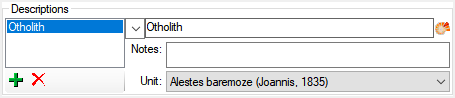
The data is stored in the table
CollectionSpecimenPartDescription
Diversity Collection
Collector
The people or groups responsible for the gathering of the specimen are
stored in the
CollectionAgent table. There may be
several collectors for one specimen. In the tree, the collectors are
symbolised by the icon, as shown below.
To hide or show the collectors in the tree, use the
icon in the left panel (it will change to a grey version
with a yellow background when the collectors
are hidden). To insert a collector, choose either the specimen or an
existing collector in the tree and then click on the
icon in the right panel. Select a collector in the
tree to enter details. In the right part of the window, the detail fields
will appear as shown below.
If a collector should refer to a dataset in the module DiversityAgents
(where more details like addresses may be stored), click on the
button. If in the module
DiversityAgents a synonym is chosen, you will get the data of the
correct name instead. The sequence of the collectors (e.g. for print
on a label) as shown in the tree can be changed with the
and buttons in the panel on the
right side of the tree.
With the template, you can define
and copy
predefined values into the data (see chapter
Template).
To remove a collector, select the entry in the tree and click on
the button.
You can search for the gathering numbers of the collectors in the
query.
Data of the collectors is stored in the
CollectionAgent table.
Diversity Collection
Reference
For Specimen, Unit, Identification or Part
Tutorial:
To each specimen, organism or part you can add references. To add a
reference select the specimen (symbolized by the barcode
), organism (e.g. ,
 ,
,  ), identification
or part (e.g.
, ,
), identification
or part (e.g.
, ,
 ) in the tree and click on the
  button in the panel right of the tree. This
adds a reference to the selected item as shown in the image below.
button in the panel right of the tree. This
adds a reference to the selected item as shown in the image below.
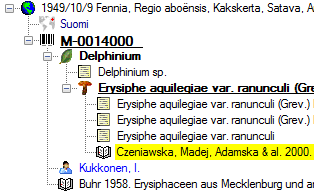
Linking selected data
To link the data selected in the query to a reference, choose the target of your choice
from the menu. A dialog will guide you through the process of linking your selected targets to the choosen reference.
The entries may be linked to the module DiversityReferences.
The data is stored in the table
CollectionSpecimenReference.
Diversity Collection
Relation
Each specimen may have relations to other specimens. For example a
duplicate, a specimen isolated from the same material or a part of a
specimen may be located in another collection. Another example is link
to e.g. GenBank where information connected to the specimen can be
found. This can be documented by adding relations to these specimens. To
add a relation select the specimen (symbolized by the barcode
), organisms (e.g. ,
,  ) or part (e.g.
 , ,
) in the tree. You may then either add a relation to
a local specimen using the
, ,
) in the tree. You may then either add a relation to
a local specimen using the  button or add a
relation to a remote specimen using the
button or add a
relation to a remote specimen using the  button in the button panel on the right side. To show or hide the
relations in the tree use the and
button in the button panel on the right side. To show or hide the
relations in the tree use the and
 buttons. For an overview see a short
tutorial
.
buttons. For an overview see a short
tutorial
.
Internal relation
To add an internal relation to a local specimen use the button. A window will open where you may search
for the related specimen.
Select the related specimen from the query result list and click OK to
close the window and
establish the relation.
In the image above you can see an internal
relation while the image on the below shows a
reverse relation  from another specimen.
In the case of internal relations you can navigate to the related
specimens using the button.
If linked dataset of a relation is removed, the orphaned relation can be
removed in the  maintenance.
To search for specimen with internal relations either source or target
of the relation use the  Internal relation section in the query
External relation
To add an external relation to a specimen which is not administrated in
the database DiversityCollection use the button. In the image below you can see
a relation to a specimen in an external collection.
Deleting relations
To delete a relation select it in the tree and click on
the button.
Relations to units and parts
If the relation should be If the relation should be referred to an
organism, part or organism in a part either select the organism or part
in the tree and add the relation or use the mouse to drag the relation
into the correct position (see examples below).
Specimen
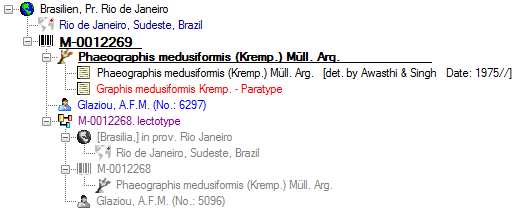
Organism
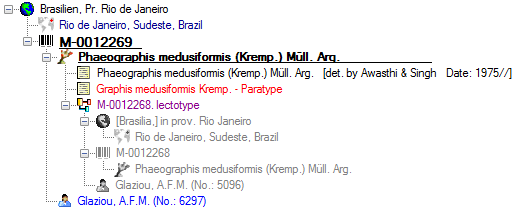
Part
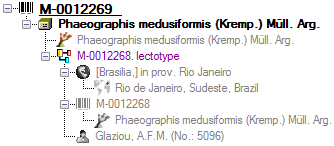
Organism in Part
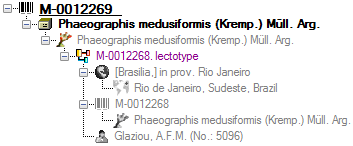
Details of the relations
Together with the relation the details of the dataset is shown in the
overview tree. To hide these details click on the
button (see example below).
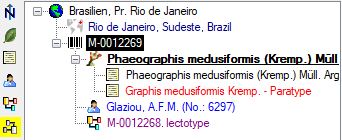
Editing the data
To edit the data for a relation click on the entry in the tree. In the
right part of the window the details of the data set will be shown (see
below).
The data is stored in the table
CollectionSpecimenRelation.
Diversity Collection
Exsiccatae
Exsiccatal series and related information are administrated in the
module DiversityExsiccatae. For a search in the data provided by this
module click on the DWB button.
For direct access to the information about the exsiccatal series in this
module you require the application DiversityExsiccatae.exe in your
application directory, the database DiversityExsiccatae and a valid
account in the database. For more information see the
DiversityWorkbench Portal.
Diversity Collection
Images
Creating and removing images
To insert a new image click on the new button. A window
will open where you can enter the path and file name of the image. Click
on the button to search for a web address of an image as shown below.
URL of image
The URL for images can not be changed in the main form. Instead you have to create an image with the new URL and delete the image based on the old URL.
To edit the URL, please use the TableEditor for the corresponding image table.
To use an image available as a local file click on the open button to search in your local directories. You can
upload this file via a webservice to the server of an institution
providing the DiversityMediaService. To use
this service you may rename your image either using a GUID or according
to the accession number including date and time. Use the  upload button to upload your image to the server.
To delete an image select it from the list and click on
the button.
Setting the maximal size for an image
To prevent the application from becoming unresponsive due to large images, you can set the maximum size of images. If an image exceeds the specified size, it will not be displayed, and the size of the image will be displayed as shown in the figure below.
Orientation and zoom level of the images
To zoom a specific sector of an image simply drag the mouse over the
preferred area of the image. A red square will indicate the zoomed area.
To set the size of the image to its original resolution click on
the button. To adapt the size of the image to
the available space in the form click on the
button. To change the orientation of the image use the appropriate
buttons ( flip horizontal,
flip
vertical, rotate
right, rotate left).
To correct the orientation of an image according to the rotation
documentend in the EXIF data, click on the
button. The button will activate the orientation according to the EXIF information indicated by a yellow background . An example is demonstrated in the video:
.
Separte window for images
To view the image in a separate form click on the button.
Fixing path issues
For images with a path containing escape signs (e.g. %2F) the
translation of these sign can be suppressed using the %2F resp.
/ button.
Withholding images
If the image should not be published e.g. on the internet, enter any
reason in the Withhold. reason - field. Next to images you can store
other media.
High resolution images
For images where a high resolution version is available, a zoom button
 will appear as shown below.
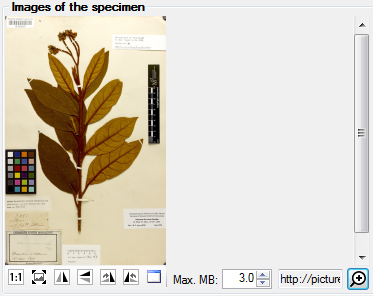
Click on the zoom button to open a window to see
details of the image as shown below (using krpano/
software).
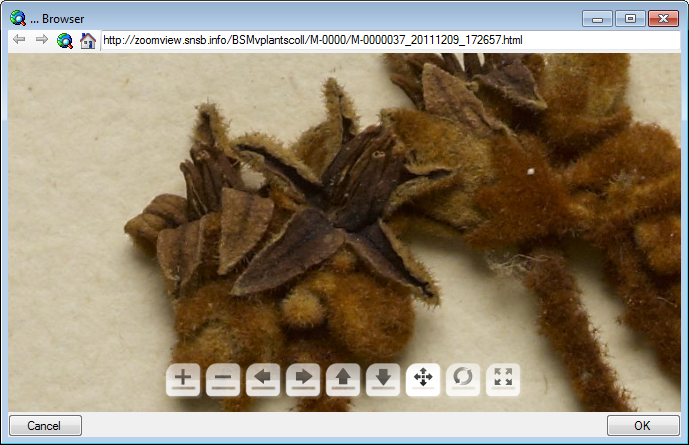
Description of images
For the description of a medium see the chapter Imagedescription.
Datatables
Data is stored in the tables
CollectionSpecimenImage,
CollectionEventImage ,
CollectionEventSeriesImage
and CollectionImage.
Subsections of Images
Diversity Collection
Image Description / EXIF
The EXIF content is derived from the original image (see below). This
will be automatically extracted from the image.
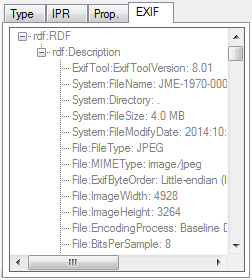
To extract the EXIF content of an image, the image must be accessible
from a local directory and the exiftool.exe (see below) must be
available in the application directory.

Diversity Collection
Next to images you can store audio  and video
 files. Click on the [>>>] button (see below)

To open Windows Media Player and play the content of the media. You must
have Windows Media Player
installed to use this function. For the description of a medium see the
chapter Image description.
Diversity Collection
The webservice DiversityMediaService provides the possibility to upload
media files like images, audio recordings, etc. to a server. The usage
of this webservice includes several preconditions (please turn to your
administrator):
- You need an account in the DiversityWorkbench module DiversityAgents
with your login in DiversityCollection linked to this account
- Your project has to be registered on the server
- You have to rename your media file according to the settings of the
server e.g. using a GUID (see image below)
Use the upload button to upload your image to the
server.
Diversity Collection
Methods
The methods used for collection events, the
analysis of the organisms or the
processing of the material. To administrate these
methods, choose Administration →  Methods
... from the menu (only for Administrator). A window as shown below
will open. For an introduction see a short tutorial
.
Methods
... from the menu (only for Administrator). A window as shown below
will open. For an introduction see a short tutorial
.
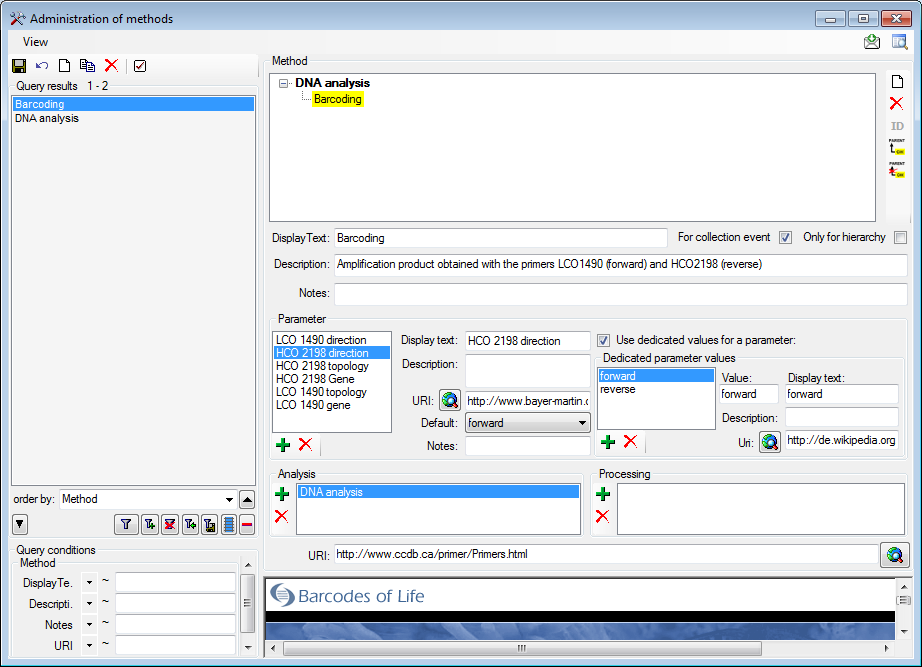
There are 2 lists where you can define for which analysis resp.
processing the selected method may be used. If the checkbox For
collection event is checked, this method may be used for collecting
events. To organize your methods you can add methods with the checkbox
Only for hierarchy set to true . For these
methods the sections for entering details are disabled. The methods may
contain several parameters as shown above. To insert a parameter click
on the button. If a parameter should only allow
predefined values, check the Use dedicated values for a parameter checkbox and add values using the button. With the buttons you can remove parameters or predefined
values.
To view the history of a dataset, click on the button. A window
with the history will open. For more details see the section
History. For any comments to this part of the
application, use the
feedback
function.
In the main form you can add a method to a collectionevent or a
processing. Choose the respective item in the tree and
click on the add button to add a method (see below).
Depending on the selected method, you get a list of parameters for which
the values can be set. For the parameters where default values are
available, these will be inserted when adding the method.
You may add several methods for one analysis resp. processing or
collection event as shown above.
Diversity Collection
Annotation
If you are a user, having no rights to edit any data in the database,
you can still add annotations for a collection
event, a collection
specimen, a part of a
collection specimen or an
organism (= identification unit). With
annotations you can start a discussion about items in the database where
annotations refer to previous annotations on the same subject.
For data where you have Read Only access, you
can still add annotations.
The available types are annotation and
 problem. To add an annotation, select the
corresponding data in the tree view. In the tool panel on the right of
the tree view a button will appear: if no
annotations have been added so far or if
there are annotations for this entry. A window will open as shown below.
problem. To add an annotation, select the
corresponding data in the tree view. In the tool panel on the right of
the tree view a button will appear: if no
annotations have been added so far or if
there are annotations for this entry. A window will open as shown below.
To add an annotation, click on the add button and select
the type of the annotation. If you want to add an annotation depending
on an existing annotation, select the superior annotation in the tree
and click on the  button. The annotation will be
shown in the tree with the details listed below (see image below).
button. The annotation will be
shown in the tree with the details listed below (see image below).
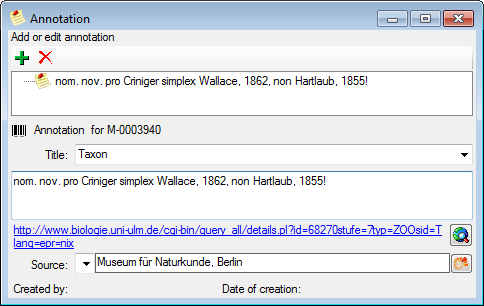
Enter your annotation in the text box as shown above. You can enter a
title or subject for your annotation or select one from the list. You
may enter a link and a source as shown above. The source may be related
to the module DiversityAgents.
To delete an annotation you have to be either an
administrator or a data manager. Select
the annotation and click on the delete button.
If you want to see all annotations of the current specimen choose
Data - All annotations... from the menu. All annotations will be
listed as shown below.
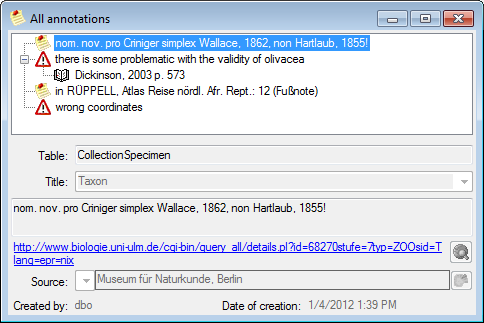
Data for the annotations are stored in the table
Annotation.
Diversity Collection
Collection Management
Main sectors
The image below gives you an overview of the main sectors related to the collection.
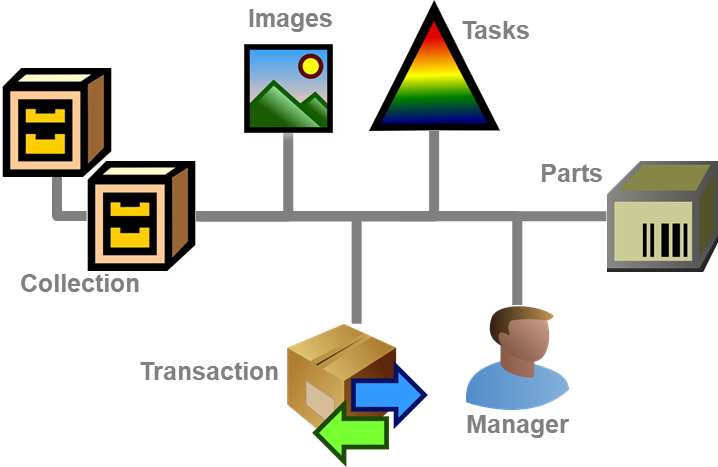
Collections are managed by  collection managers (see Administration
→ Transaction management → Collection managers ... in the menu),
who organize the transfer of specimen
between collections and track the exchangebalances
collection managers (see Administration
→ Transaction management → Collection managers ... in the menu),
who organize the transfer of specimen
between collections and track the exchangebalances  . Any
transfer of specimen is organized via
transactions (see Administration →
Transaction management → Transaction ... in the menu).
. Any
transfer of specimen is organized via
transactions (see Administration →
Transaction management → Transaction ... in the menu).
An overview is given in the image below.
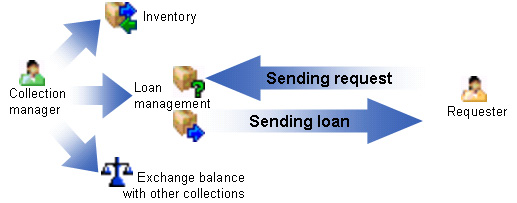
Subsections of Collection
Diversity Collection
Collection
The parts of a specimen can be stored in several collections. To see the
place where a specimen or parts of it are stored use the lower tree and
click on the icon to select the display
according to the collections as shown below and in a short tutorial
.
In the tree shown above select the collection
to display the data fields as shown below.
To be able to edit the details of a collection, you must be a collection
manager of this collection. The restrictions for the access for editing
the collections are defined in the
CollectionManager section.
At the base of the fields you find the default collection, used for the
creation of new specimen parts. Specimen parts that are not created as a
part of another part will be placed in this collection. Use the edit button to edit this entry (see below) For another
possiblity to edit this value choose Administration - Customizedisplay from the menu.

Administration of the collections
If you need further information about a collection click on the button or choose Administration -
Collections... from the menu to open the window for the collection
administration (this menu entry is only available for collection
managers). This will open a window (see below) where you can edit the
collections used in your database for which you are a collection
manager. You can choose among several options to show resp. hide the
hierarchy:
- Show whole hierarchy
 Superior datasets and children of
current dataset
Superior datasets and children of
current dataset Restrict to superior datasets
 Hide the hierarchy
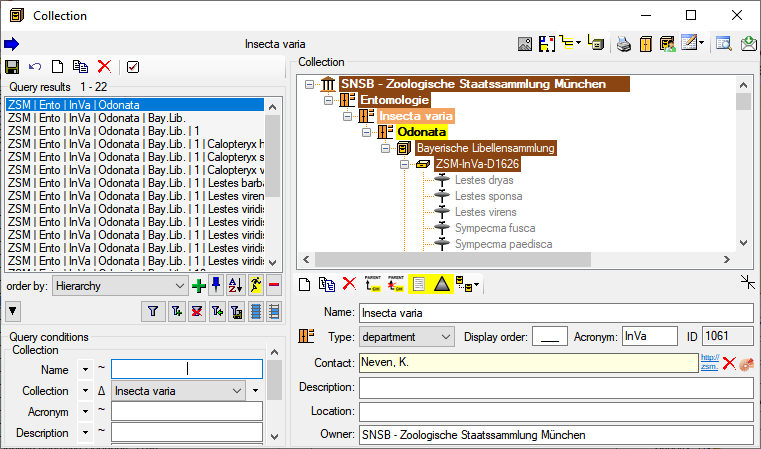
Specimen placed in the collections
With the button, you can display the
specimen stored in a collection within the hierarchy (see below).
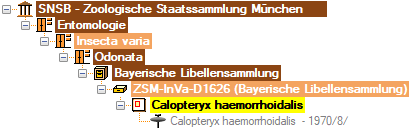
As an alternative the specimens stored in a selected collection can be
listed in the specimen list. You can hide / show this list using the
[  ]/
button. The specimen list will appear as shown below. Click on the
collection in the tree view to fill the list and see the specimens that
contain parts which are placed in the current collection. To transfer
the parts of certain specimen from the current collection to another
collection, choose them in the list and click on the button. To change to a specimen from this list
click on the button.
]/
button. The specimen list will appear as shown below. Click on the
collection in the tree view to fill the list and see the specimens that
contain parts which are placed in the current collection. To transfer
the parts of certain specimen from the current collection to another
collection, choose them in the list and click on the button. To change to a specimen from this list
click on the button.
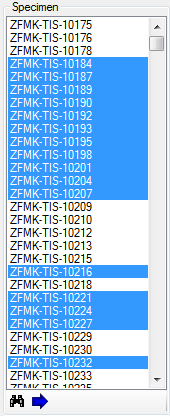
As an alternative you may select the specimen in the main form a choose
Data - Transfer -
To Collection ... from the menu. A window will open where you can
select the collection in which you want to transfer the specimen. With
this option [ALL] parts of the selected specimen will be
transferred into the selected collection.
Creating new collections
To create a new collection use the button either
above the Query results or the button right of the
hierarchy, where the new collection will be placed underneath the
collection selected in the hierarchy. To copy a collection either use
the button or the  button. The latter will copy the collection including all child
collections. To set the superior collection, use the button. The user creating the new collection
will automatically be inserted as a collectionmanager for this collection. To remove
a collection, any collection manager must be
removed from this collection first. Click on the
button. The latter will copy the collection including all child
collections. To set the superior collection, use the button. The user creating the new collection
will automatically be inserted as a collectionmanager for this collection. To remove
a collection, any collection manager must be
removed from this collection first. Click on the  button to open a window for the
administration of the collection managers. For new versions of the
database the removal of the link of collection managers to deleted
collection will be done automatically. To transfer collections in the
list as children into another collection, click on the
button in the upper left corner.
button to open a window for the
administration of the collection managers. For new versions of the
database the removal of the link of collection managers to deleted
collection will be done automatically. To transfer collections in the
list as children into another collection, click on the
button in the upper left corner.
Administration of collection types
To administrate the types for the collections, click on the  button. A window will open where you can create
new types and add icons representing a type (see below).
button. A window will open where you can create
new types and add icons representing a type (see below).
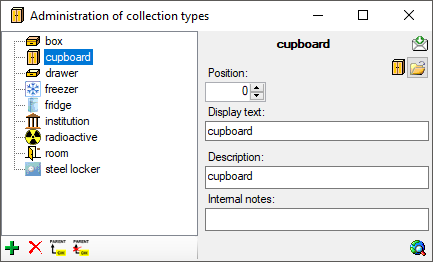
Use the buttons to add resp. remove a type and the buttons to handle the hierarchy. For new types you can use the button to add an icon for the new type.
The type  regulation is provided for the
collections that are meant to administrate the access to transactions of
the type regulation. See chapter Transaction or
further details.
regulation is provided for the
collections that are meant to administrate the access to transactions of
the type regulation. See chapter Transaction or
further details.
Images
If there are images depicting the collection a yellow background
will
indicate the availability of these images. To show the images, click on
the show images button. The button will get a red background and this will open the area for the images as shown below. Use the new and delete
buttons to add or delete images of your collection. For further details
about handling images see chapter Images.
Plan
If a floor plan is available for a collection this will be indicated by a yellow background
 . For details see chapter collection floor pan.
Label
To print labels for e.g. drawers, click on the print
button. The area for printing the labels will be shown (see below). Further details about printing labels are described in the chapter Label.
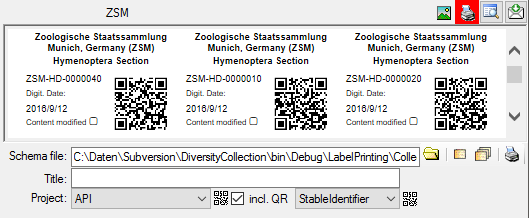
For the generation of QR-Codes there are 2 options:
Data in tables
To edit the contents of the tables in the table editor select
-
Collection resp.
-
Image from the menu. For Details
see chapter TableEditors.
History
To view the history of a dataset, click on the history button. A window
with the history will open. For more details see chapter
History.
Data
For details about handling data see the Data section. Data
of the collections is stored in the table
Collection.
Diversity Collection
Collection Manager
Collection managers are users with the right to edit the transactions
for a collection, including loan, purchase, inventory etc. To
administrate the collection managers you must be in the administrator
group. Either choose - Administration - Transaction management -
Collection managers from the menu
or Administration - Collection and there the
button to open the editing window for
the collection managers as shown below.
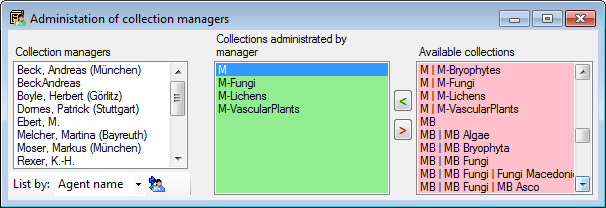
Use the < and
> buttons to edit the list of the
collections for which the selected collection manager can create and
edit transactions.
After changes in the collection managers you will be reminded to save the changes in the cache tables.
The collection managers can be listed with their names or their logins.
Change this with the list by option at the base of the list. If after
e.g. a database have been moved to another server, the may exist logins
with names not matching those on the server. Click on the
 agent synchonisation button to correct this. In case of
duplicate permissions you might get a list with these duplicates where
you have to remove the duplicate permissions.
agent synchonisation button to correct this. In case of
duplicate permissions you might get a list with these duplicates where
you have to remove the duplicate permissions.
For details about handling the collections see the
Transaction section. Data of the collection managers
is stored in the table
CollectionManager.
Diversity Collection
Collection User
The access of users to collections can be restricted. To edit the
collection list for a user choose - Administration - Transaction
management - Collection users ...  from the menu. A window will open, where you can add or remove
collections a user has access to as shown below. The access [includes
all subordinate collections]. This means adding a collection to
the list a user has access to also grants the user access to the
subcollections as defined in the hierarchy of the collection. In the
example shown below the second entry is not necessary as it is already
included in the first entry.
from the menu. A window will open, where you can add or remove
collections a user has access to as shown below. The access [includes
all subordinate collections]. This means adding a collection to
the list a user has access to also grants the user access to the
subcollections as defined in the hierarchy of the collection. In the
example shown below the second entry is not necessary as it is already
included in the first entry.
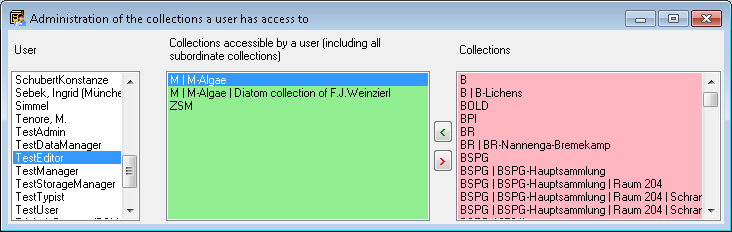
Use the < and
> buttons to edit the list of the
collections for which the selected user has access to.
After changes in the collection users you will be reminded to save the changes in the cache tables.
If a user has no collections in the list, all
collections are available for this user.
A collection manager has access to the
collections he is allowed to manage as well as those in the list as a
collection user.
Data of the collections is stored in the table
CollectionUser.
Diversity Collection
Location
Tutorial: (Newer versions (4.6 onwards) have a separated hierarchy tree in the collection form, but functionallities are the same - see below)
There are 2 hierarchy available for collections (showing the whole
hierarchy or only the parent datasets):
 Administration
 Location
To enable the location hierarchy, either in the custom settings - in the
menu choose Administration - Customize display... and then
in the Defaults and miscellaneous tab set the
option or in the collection window
click on the in the top.
A second tree will be visible, with the hierarchy of the collections according to their location (see example below). Not accessible locations will have a grey icon.
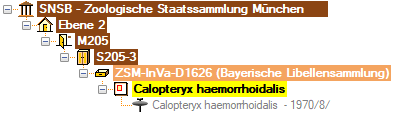
To set resp. remove a parent location click on the
resp.
 button. With the
button a window will open where
you can choose the parent location for the current dataset.
button. With the
button a window will open where
you can choose the parent location for the current dataset.
After selecting a location different from the location selected in the query and you have access to this location, a button will appear. Click on this button to change to the selected location. The list of locations to choose from is restricted to collections of the types ‘collection’, ‘department’, ‘institution’, ’location’ or ‘room’ and collections that are linked to another superior location.
As an alternative to transfer collections in the list as children into another parent location, click on the Transfer to location button in the upper left corner with a brown background. A Window will list all locations in the current database and the software will ensure that the transfer will not lead to loops in the hierarchy. Transfers that would result in a loop will be listed in an error message.
Diversity Collection
Floor plan
&
geometry
Floor plan
To use floor plans and geometries and their inheritance, you must use the location hierarchy.
If a floor plan is available for a collection this will be indicated by
a yellow background  . To provide
the floor plan of a collection click on the button in the menu. It will get a red background to indicate, that the plan is shown.
Then click on the open button to select the floor plan.
Click on the save button to save the plan. For a short introduction see the video .
. To provide
the floor plan of a collection click on the button in the menu. It will get a red background to indicate, that the plan is shown.
Then click on the open button to select the floor plan.
Click on the save button to save the plan. For a short introduction see the video .
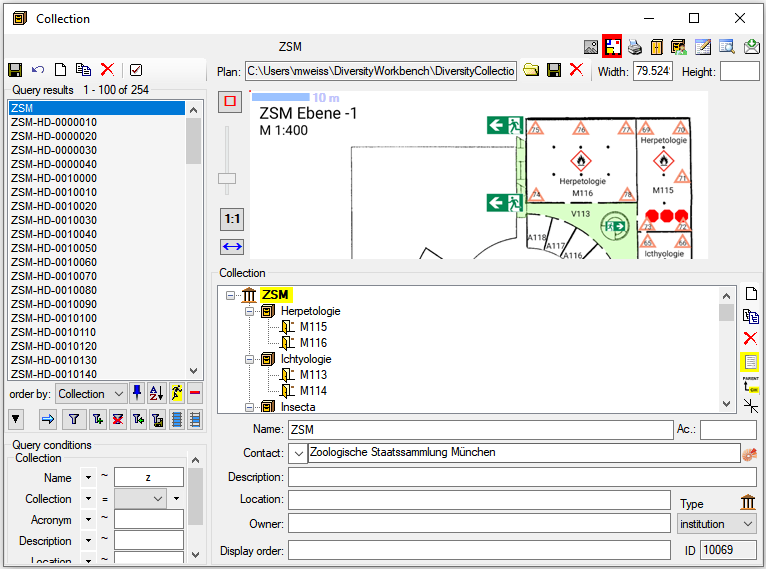
Geometry
To provide the geometry of a certain area within e.g. a drawer the same can be applied with an image of the drawer as plan. See chapter Setting the geometry below.
Parent geometry
The floor plans are inhertited to depending collections along the location hierarchy and the geometry of
a parent collection will be indicated by a dotted line  (see below). The administrative hierarchy is ignored concerning the inheritance of floor plan and geometries.
Height
The field Height keeps the height of e.g. a sensor for temperature.
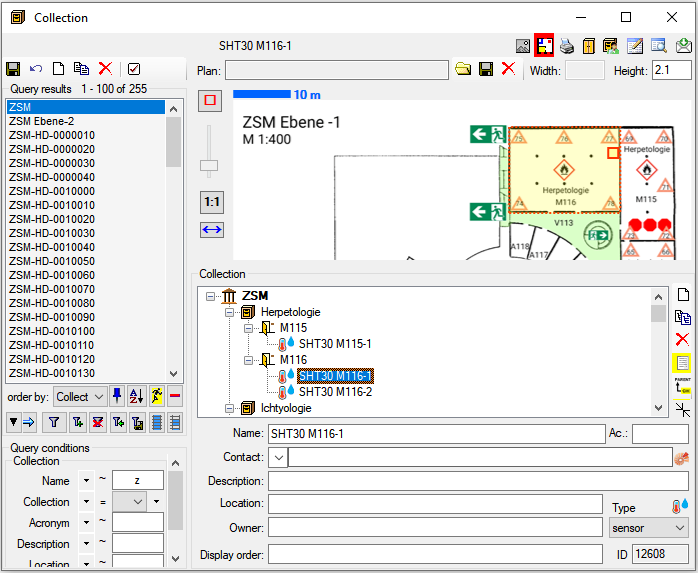
Besides floor plans you may as well specify certain positions within
e.g. a drawer (see below and the tutorial
).
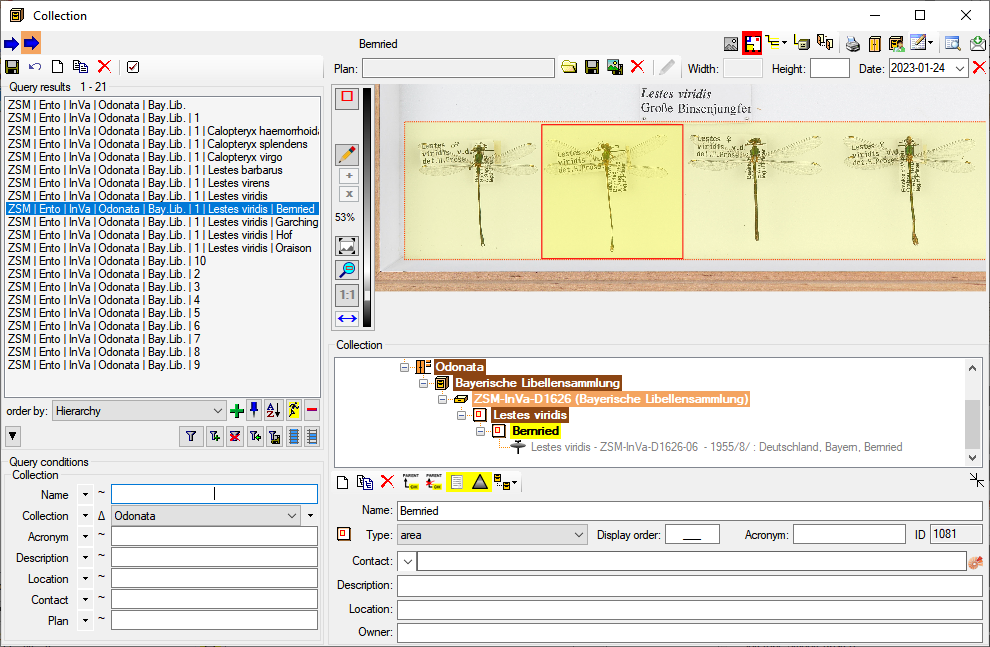
Child geometries
If geometries are defined for the child collections, these will be indicated with blue and a blue dotted line  as in the image below. The inheritance of the geometries is linked to the location hierarchy. The name of the subcollections are displayed in transparent blue .

Restriction of layers
To restrict the layers of geometries of the child collections that should be shown, choose → from the menu.
In the tab use the to restrict the levels, where 0 means no child collections should be displayed.
Restriction of access to files
The access to files on the server can be restricted with a .htaccess file within the directory.
An example for the content of the file is shown below
AuthType basic
AuthName "Protected Directory"
AuthUserFile /.htpasswd
AuthGroupFile /dev/null
Require valid-user
To allow users access to the directory these users must be listed in the .htpasswd file
Run the following command to create an .htpasswd file for a user (replace user1 with the desired username):
htpasswd -c /.htpasswd user1
Enter a password for user1. The encrypted password will be stored in the .htpasswd file.
Confirm that the .htpasswd file has permissions set to 644.
Setting the scale
To set the scale for a floor plan with a scale provided in the plan,
click on the button. A blue bar will appear that can be dragged and changed in length
to a object of known size, e.g. a scale in the plan. After the scale is
set, click on the save button and the floor plan will be
overlaid with the scale as shown above. The width of the whole plan will
be shown in field [Width].
Setting the geometry
To set the geometry of e.g. a room, click on
the button.
A red rectangle will appear as an overlay in the plan that can be
dragged into the right position.
The button removes the geometry from the current dataset. Click on the
button to store the geometry.
To edit the points within the geometry, click on the button in the upper menu bar of the plan. This will activate the Editing options of the plan. Click on the button at the left side of the plan. Now you can move points with the mouse. With the buttons + and x you can add resp. remove points from a geometry (see image below).
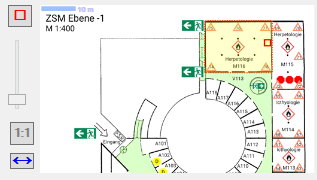
Zoom
To zoom the floor plan use the slider at the left or the mouse wheel. To
return to the original size with a click on the 1:1 button. If the current dataset has a geometry you can use the  button to zoom in the geometry.
With the button you can show the
whole image. With the slider you can set the zoom factor to any size between 10% and 400% with the zoom factor displayed in the menu left from the plan (see image above).
button to zoom in the geometry.
With the button you can show the
whole image. With the slider you can set the zoom factor to any size between 10% and 400% with the zoom factor displayed in the menu left from the plan (see image above).
Diversity Collection
External Identifier
External identifier  may be added for a
collection event, a
collection specimen, a
part of a collection specimen, an
organism (=
identification unit), a
reference or a
transaction. To add an external identifier, select
the entry it should be attached to and click on the
button. A window as shown below will open.
may be added for a
collection event, a
collection specimen, a
part of a collection specimen, an
organism (=
identification unit), a
reference or a
transaction. To add an external identifier, select
the entry it should be attached to and click on the
button. A window as shown below will open.
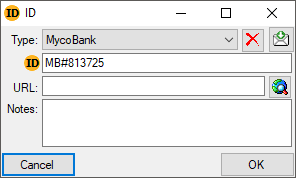
Select the type of the identifier, enter the identifier itself and close
the form to save the identifier. To remove an identifier use the
button.
To administrate the types of external identifiers choose
Administration - External identifier ... from
the menu. A window as shown below will open listing the available types.
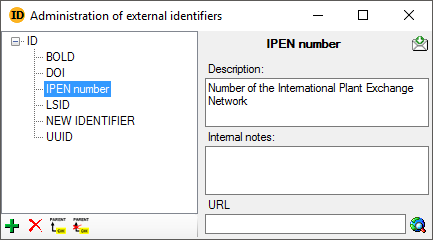
To add or remove a certain type, use the and
buttons. To edit the relations between the
identifiers use the resp.
button.
Data for the external identifiers are stored in the table
ExternalIdentifier. In an
upcoming version these data will be transferred into new tables
(Identifier, IdentifierForEvent etc.).
Diversity Collection
Regulations
Adding to event and part
As a first step the regulations resp. their title
must be added for the collection events either via the button or for several events in the maintenance.
Then you can select a specimen part
part and use the button to select a regulation from the list in the events.
graph TD;
    EventStart[Add regulation to collection event] --> |<i class="fas fa-globe"></i>| Button(For current collection event)
    EventStart --> Maintenance(For several collection events)
    Maintenance -->|<i class="fas fa-cog"></i>| MaintenanceRegulation[Maintenance - Regulations]
    Button --> Event[Collection event]
    Event --> Part[Add regulation to specimen part]
    MaintenanceRegulation --> Event
To add a regulation to a
specimen part, choose the part to which the
regulation should be added and click on the
button. A window as below will
open, listing all available regulations (see below) ...
Choose the regulation you want to insert and click OK. The
regulation will be inserted as shown below.
To remove any regulation use the delete button.
Documents
Depending on your permissions you can see the documents stored for a regulation when you select the regulation listed for the event.
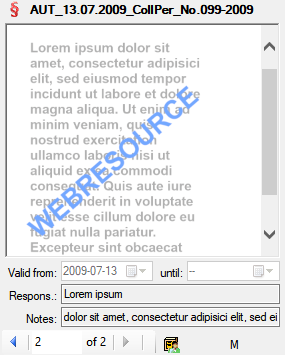
If you do not have the needed permissions, you will get a corresponding result as shown below.
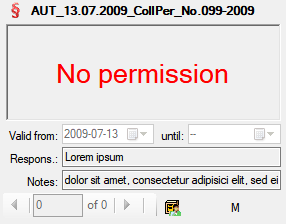
In case the selected reglulation contains no documents, this will be indicated as shown below.
Administration
To administrate the regulations choose Administration - Transaction
management - Transaction ... from the
menu. See chapter
Transaction for further details.
Datatables
The diagram below shows the tables involved in the regulations.
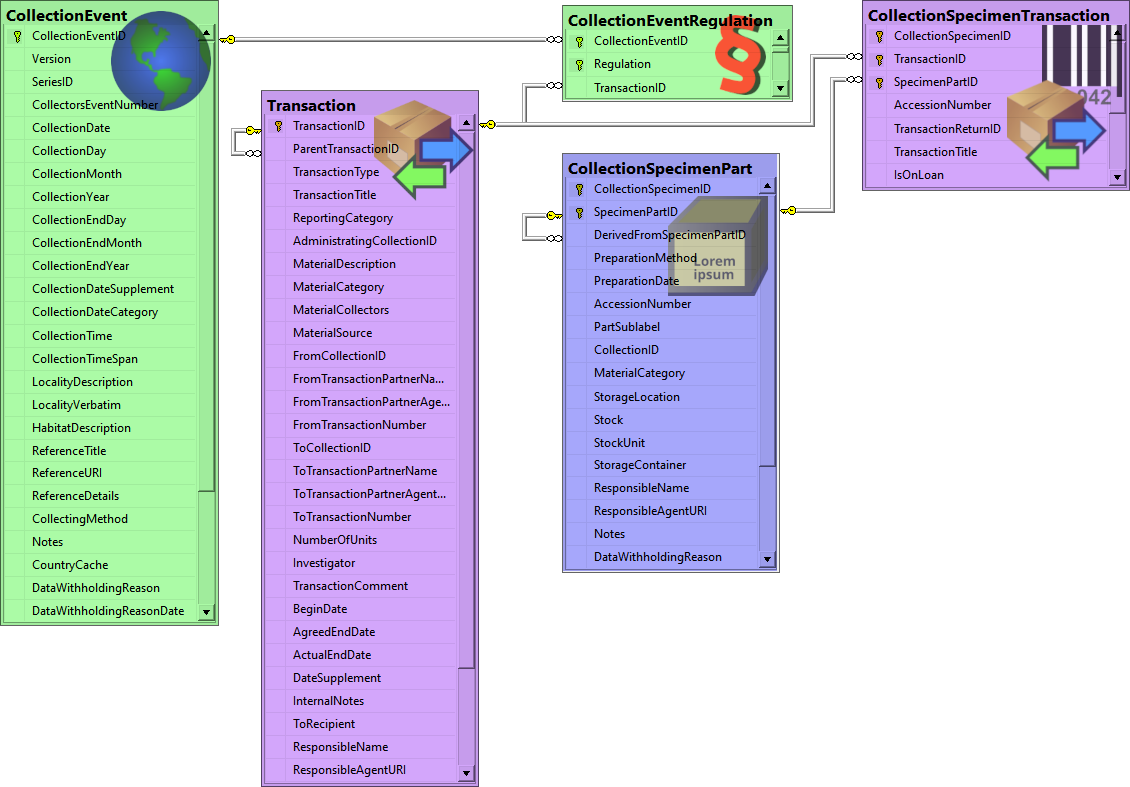
Diversity Collection
Transaction
Main sectors
The image below gives you an overview of the main sectors related to the transaction.
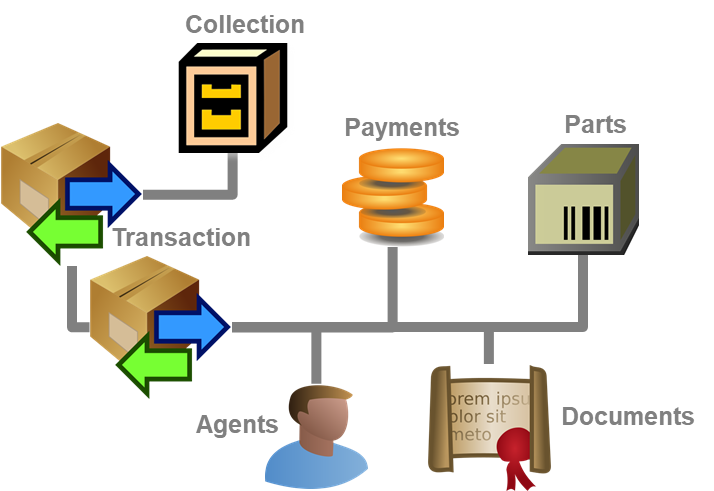
Prerequisites to use transactions
The transfer of a specimen between collections is handled with
transactions. There are two prerequisites to use transactions in
DiversityCollection. You are required to be in the user group
CollectionManager (see UserAdministration)
and the collections in which you have the right to handle transactions
must have been assigned to you is shown in the
CollectionManagers section.
Historical development
To create charts for the historical development see chapter
Charts.
Visibility of transactions
A specimen may be involved in diverse transactions between collections
like loan, purchase, gift or exchange. The transactions are shown in the
tree for the parts of a specimen and symbolized with e.g. an
icon. For specimens which are still on loan
an  icon is shown while a returned loan is
symbolized with an
icon is shown while a returned loan is
symbolized with an  icon (see image below). A
data embargo will be symbolized with an
icon (see image below). A
data embargo will be symbolized with an
 icon. If there are older accession numbers
linked to a specimen involved in a transaction, these numbers can be
documented together with the entry of the transaction of the respective
part of the specimen.
icon. If there are older accession numbers
linked to a specimen involved in a transaction, these numbers can be
documented together with the entry of the transaction of the respective
part of the specimen.
To customize the sequence and format of the transactions shown in the
tree, choose Administration → Customize display ... from the menu
and see the chapter customize for further details.
As an administrator you can edit and add entries to the Standard
comments for transactions click on the button
in the header.
For details see chapter customize.
If you are a CollectionManager, you may take a look at the details of a
transaction. Select the specimen part in the tree and click on the button which will be shown in the details
next to the name of the transaction. This will open the window for the
transactions as described below.
To edit the transactions choose Administration - Transactions from
the menu. A window will open as shown below. In the tree at the top the
relations between the transactions are shown. To create a transaction
dependent on another transaction choose the superior transaction in the
tree and click on the button in the panel right of
the tree. With the button you may create a copy of
a transaction. To delete a specimen from the list click on the delete button. To transfer all selected specimen in an
existing transaction choose Data → Transfer
→ To transaction... from the menu and
choose the transaction where the specimen with all their parts should be
included. In two following dialogs you may restrict the transferred
parts to a certain collection or material category. The data for the
transactions is stored in the tables
Transaction and
CollectionSpecimenTransaction.
The ID of the transaction is shown in the header. Behind the ID the
maintenance button may
appear in case of missing units in parts which e.g. for the creation of
sending letters may cause unexpected results. Click on the maintenance button to
open the maintenance for fixing this problem. With the feedback button you can
send a feedback to the software developer. To view the history of a data
set click on the
history button. A window
with the history will open. For more details see the section
History.
The settings
button will open the settings for the transaction. The edit table button opens a table
editor for the selected transactions. For large
hierarchies the retrieval from the database may be time consuming. To
hide the hierarchy use the  botton resp.
to show the hierarchy. The list for the
specimen may be shown or hidden
.
botton resp.
to show the hierarchy. The list for the
specimen may be shown or hidden
.
Data entry
On this page you may edit the data of a transaction. Every transaction
is linked to an administrating collection (symbolized by the key
 ) and can be edited exclusively by
CollectionManagers of this collection. To
appoint managers choose Administration - Managers from the
menu.
) and can be edited exclusively by
CollectionManagers of this collection. To
appoint managers choose Administration - Managers from the
menu.
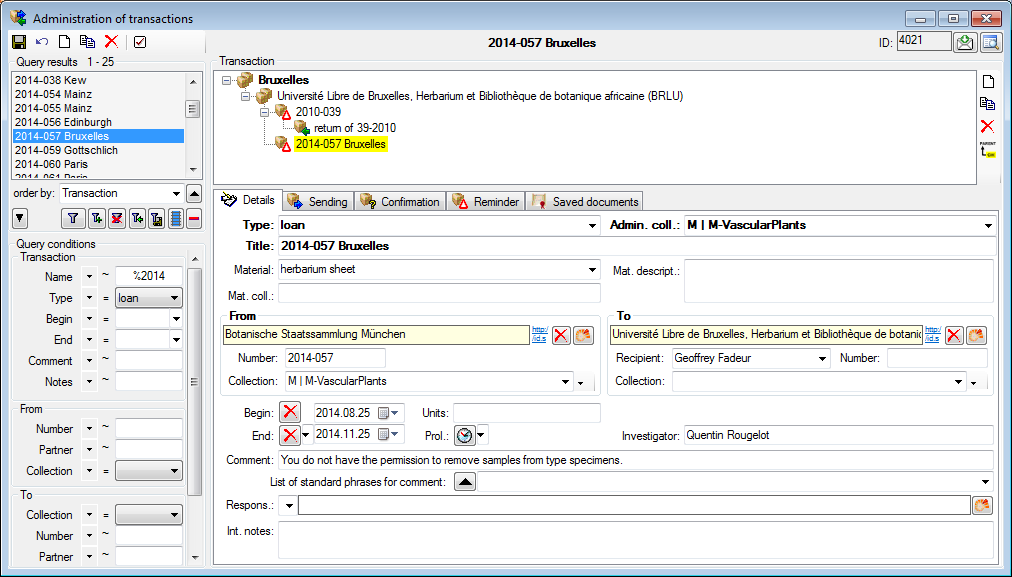
The transactions can be organized in a hierarchy as shown in the image
above, if e.g. you wish to keep together all loans to a certain
institution. To create a transaction of an inferior transaction choose
the superior transaction in the tree and click on the button in the panel at the right side of the tree.
To create of copy of a transaction, use the button
and the delete button to delete it. If you want to
change the position within the hierarchy, select the transaction and
click on the button. A window will open where
you can select the new parent. Depending on the type of transaction you
have up to 3 dates, e.g. for a loan you have a begin date, an end date
and in case of a prolongation an end date of the prolongation.
There are the following types of
transaction:
| Transaction type |
Description |
| embargo |
Temporary data embargo for specimen that should not be published within the specified period |
 exchange exchange |
the exchange of specimens between institutions |
 gift gift |
the gift of specimens to an institution |
 inventory inventory |
the inventory of specimens within an institution |
| loan |
the loan of specimens of an institution to an external loan taker |
 permanent loan permanent loan |
permanent loan of specimens of an institution to an external loan taker |
 permit permit |
permit or certificate for the collection of specimen |
 purchase purchase |
the purchase of specimen by an institution |
| regulation |
a regulation concerning a specimen in a collection |
 removal removal |
a removal of a specimen from a collection |
 return return |
a complete or partial return of a loan |
 transaction group transaction group |
an entry to organize your transactions |
The fields display in the Details tab will vary with the type of
the transaction as e.g. an embargo does not need any address
information. For the addresses use the links to the module
DiversityAgents as shown in the image above. You may optionally enter a
collection and the program will then use the corresponding address as
described below. As the recipient of e.g. a loan may not be entered in
DiversityAgents, you can enter the name of the person directly in the
To-address. The use of the collection as a reference in the From
and To section is deprecated. Please use a link to the module
DiversityAgents instead. If you need these controls please open the
settings and select the
Show all address fields
option.
Common notes
On the tab pages for generating documents you need to specify a
xml-schema for your document. Click on the open button
to choose one of the predefined schemas or create your own. To edit the
schema files (*.xslt) you may use a text editor or software like e.g.
EditiX. If you do not specify a schema for
your form (i.e. the field for the path of the schema is empty - see
below), you will see the XML output created by the database as shown
below.
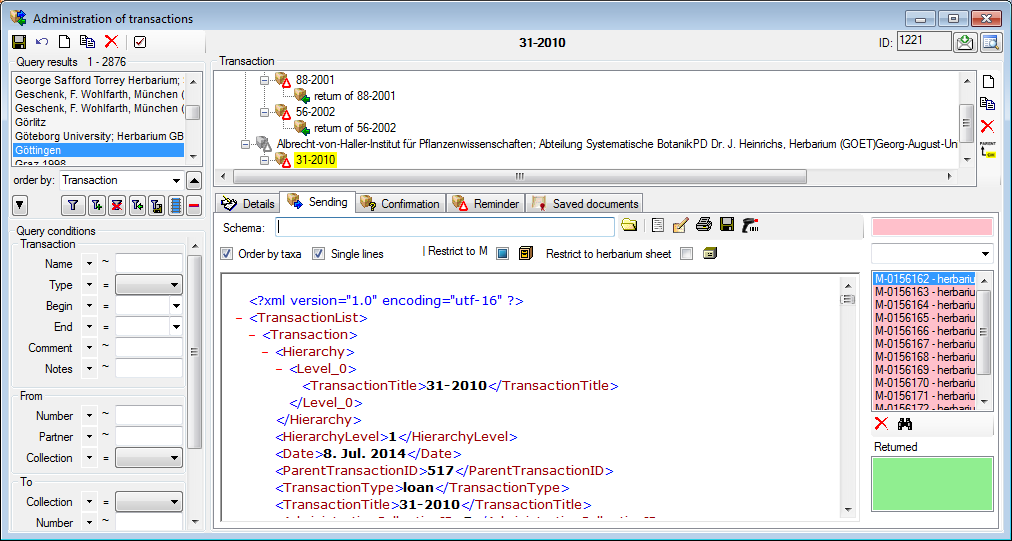
To choose a schema click on the open button and select
a schema from the list. DiversityCollection contains several ready to
use schemas in the folder Transaction - Schemas - Sending.
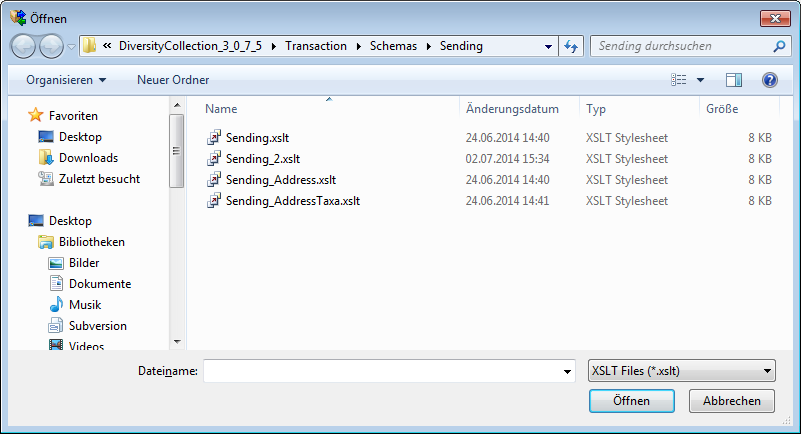
Feel free to change these schemas according to your own needs (editors
are available e.g. from http://www.altova.com/). Choose the schema you
need and click on the  button to
create a document. To print the document use the printer button. To store the current document for
later reference in Documents click on the save button.
An example for a document is shown
below.
button to
create a document. To print the document use the printer button. To store the current document for
later reference in Documents click on the save button.
An example for a document is shown
below.
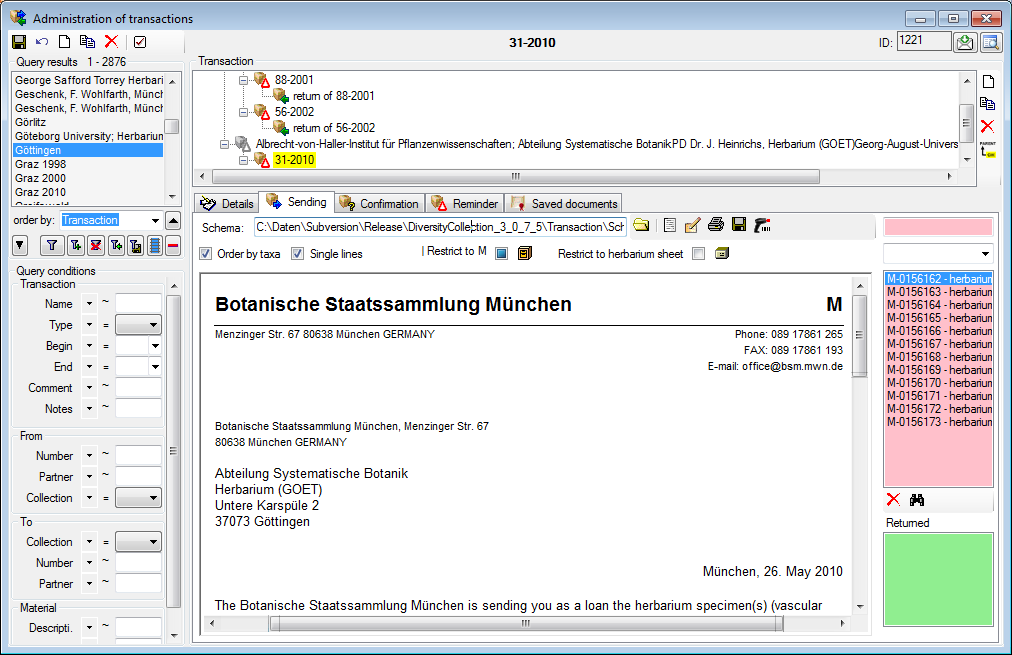
Sending list
The specimens will be listed with their accession number, an optional label of the part, the material category and if available the country and the collection year to ensure discrimination in case a specimen contains more than one part. If available a permit will be shown at the last position (see image below).
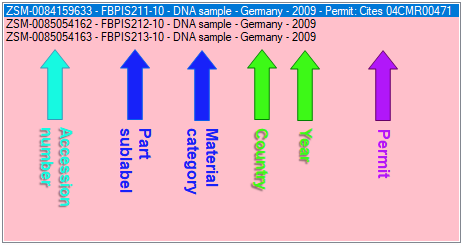
In the sending list - to see the details of a permit - click on the line containing the permit. The details will for the permit will be shown as in the example below.
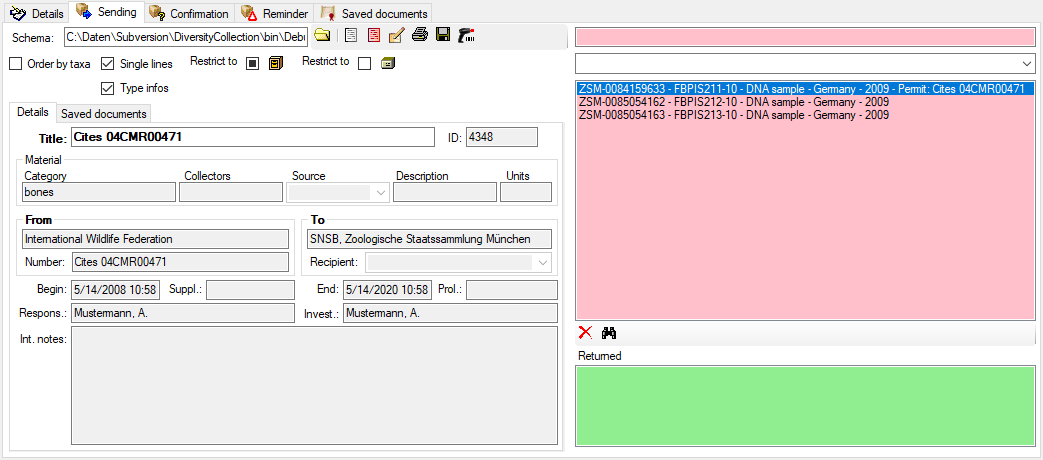
Finding addresses
The addresses used for the documents are taken from the module
DiversityAgents, where addresses are stored. Therefore the entries must
at some point be linked to an entry in this module. The program will try
to find an address as shown below: First the transaction partners
(from ... and to ...) will be checked. If no address is
available (e.g. if the transaction partner is not linked to an entry in
DiversityAgents), the program will try to find an address in one of the
superior transactions from the transaction partners found there. If no
address exists in these transactions, the program will try to get an
address from the collections. Therefore, a transaction partner linked to
DiversityAgents is only necessary if either there are no addresses for
the collections or you wish to use a different address. The search path
as described is summarized in the image below.
No Access
If the data contain datasets, where you have no access to, this will be
indicated as shown below.
The access to the data rely on the result of the view TransactionList,
combining the transactions with missing administrating collection and
those where the current user is a member of the group CollectionManager
with allowance for the collection where the transaction is
administrated. Transactions within a hierarchy to which the user has no
access will be displayed with gray titles.
Subsections of Transaction
Diversity Collection
Transaction Loan
The Loan Transaction section of DiversityCollection provides a solution for managing and documenting all aspects of loaned objects. This feature enables you to handle every stage of the loan process.
To get an overview of the basic functions you can also have a look at the Best Practice - Loan management chapter .
Within the Loan Transactions, you can:
- Create and manage new loans.
- Use customisable letter templates, including loan slips, reminders, dunning letters, acknowledgements of receipt and more.
- Record and track forwarded items.
- Manage returns and document any damage for future reference.
- Generate statistics to analyse loan activity.
Involved Modules of the DiversityWorkbench framework are:
Loans of specimen from a collection are documented with the transaction
type loan (see below).
Prerequisites
- DiversityAgents: The institution/lender and the borrowing institution must both be managed in DiversityAgents and must have address information stored there. The address information is used for creating letters, etc. For information on creating a new institution or person in DiversityAgents, see the chapter Add a new Instituition/Agent of the DiversityAgents module. For information on adding an institution’s address information, see the chapter Contact Data.
- DiversityCollection: Unlike other data, user authorisations for loans are not only managed via projects but also via assignment to collections. A prerequisite for processing loans is having the role of CollectionManager or Administrator. This means the user handling the loans must have the role CollectionManager or Administrator for the collection whose objects are being loaned. In addition to the authorization for the collection, the user must also have authorization for the project to which the items to be borrowed belong.
For more information on rights management in DiversityCollection see the
chapter Rights management.
For more information on handling collections in DiversityCollection, see the Collection chapter.
Loan Transaction User Interface
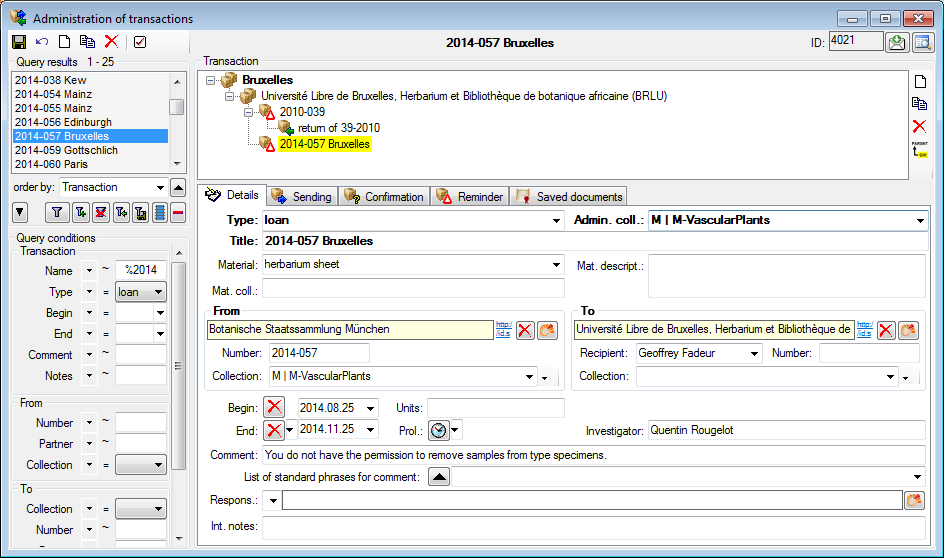
For a loan granted to a loan taker, create a new transaction and set its
type to loan. The loan needs an administrating collection, which is the
collection in which the specimen included in the loan are located and
for which the current user is registrated as collectionmanager . The
addresses are entered as links to
DiversityAgents
in the From and To areas. The To area provides a recipient
for inclusion in the address. The collections in the From and To area
may be used optionally as source of the address. The Begin and
End fields mark the time span for the loan. If the time of the loan
should be prolonged, use the Prol.: field to enter the new end date.
Standard comments can be edited (Admin only) in the
Customize section. In the
 Sending,
 Confirmation and
Reminder sections you can create documents
for the communication with the loan taker. Documents as sent to or
received from the loan taker are available in the
Confirmation and
Reminder sections you can create documents
for the communication with the loan taker. Documents as sent to or
received from the loan taker are available in the
 Saved documents
section. If after the end of the loan all or a part of the specimen are
returned, create a Return transaction as child
of the loan (see image above) and include all returned specimen in this
return transaction.
Saved documents
section. If after the end of the loan all or a part of the specimen are
returned, create a Return transaction as child
of the loan (see image above) and include all returned specimen in this
return transaction.
Subsections of Loan
Diversity Collection
Transaction Sending
In the sending tab page of the transaction window you can create the
covering note for a sent sample.
To choose a
schema click on the open button and select a schema from
the list. DiversityCollection contains several ready to use schemas in
the folder Transaction - Schemas.
To add a specimen to the list, you can use a  barcode scanner. The code detected by the scanner will be displayed in
the field behind the symbol and entered in the list below. If no
scanner or barcode is available, use the combobox underneath, enter the
first letters of the accession number of the specimen and select your
specimen from the drop down list. In case your scanner is reading only
parts of the barcode try to adjust the timer interval - click on the scanner button to open a window as shown
below.
barcode scanner. The code detected by the scanner will be displayed in
the field behind the symbol and entered in the list below. If no
scanner or barcode is available, use the combobox underneath, enter the
first letters of the accession number of the specimen and select your
specimen from the drop down list. In case your scanner is reading only
parts of the barcode try to adjust the timer interval - click on the scanner button to open a window as shown
below.
To restrict the selection of the specimens and parts of the specimens,
you can check the Restrict to collection ... and Restrict to material ... options. To remove a specimen from the list, use the delete button under the specimen list. If you want to
see the details of a specimen, choose it in the list and click on the button. Click on the
scanner button to create the document as
shown below. The upper list shows
the parts on loan while the parts in lower
list are returned to another institution. For more
details about the upper list see chapter
transaction.
Units
If you need to include the units in the covering letter, choose the option . This will include all units linked to the parts in the generated xml. To include these data in the covering letter, the schema has to be adopted as shown a short video:
Diversity Collection
Transaction Confirmation
On this page you may create an inquiry letter for a package sent, e.g.
if a parcel was sent to a loan taker and no confirmation that the parcel
reached its destination was returned so far.
With the open button choose the schema you need. Click
on the button to create a document.
To print the document use the button. To
store the current document for later reference in Documents click on the save button.
Diversity Collection
Transaction Forwarding
Specimen on loan may be forwarded to another institution. A forwarding
can only be part of a loan. Select the loan of which the specimens
should be forwarded and add a new transaction as a child of the loan.
Then set the type of this new transaction to forwarding as transaction
type.
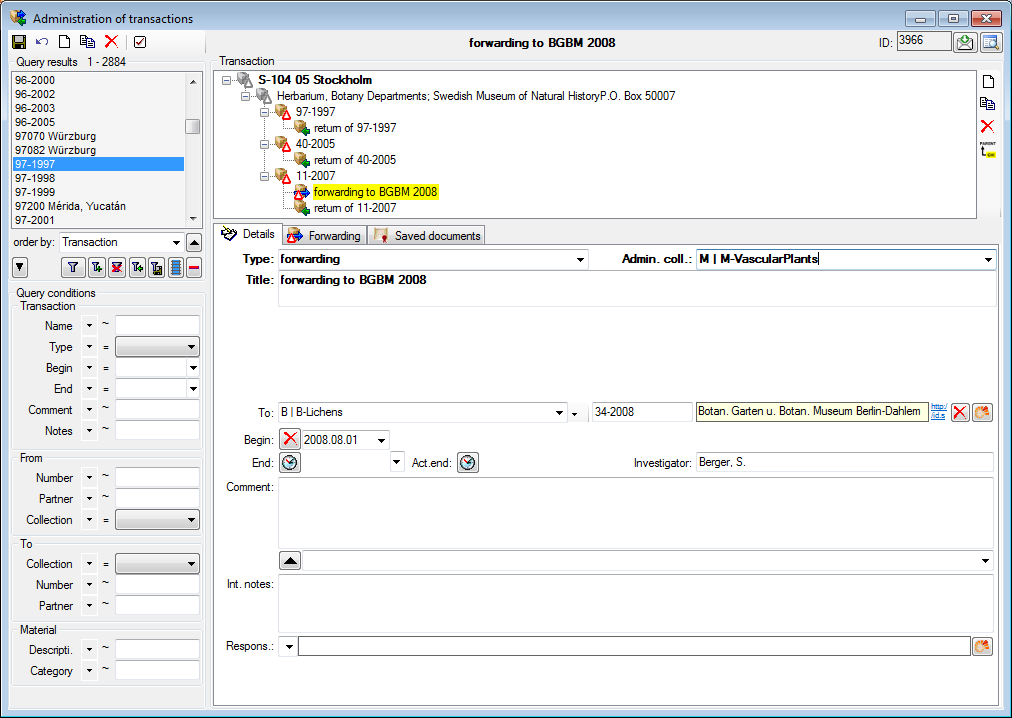
... and use the button to move the selected
specimen from the initial loan into
the list of forwarded items (see
below).
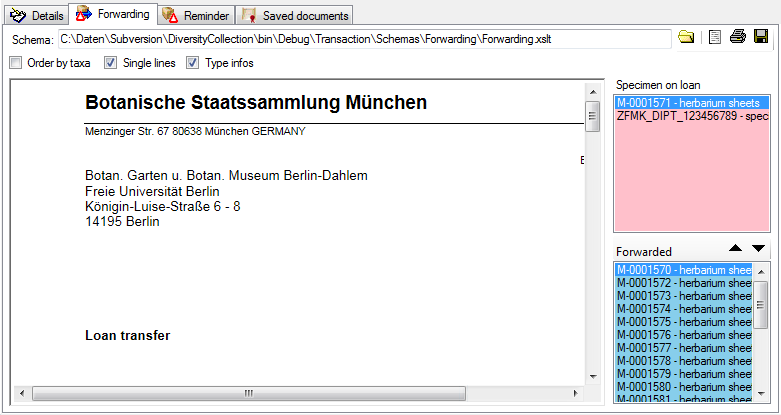
Diversity Collection
Transaction Reminder
If a loan or forwarding is due to return or a loan taker did not meet
the deadline, you may create a prompt note here.
With the open button choose the schema you need. Click
on the button to create a document.
To print the document use the button. To
store the current document for later reference in Documents click on the save button.
In the upper right list the missing
specimen and at the lower right list the returned specimen are listed.
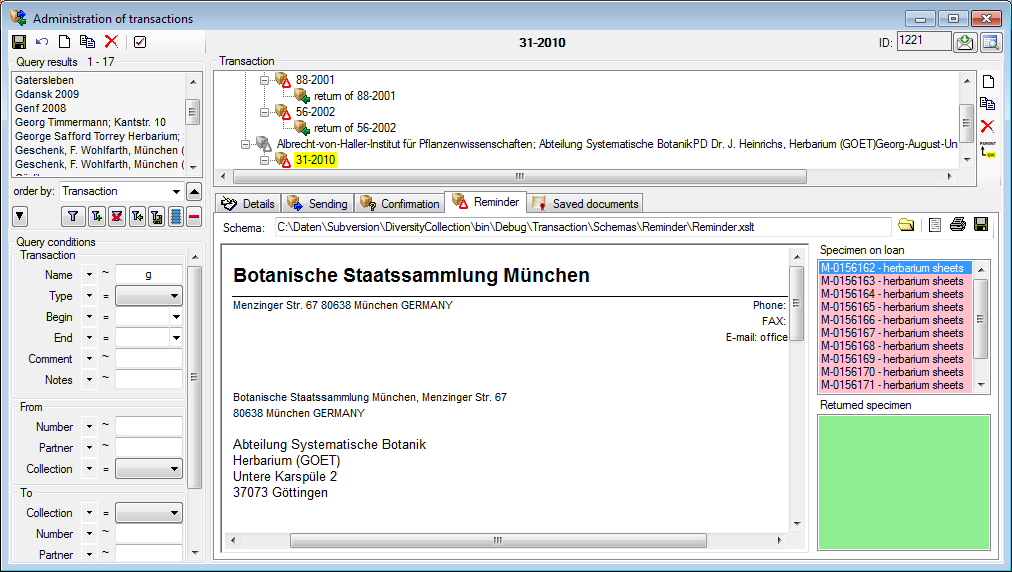
Diversity Collection
Transaction Return
If a loan is returned, a child transaction of the
type return is created, containing the
returned items of the superior transaction. To do this, choose the loan
in the tree and add a new transaction as child as
shown below. Then set the type of this new transaction to
return.
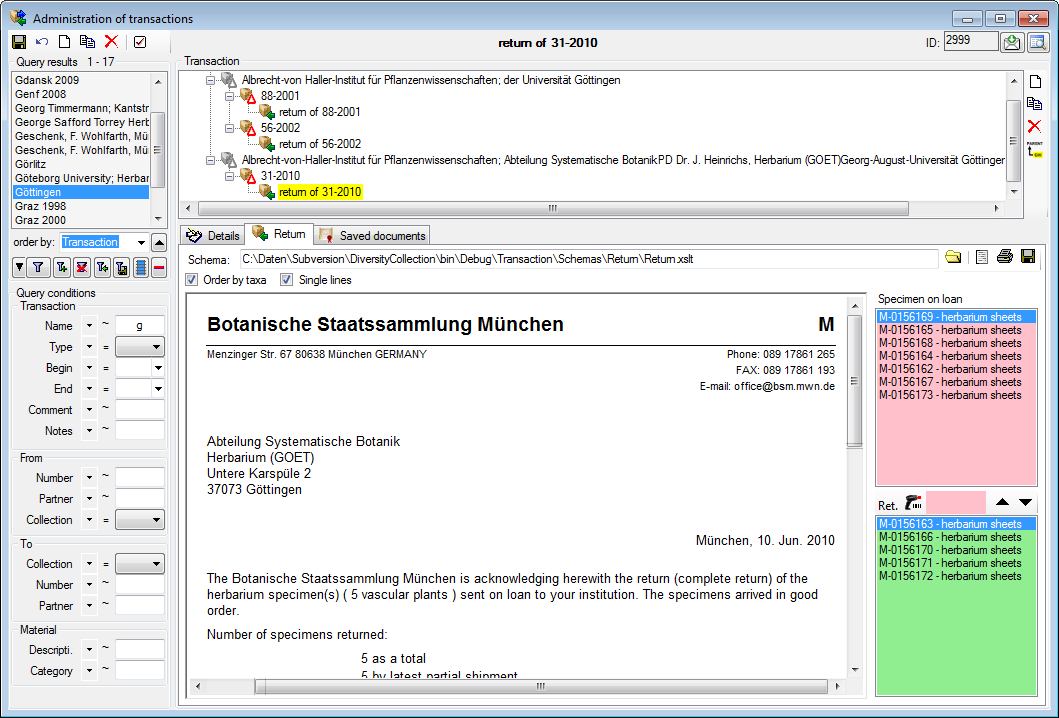
The state of the specimen will always be kept with the loan and you can
add return incidents as long as there are specimens on loan. A return
incident can only be part of a loan transaction. To
transfer items into the return transaction, you have two options: can
mark the items in the [loan list]that should be transferred and click on the button
or click into the [text field] rightof the icon and use a barcode scanner. To remove
an item of the return list, mark it in the [list of returned
items] and click on the button.
To you may create a notice of arrival here. With the open button choose the schema you need. Click on the
button to create a document. To print
the document use the button. To store the
current document for later reference in Documents click on the save button.
Diversity Collection
Transaction
Request
There are 2 ways to enter a request for a loan.
- You are a CollectionManager and want to insert a foreign request. This request may be the starting point of a loan. To add a corresponding loan to the request, choose the request in the hierarchy and click on the copy botton. A loan depending on the
 request will be added.
- You want to place your own request in a collection. In this case you must be granted the role Requester (see Loginadministration for further details). The grants are given by the CollectionManagers for their collections. To enable a user
to place requests choose Administration - Transaction management -
 Loan requesters ... from the menu. A window
will open as shown below.
Loan requesters ... from the menu. A window
will open as shown below.
As a CollectionManager you may give requesters access to the
collections you manage. Click on the < or
> button to add or remove collections from the
list for which a user may place a request. If the option Include subcollections is chosen, a user is able to request specimens stored in subcollections of the administrating collection. To give you an
overview of the subcollections the hierarchy of the collection is shown in the tree below the list.
If you are a CollectionManager and there are requests for your
collections, the administration menu will contain a
Loan requests ... entry. Choose it in
order to open a window listing the requests for specimen in your
collections.
If you have entered a request for specimen in a foreign collection, the
administration menu will contain a  My requests... entry. To inspect your request choose this entry from the menu to open a window as shown below. The window will show your requests
and loans from foreign collections.
My requests... entry. To inspect your request choose this entry from the menu to open a window as shown below. The window will show your requests
and loans from foreign collections.
To enter a new request click on the button. Use the button to search for specimen in the collection and
the delete button to remove unwanted specimen from your
list.
Diversity Collection
Transaction Printing
In addition to special pages for creating letters along with a loan,
this page provides the possibility to print cover letters, inventories
etc. You may restrict the selected specimen to the current collection,
include subcollections or all related collections - simply activate the
corresponding checkboxes.
To add a specimen to the list you may either use the combobox or a
barcode scanner. To use the barcode scanner move your mouse cursor into
the pink field on the right of the scanner. In case your scanner is
reading only parts of the barcode, try to adjust the timer interval.
Click on the button to open a window where you
may set the timer interval to a different value. To remove a specimen
from the list select it and click on the delete button.
With the open button choose the schema you need. Click
on the button to create a preview of
the document. To print the document use the
button. To store the current document for later reference in Documents
click on the save button.
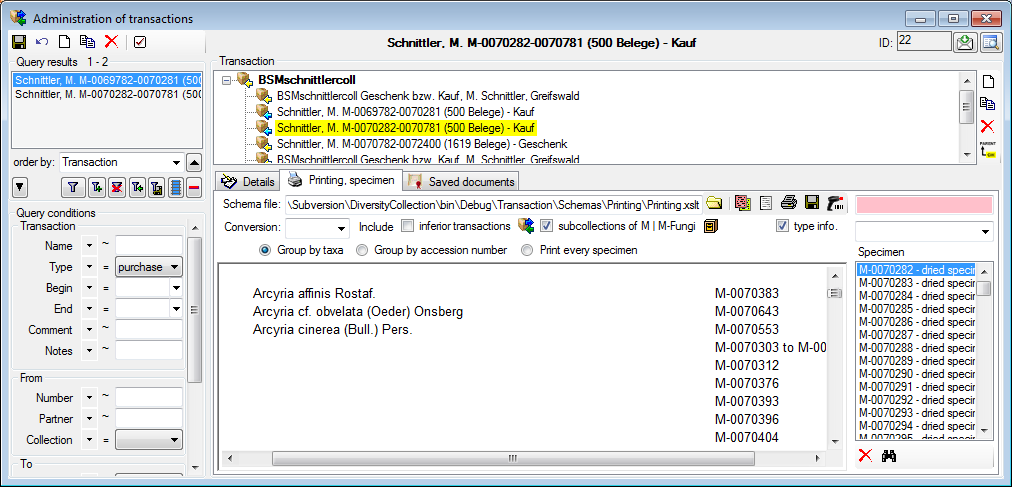
Diversity Collection
The page Saved documents stores all the
documents created or received along with a transaction. A display text
is automatically generated containing the type of the transaction and
the date. You may change this if you prefer a different text.
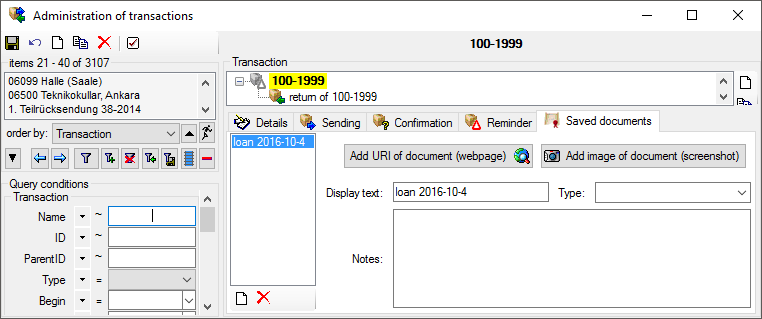
To add a document either use the save button after
creating a preview of a letter e.g. for Sending .
Next to the internal documents created within the program, you can
include external documents. You may scan an external document and create
a screenshot of it. Then create a new entry (click on
the new button) and use one of these options: Add URI
of document or  Add image of document.
The first option uses public available sources from a webserver while
with the second option later screenshots will be stored directly in the
database and are not accessible outside the database. If you want to
print the document, double click on the image to open a window enabling
the printing of the document . For the first option
you may use the
Add image of document.
The first option uses public available sources from a webserver while
with the second option later screenshots will be stored directly in the
database and are not accessible outside the database. If you want to
print the document, double click on the image to open a window enabling
the printing of the document . For the first option
you may use the
 “https://…”
button to search for an
URL in your default browser instead of the inbuilt browser of the
software which may not provide the whole functionality of a modern
browser.
“https://…”
button to search for an
URL in your default browser instead of the inbuilt browser of the
software which may not provide the whole functionality of a modern
browser.
In the lower part you may enter the text that should be shown in the
interface (Display text), the type and notes related to the document.
With the type you may organize your documents as needed.
Dependent on the software installed on your local computer, pdf files
may open in the program or the default browser installed on your
computer. To avoid the automatic opening of these files deselect the
 option and use the
button of open them.
option and use the
button of open them.
Diversity Collection
Transaction Balance
This is the balance for the exchange between two collections.
With the open button choose the schema you need. Click
on the button to create a document.
To print the document use the button. To
store the current document for later reference in Documents click on the save button. To include either the subcollections of any
related collection or the collections of the current transaction select
the corresponding checkboxes.
Diversity Collection
Transaction Permit
Permits for collecting specimen parts are documented with the
transaction type permit (see below).
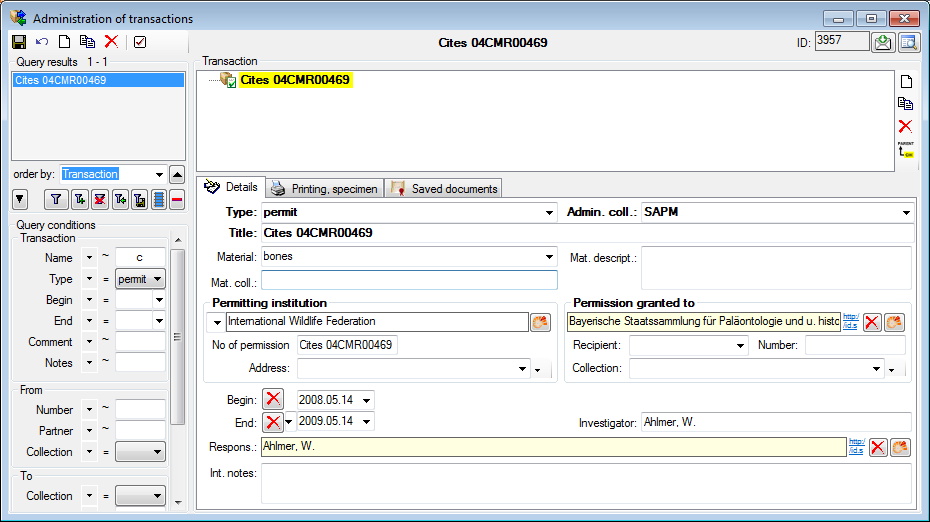
Documents as received by the permitting institution can be entered under
Saved documents (see below).
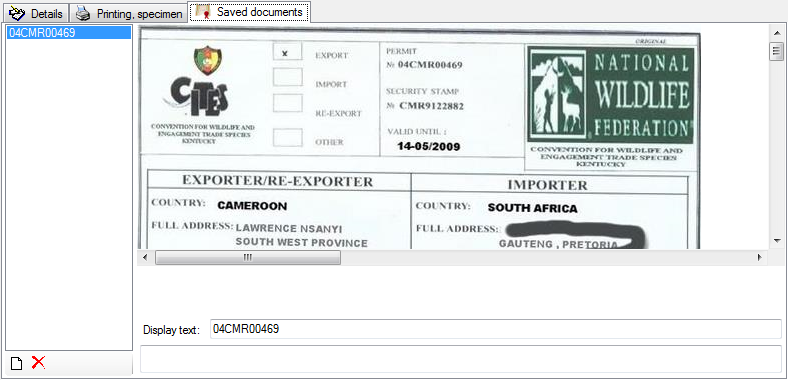
To add a permit to a
specimen part, choose the part to which the
regulation should be added and click on the button. A window will open as shown
below where you can select the permit you want to insert.
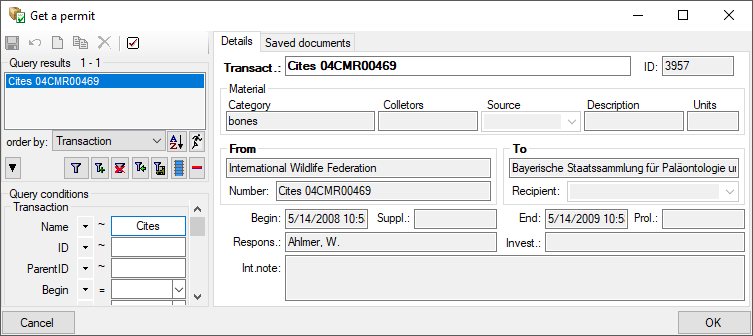
In the main window, click on the permit to see the details as shown
below. The details of a permit will as well be shown for datasets in a
sending list for a loan (see chapter
Transaction).
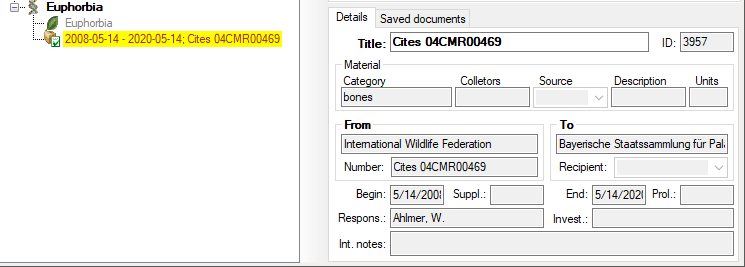
Diversity Collection
Transaction Regulation
To administrate the regulations choose Administration - Transaction
management - Transaction ... from the
menu. A window as shown below will open where the you can administrate
and create regulations (see below).
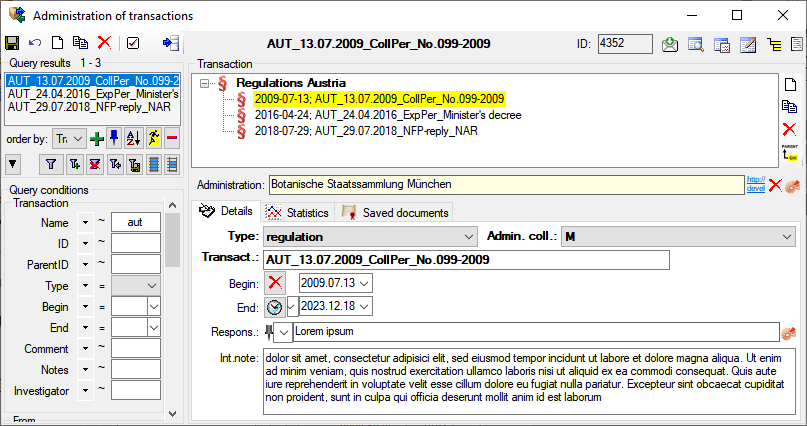
Documents can be added as e.g. screenshots or webresources. See below and for further details the chapter Transaction - Documents
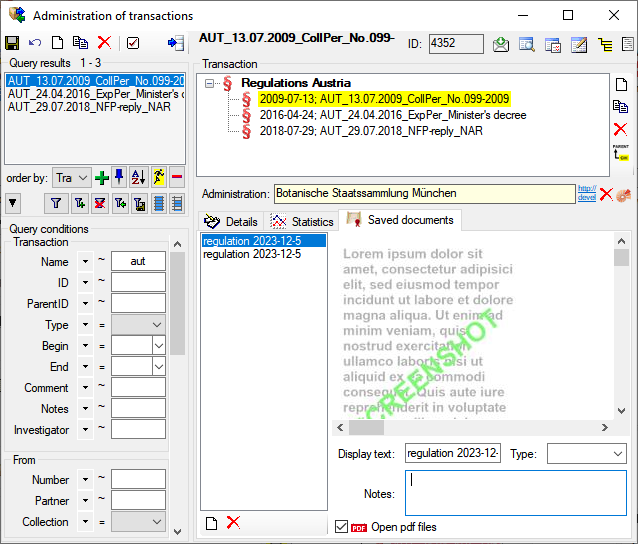
Diversity Collection
Transaction Removal
If specimens were removed from a collection e.g. by destruction or loss,
you can create a transaction of the type removal and add parts of the
specimen in question to this removal. If a specimen is part of a
removal, it is shown as in the image
below.
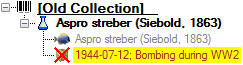
To create a removal choose Administration → Transaction management
→ Transaction from the menu, create a new transaction and choose the
type removal for the new transaction (see below).
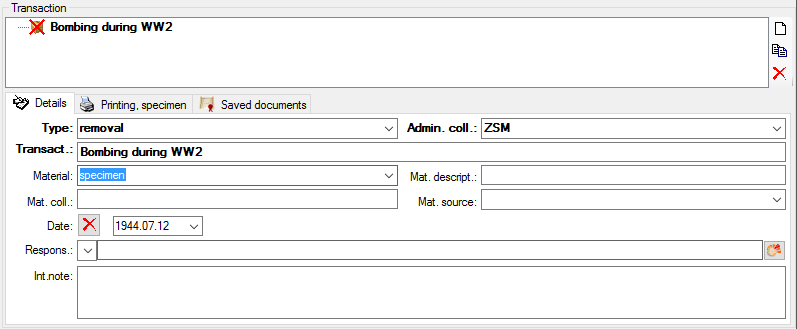
Diversity Collection
Transaction Embargo
If specimens should not be published for a certain period, you are able
to create a transaction of the type embargo and add parts of the
specimen in question to this embargo. If a specimen is part of an
embargo, it is shown as in the image below for current
and past or future embargos
 .
.
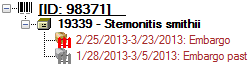
To create an embargo choose Administration → Transaction management
→ Transaction from the menu, create a new transaction and choose the
type embargo for the new transaction. The period of the embargo is
defined by its Beginning and End (see below).
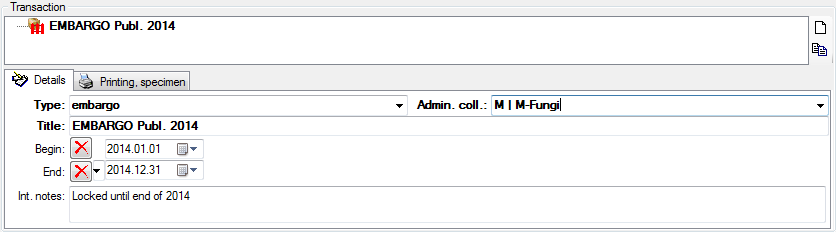
To see the parts of a specimen that where selected and are included in
an embargo choose Administration → Withhold
data... from the menu.
Diversity Collection
Transaction Identifier
The page Identifier stores any additional
identifier related to the transaction (see below).
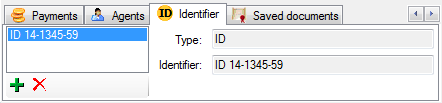
For the administration of the types of identifiers see chapter
External identifier.
Diversity Collection
Transaction Payment
The page  Payments stores any payment within
the transaction. To set the default currency (only dbo), choose
Administration - Customize display from the menu. In the
Transaction area use the Currency button
to set the default currency for all payments. This is done with the
setup of the database and can not be changed after any payment has been
entered.
Payments stores any payment within
the transaction. To set the default currency (only dbo), choose
Administration - Customize display from the menu. In the
Transaction area use the Currency button
to set the default currency for all payments. This is done with the
setup of the database and can not be changed after any payment has been
entered.
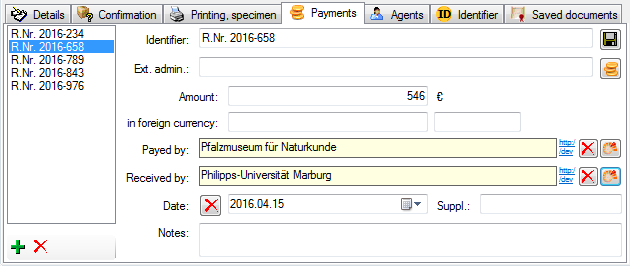
To add or remove payments use the and
buttons. To set default currency for all payments
in the database choose Administration - Customize display... from
the menu and in the opening window the section Transaction (see
chapter Customize).
Diversity Collection
Transaction Agent
The page Agents stores additional agents
involved in the transaction (see image below) that are not recorded
otherwise.
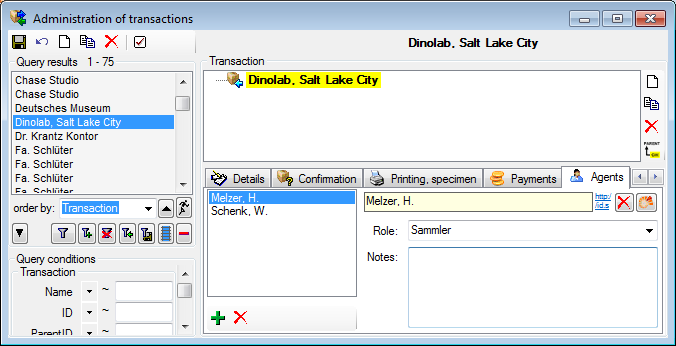
Diversity Collection
Transaction Chart
The page  Chart provides the option to create
charts for the historical development of transactions (see image
below).
Chart provides the option to create
charts for the historical development of transactions (see image
below).
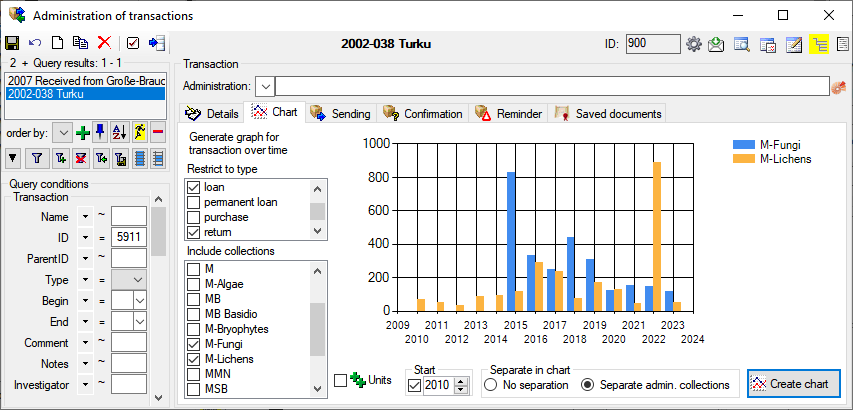
A direct access is available via the menu: Administration -
Transaction management -
Statistics.
Diversity Collection
Transaction
Customizing
As an administrator you can add entries to the Standard comments for
transactions (see above) that are used to enter standard phrases into
the comment field of a transaction (see below).
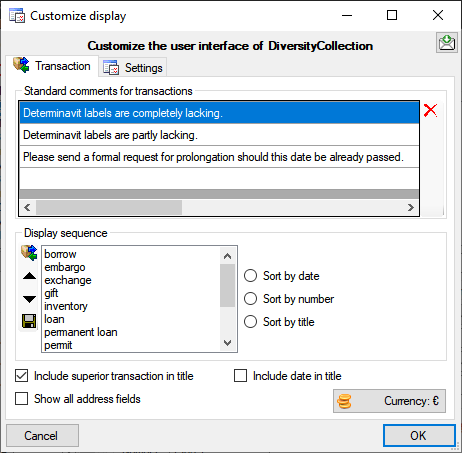
Transaction display sequence
To customize the sequence and format of the transactions shown in the
tree, choose Administration → Customize display … from the menu
and then select the part Transaction. If you want to change
the default sequence and/or display type, click on the button. Use the and
buttons to change the position of a certain type of
transaction and choose one of the display types (see above). To reset these settings
to the database default, use the button.
Title options
- Include superior transaction in title:
If your transactions are organized within a hierarchy, you can include the
titles of the superior hierarchies with this
option.
- Include date in title:
If the title should include the date, you can choose this
option.
Address field
The address fields are displayed depending on the type of the transaction. If you need all address fields, choose the option Show all address fields.
Default currency
The default currency for all transaction payments in the database is
Euro (€). To change the default currency click on the Currency button. A Window will open where you can enter the symbol for the default currency.
Diversity Collection
Templates for data
For several ranges in the data, you can define templates which can than
be copied into the data. To define the template, click on the button. A window as shown below will
open, where you can enter the data for the template.
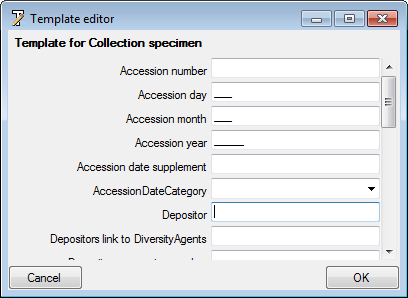
Use the save button to save changes in the template, the delete button to clear all entries and the copy options to take values from the data into the
template. With the filling option  you can
decide in which way values from the template are written into the data.
This option can be set as well under the menu Administration -
Customize display and then Defaults and miscellaneous - Template (see
below).
you can
decide in which way values from the template are written into the data.
This option can be set as well under the menu Administration -
Customize display and then Defaults and miscellaneous - Template (see
below).

There are 3 possibilities:
- Copy values from the template only if there are no entries in the
data
- Ask the user if there are differing contents in data and template
whether the template values should be copied into the data
- Copy the values from the template irrespective of any content in the
data
To copy the values defined in the template into your data just click on
the button.
In case you select that the program should ask (see above), a window as
shown below will open where you have to select those entries from the
template that should be copies into the data. Use the buttons
all resp. none to
select resp. deselect all columns.
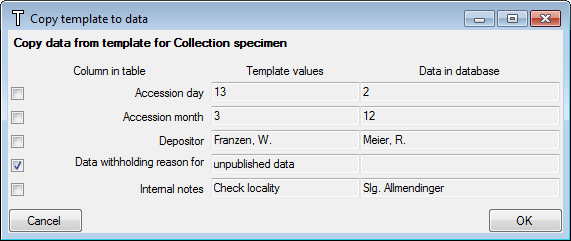
Diversity Collection
Task
Main sectors
The image below gives you an overview of the main sectors related to the tasks.
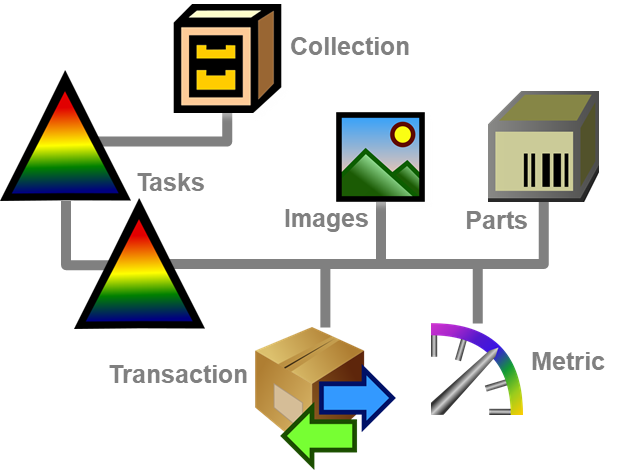
Tasks are used for example to organize IMP within a
collection. The tasks possible for a collection are defined within the
table Task. The tables related to tasks within a collection are shown in
the diagramm below. The table  Task contains the
definitions for the tasks. The tables
Task contains the
definitions for the tasks. The tables  TaskResult and TaskModule contain
predefined list for results resp. links to a DiversityWorkbench module.
Types for the tasks are defined in the table
TaskType_Enum. The table
TaskResult and TaskModule contain
predefined list for results resp. links to a DiversityWorkbench module.
Types for the tasks are defined in the table
TaskType_Enum. The table
 CollectionTask finally contains the
tasks for a collection, the table
CollectionTaskMetric numeric values collected e.g. by a sensor and
the table CollectionTaskImage holding any
related resources like images.
CollectionTask finally contains the
tasks for a collection, the table
CollectionTaskMetric numeric values collected e.g. by a sensor and
the table CollectionTaskImage holding any
related resources like images.
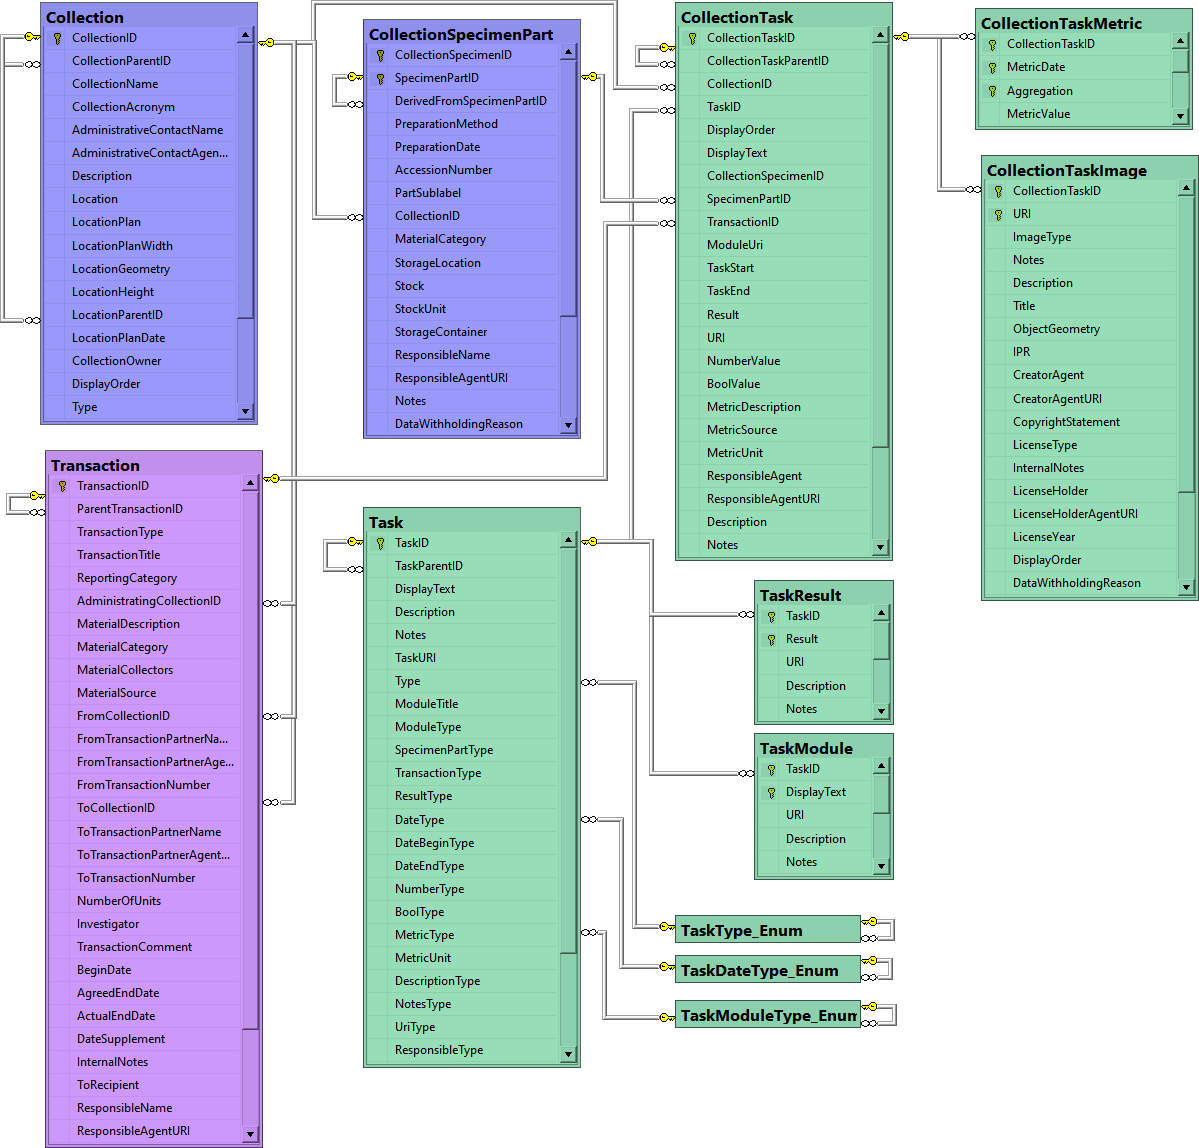
To define tasks, choose Administration -
Task from the menu. A window as shown below will open.
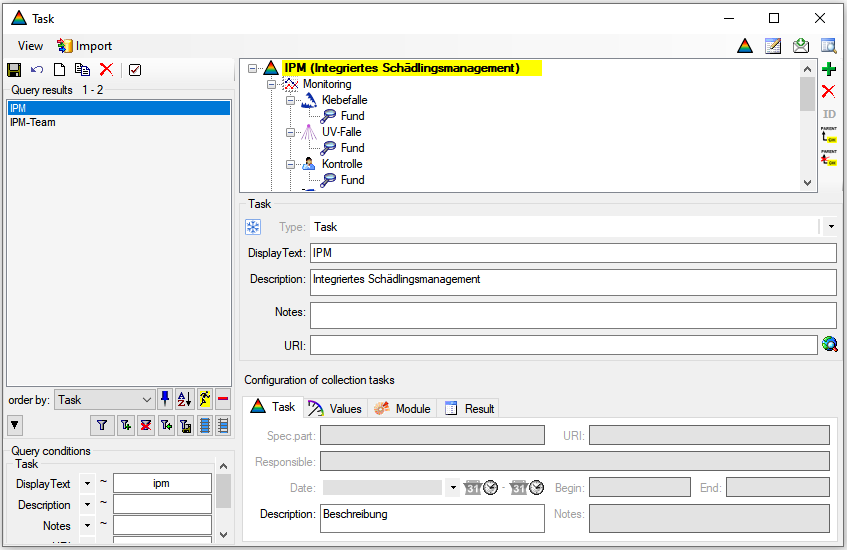
View
To show the site of the URI fo the task if available, choose show URI.
Import
To import data from a tab separated text file, choose
 from the menu. For further details see
chapter ImportWizard.
from the menu. For further details see
chapter ImportWizard.
Types
To edit types click on the button.
Table editor
To edit the data with the datatable click on the button. For details check the
TableEditors section.
Feedback
To send a feedback to the software developer click on the feedback button.
History
To view the history of a dataset, click on the history button. A window
with the history will open. For more details see the section
History.
Details
The details of the task like e.g. type or display text are set in the
upper part underneath the hierarchy (see above), the details for
Collection tasks are defined in the lowest part. Only those properties
that are specified by any text or definition are availabe for the
depending collection tasks. There are several contents that are possible
for a
Colletion task:
- Specimen part: If the collection task is related to a certain
part of a specimen in the collection
- Transaction: If the collection task is related to a certain
transaction
- URI: If the collection task should contain an URI, the
description for the URI
- Responsible: If there is a responsible person or institution for
a task, the corresponding description
- Date: If the collection task should contain a date and or time.
- You can choose among several options:
- Date
- Date from to
- Date & Time
- Date & Time from to
- Time
- Time from to
- Begin: If present, the description of the begin
- End: If present, the description of the endS
- Description: If the collection task should contain a desciption,
the description for the desciption
- Notes:: If the collection task should contain notes, the
description for the notes
- Metric:: If the collection task contains values collected from a
sensor e.g. via Prometheus, the description for the metric
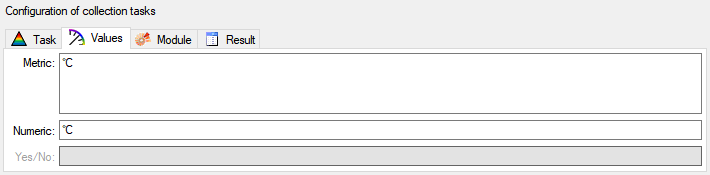
- Numeric: If the collection task should contain a numeric value,
the description for the numeric value
- Yes/No: If the collection task should contain a boolean value,
the description for the Boolean value
- Module: If the collection task should contain a link to a module
of the DiversityWorkbench, the description and the type of the
module. There are several modules for which links may be defined
- DiversitAgents
- DiversitCollection
- DiversitGazetteer
- DiversitProjects
- DiversitSamplingPlots
- DiversitScientificTerms
- DiversitTaxonNames
If the values should be taken from a list, the entries are defined
here as shown in the image below
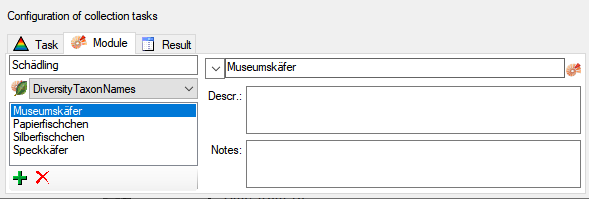
- Result: If the collection task should contain a text result, the
description for the result. Similar to the module you can provide a
list of values for selection as shown in the image below.
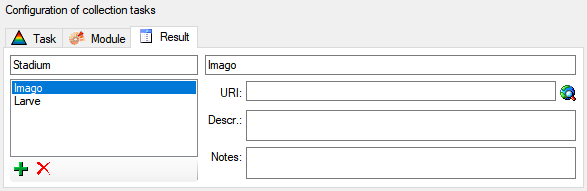
insert a new analysis to an organism select the organism in the upper
tree. Then select the type of the analysis from the drop down list as
shown below.
Subsections of Task
Diversity Collection
Exhibition
The exhibitions are organized via Tasks. For a introduction
see a short tutorial
.
DiversityCollection provides a predefined template if you want to
organize exhibitions in your collection. You can provide floor plans for
your collection and pinpoint the locations for
your exhibition. To edit exhibitions choose Administration -
Collection tasks -  Exhibitions ... from the
menu. A window as shown below will open.
Exhibitions ... from the
menu. A window as shown below will open.
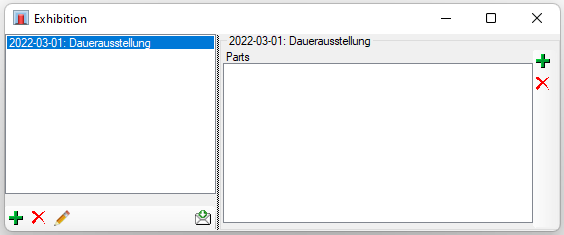
To add a new exhibition click on the add button in the
lower left. To remove a selected exhibition use the
. To edit a selected exhibition use the edit button. To send any
feedback concerning exhibitions and this form, click on
the button (see above).
To set the default responsible for actions within the exhibition resp.
collection tasks, click on the button and select
the User responsilbe for new
tasks option (see below).
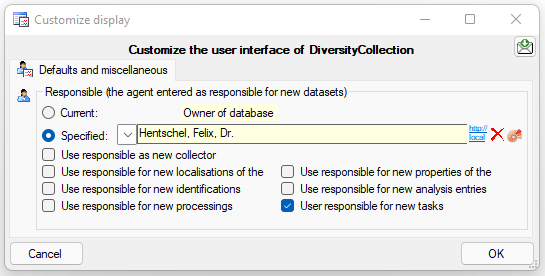
Exhibitions
To add an exhibition click on the add button in the
lower left. A window as shown below will open.
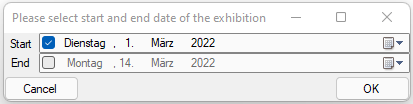
You may enter the start and end of the exhibition. Next you will be
asked for the title of the exhibition (see below).
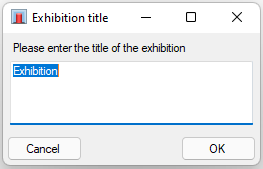
Next you have to select a location within the collection where the
exhibition will be placed and as last step the timeperiod for the transfer of the part in the exhibition (see below).
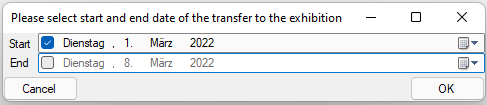
Now the new exhibition will be shown in the list (see below).
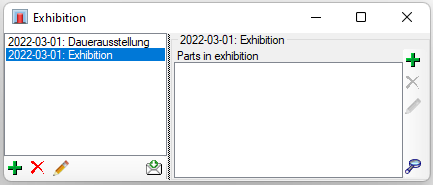
To edit a selected exhibition use the edit button. A
window as shown below will open, where you can edit the details of the
exhibition. For further information see chapter Collectiontask.
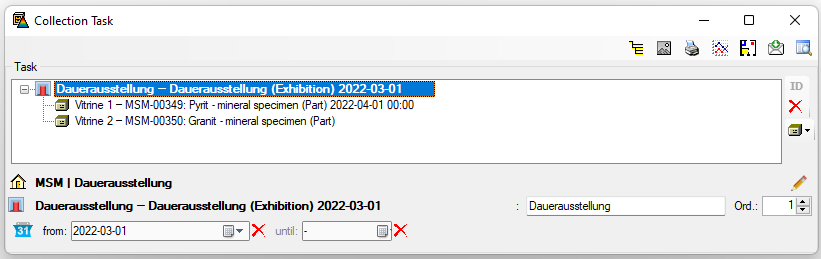
If you want to delete an exhibition use the
button. You will be asked before the exhibition and all it depending
entries will be removed from the database (see below).
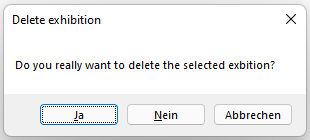
Parts
To add parts to an exhibition, click on the add button
for the parts. A window as shown below will open, where you can set the
begin and / or end of the transfer into the exhibition.
Next you have to select a location within the collection where the part
will be placed (see below).
A window for selecting the parts will open (see below)
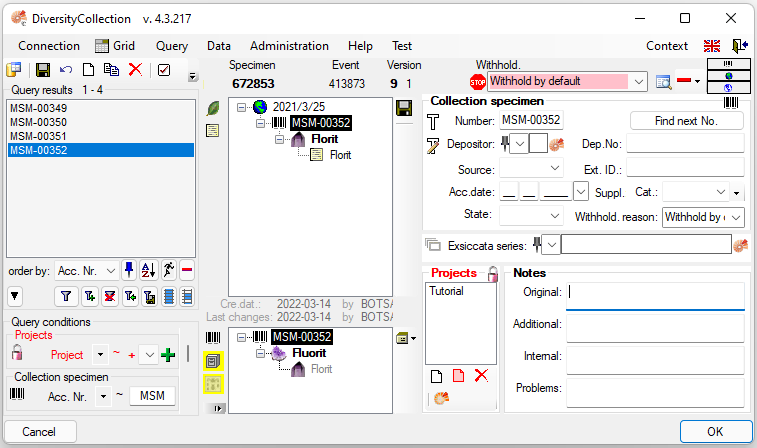
If the list contains more than 1 specimen you will be asked if you want
to insert all specimens in the list. You may choose to expand the
inserted specimen from only the selected to the whole list (see below).
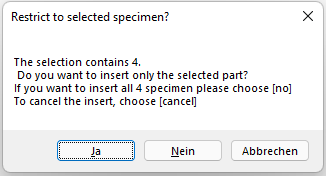
If there the list contains parts that are placed within the selected
collection, the program will inform you that these parts will not be
inserted in the exhibition as they are already there.
The new parts will than be inserted into the exhibition. Select a part
in the list to see the details (see below). For more details, click on
the button.
Collections
As soon as there are parts available the Collections will be listed in
the upper right. Select the first empty line to show all parts
transferred into the exhibition. If you select a collection, the
displayed parts will be restricted to this restricted. If there are
parts with their primiary location in the selected collection these will
be listed directly below the collections (see below).
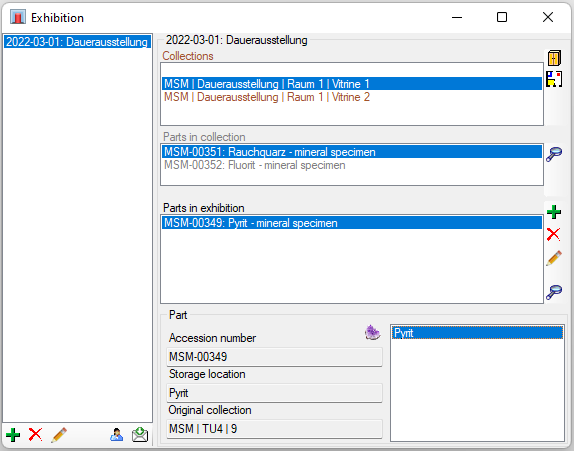
Plan
To see the plan of a collection, click on the
button (see below). For more details see chapter
Collection.
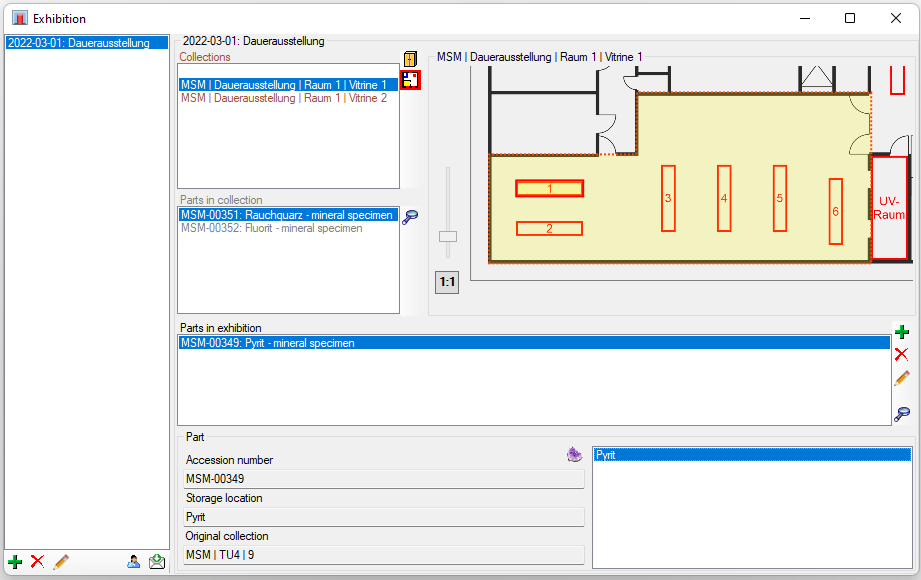
Printing
To print an overview of the parts in an exhibition, click on the generate report button. In the printer area you can generate and print reports either for all collections in the list or a single selected collection.
The collection hierarchy selects the part (e.g. a room) for which the report will be created. You can choose the time range for the report.
If no Schema is selected plain xml will be generated. With the open file button choose a schema applied for the report. There are several schemas provided by the software, but you can create some of your own. You can include plans of your collection.
To create the report, click on the create report button. To print it, use the button.
Overview
In the main window of the application the exhibition is only visible if the display of the tasks is activated. With a click on the  button it will change to and the exhibition will be visible in the tree. Depending on the timespan for the exhibition the displayed icon will be
  for current exhibitions resp.
  for upcoming or past exhibitions.
Diversity Collection
Task
Import
To import data into the Task and Collection Task tables, select Data →  Import → Wizard and then
- import Task …
- import Collectiontask …
A window will open where you can import your data as described in the import section.
Diversity Collection
Task types
The types for tasks are defined within the table TaskType_Enum. The
define new types click on the button in the task window. A window as
shown below will open.
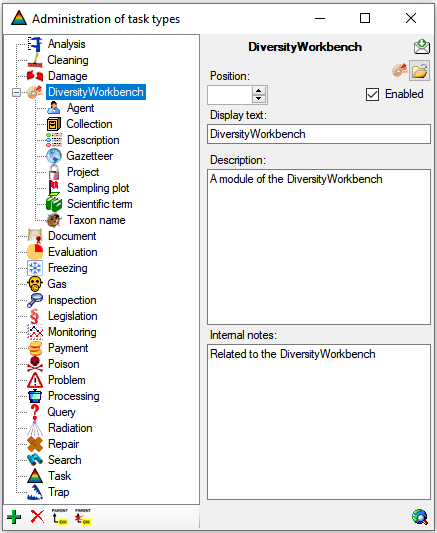
There are several predefined task types, but you can add additional
types of your own. The types underneath the type
DiversityWorkbench are types for tasks related
to a module of the DiversityWorkbench.
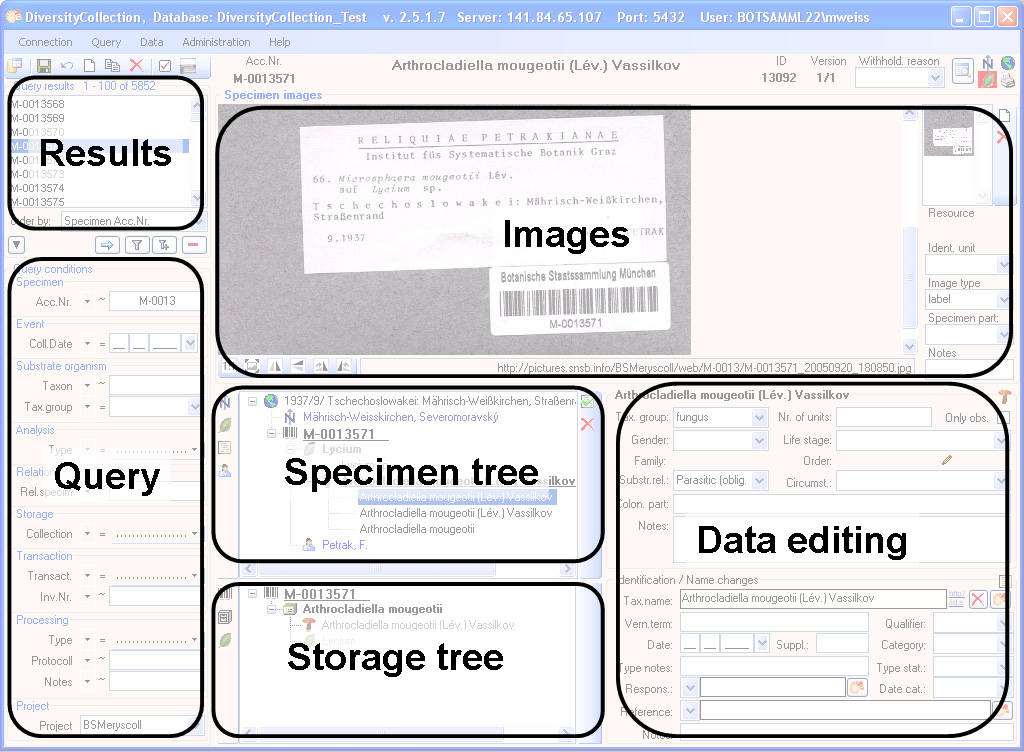

 To plot…


 Link to

 Defaults and miscellaneous
 Number of displayed levels for location hierarchy