Statistical Measures

The following table gives an overview of the available statistical measures. In column Calculation a hint is given, how the measuere is calculated from the basic data rows.
| Name | Abbr. | Calculation |
| Lower range limit (human estimate) | - | x1..xn sorted list: x1 |
| Upper range limit (human estimate) | + | x1..xn sorted list: xn |
| Central or typical value (human estimate) | centr. | x1..xn sorted list: xn/2 |
| Lower range limit (legacy data stat. meth. unknown) | -(?) | x1..xn sorted list: x1 |
| Upper range limit (legacy data stat. meth. unknown) | +(?) | x1..xn sorted list: xn |
| Central or typical value (legacy data stat. meth. unknown) | centr.(?) | x1..xn sorted list: xn/2 |
| Minimum value | Min | Absolute smallest value |
| Maximum value | Max | Absolute largest value |
| Mean (= average) | μ | μ=(1/n)∑(n)xi |
| Harmonic mean | hμ | hμ=n/(∑(n)(1/xi)) hμ=0 if any xi=0 |
| Geometric mean | gμ | gμ=n√∏(n)xi |
| Mode | mode | Value that appears most often (ambigious!) |
| Median | med. | x1..xn
sorted list n odd: med=x(n+1)/2 n even: med=(xn/2+x(n/2+1))/2 |
| Interquartile mean (= average) | IQM | x1..xn
sorted list IQM=μ(x0.25n+1..x0.75n+1) |
| Variance (sample df = n-1) | Var. | Sn-1=(1/n-1)∑(n)(xi-μ)2 |
| Variance (population; df = n; rarely applicable!) | Var. (pop.) | Sn=(1/n)∑(n)(xi-μ)2 |
| Standard deviation (sample) | s.d. | σn-1=√Sn-1 |
| Standard deviation (population; df = n; rarely applicable!) | s.d. (pop.) | σn=√Sn |
| Mean deviation | m.d. | md=(1/n)∑(n)|xi-μ| |
| Mean deviation from median | m.d.m. | mdm=(1/n)∑(n)|xi-med| |
| Coefficient of variation (sample) | CV | CV=σn/μ |
| Corrected coefficient of variation (sample) | CVC | CVC=σn-1/μ |
| Total range | TR | x1..xn
sorted list TR=xn-x1 |
| Interquartile range | IQR | x1..xn
sorted list IQR=x0.75n+1-x0.25n+1 |
| Standard error of mean | s.e. | σx=σn-1/√n |
| Standard error of variance (of multiple samples) | s.e.(var.) | Sx=Sn-1/n |
| Skewness | Skw. | ϒ1=(1/n)∑(n)((xi-μ)/σ)3 |
| Kurtosis | Kurt. | Kurt=(1/n)∑(n)((xi-μ)/σ)4 |
| Sample size | n | Number of values |
Adjust display sequence
You may adjust the display sequence of the statistical measures for the
whole database. Choose Administation
->  Database ->
Statistical
measures … from the menu. A window will open as shown below.
Database ->
Statistical
measures … from the menu. A window will open as shown below.
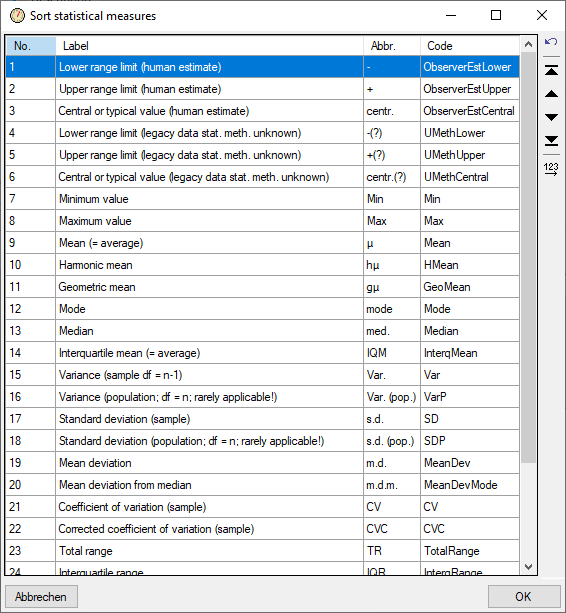
The sequence number column (“No.”) determines the display sequence in various forms. You may order the entries by clicking on a column header. With the arrow buttons ( ) you can move the selected entries up or down within the table, clicking button or shifts the selected entries to the top respective bottom of the table. After ordering the entries click button to renumber the table entries (starting with “1” for the first table entry) and make the changes effective. To save the changes in the database, leave the form with the OK button, to discard all changes click the Abort button.