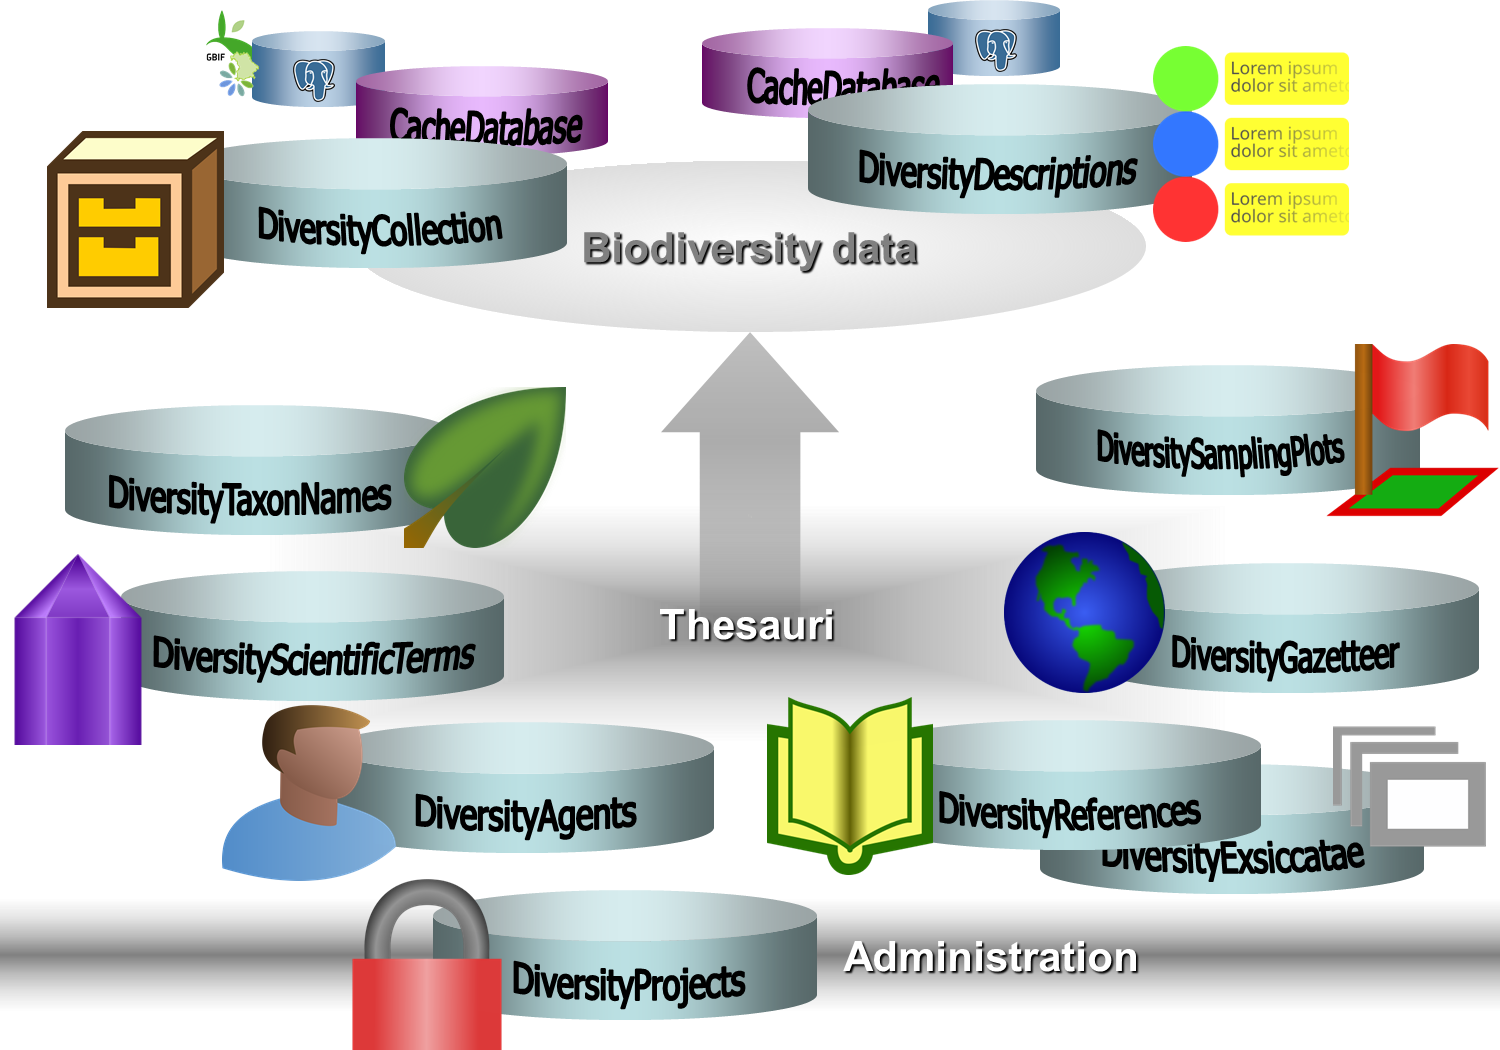
Subsections of Download
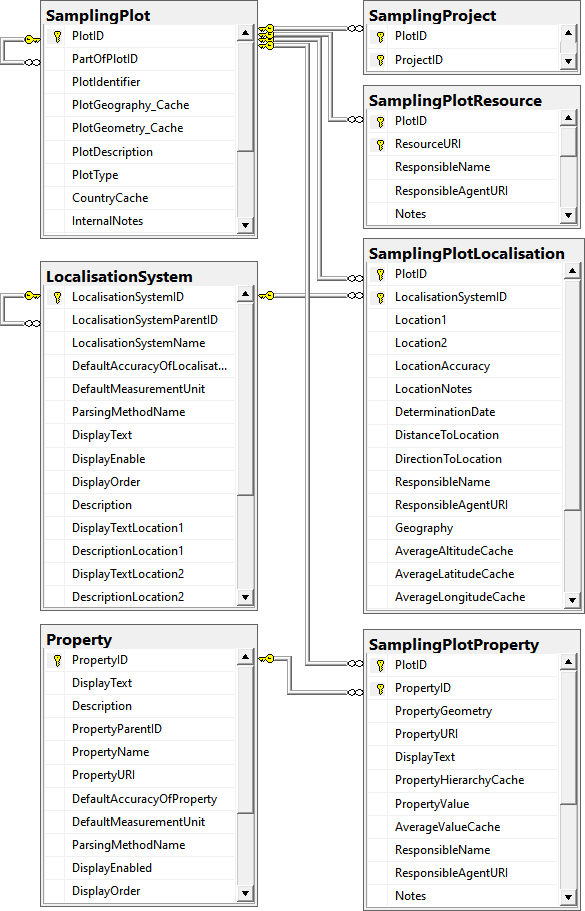
Diversity Sampling Plots
Installation
Resources
To run a module of the Diversity Workbench framework, you need access to a database and an installation of the respective client.
The following instructions explain how to install the DiversityCollection client. All other modules are installed in the same way.
If you do not yet have an account for your institutional DWB platform, please contact your institution’s DWB administrator. If you wish to set up and use your own personal, institutional, domain-specific, or research-group-internal database environment, see Installation
of a database for more information.
A German-language video demonstrates the installation using the DC client as an example. Please note that the initial steps in the video are outdated, as the downloads are now available via this manual, as described below.  .
.
Download
All DiversityWorkbench modules can be downloaded free of charge.
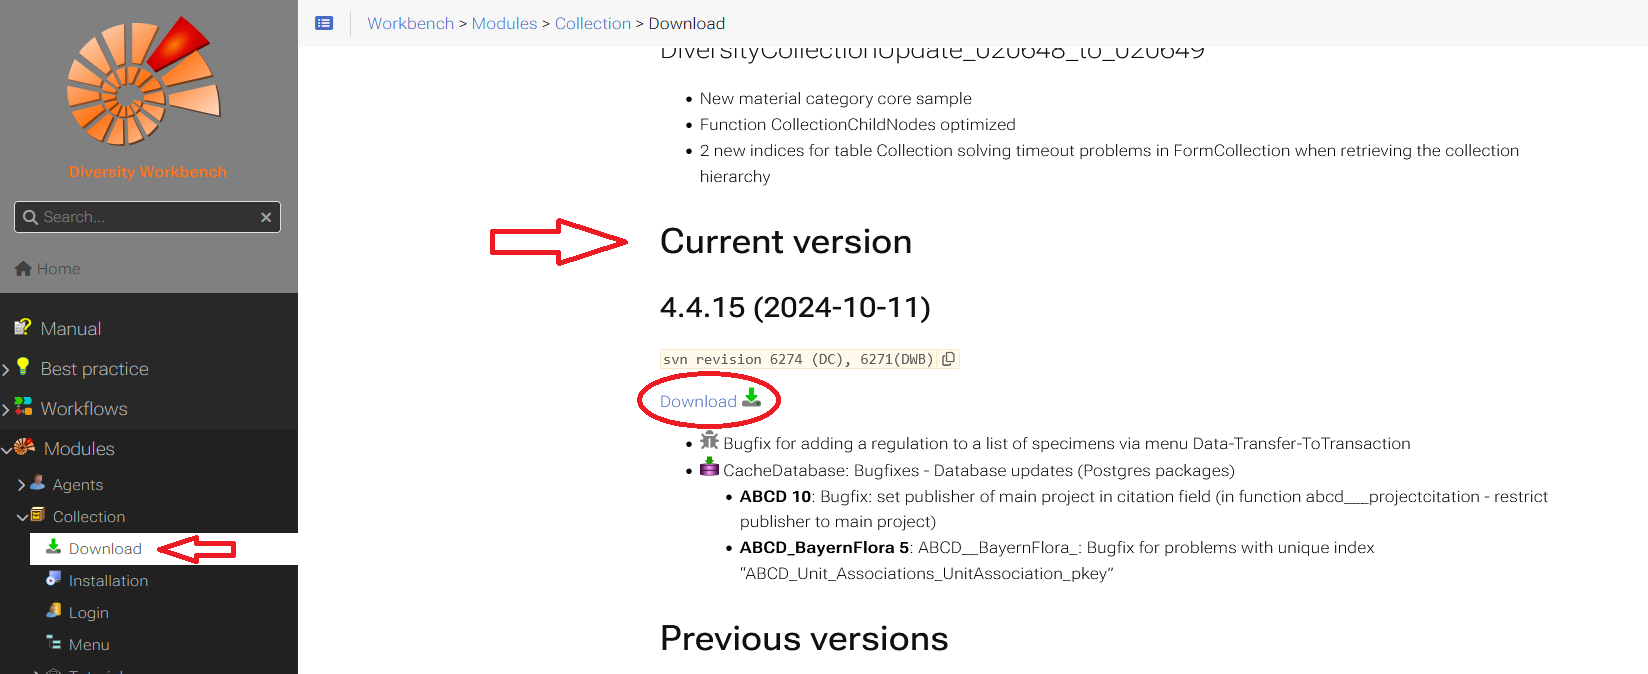
Within each module in the manual, you will find a Download menu item. There, you can download the latest version in the Current version section.
Installation of the client
The client is currently based on the .Net framework version 4.8 from Microsoft. If not already present, the software will prompt you to install it.
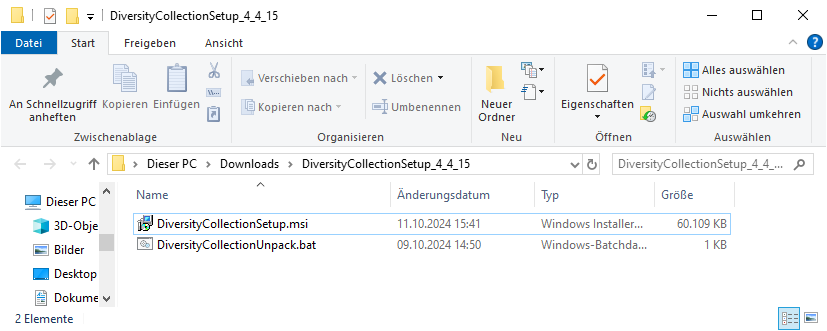
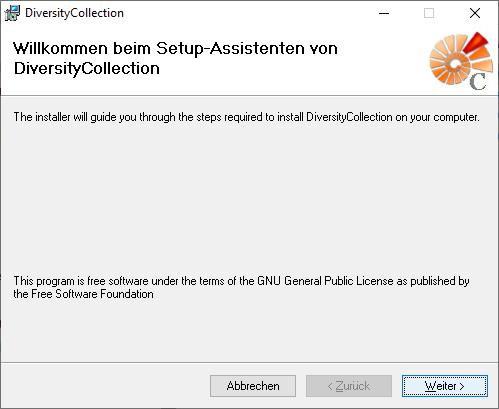
After downloading the client, unzip the .zip folder. The extracted setup folder contains two files: an .msi and a .bat file.
If you want to install the client on your computer, start the installation by double-clicking the .msi file.
If necessary, you can adjust the installation location in the next step.
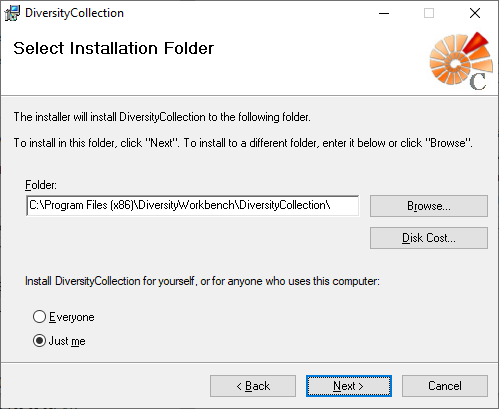
Once the installation is complete, the software will be added to the program menu (see below) and a shortcut will be created on the desktop.
In the next chapter Database Login the login process is explained.
Run program without installer
There are several reasons why you might prefer to run
DiversityCollection without installation. E.g. if you lack
administrative permissions on your computer or if you want to use
several different versions of DiversityCollection in parallel.
Therefore, the downloaded .zip file contains a .bat file. With this .bat file, a folder DiversityCollection_x_x_x is created on your desktop containing all relevant files to run the client DiversityCollection.
You have to unzip the downloaded .zip file to a local folder. The unzipped folder contains the .msi file and the .bat file. Within this unzipped! folder start the .bat file with a
double-click. You might get a security warning, as shown in the section
Windows protection warning.
The batch file unpacks the program files to a folder on your desktop named DiversityCollection_x_x_x,
where "x_x_x" stands for the program version.
To start the DiversityCollection program, go to the folder and double-click on the file  DiversityCollection.exe.
The login process is explained in the next chapter Database Login.
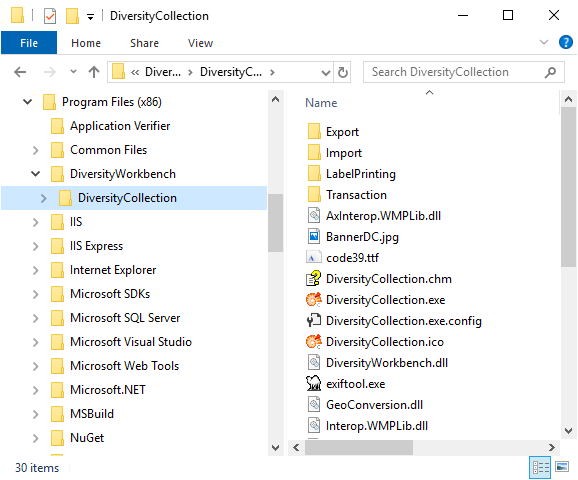
The software will be placed in the programs directory, as shown below.
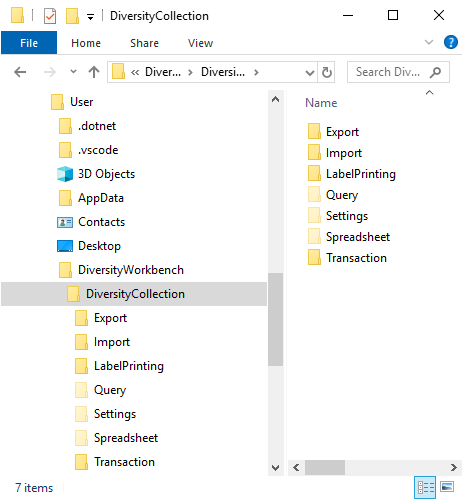
Additionally, a folder is created in the user directory. This folder contains files and templates, for example, for label printing. It also contains hidden folders, such as Query. User input is saved there so that it can be loaded again the next time the program is started.
Windows protection warning
If you receive the following warning from Windows
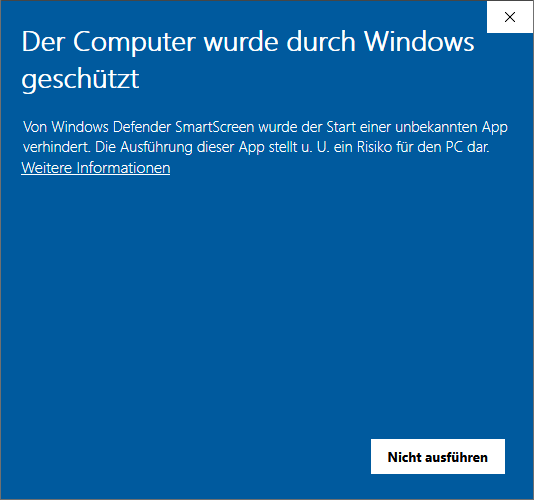
please click on Weitere Informationen. A button Trotzdem ausführen will appear.
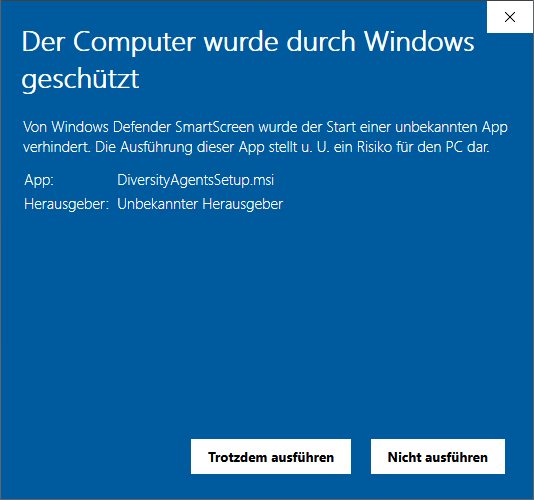
Please click on Trotzdem ausführen to install the software.
Diversity Sampling Plots
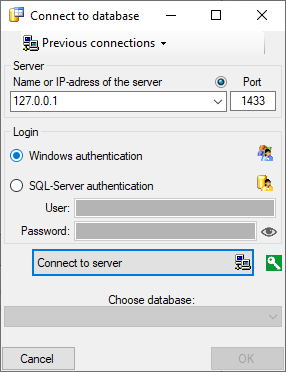
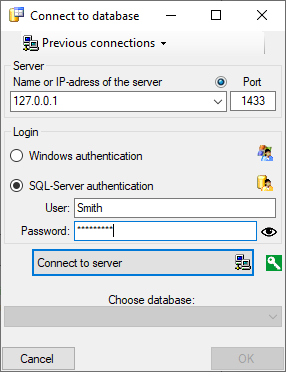
Database login
To use a module from the DiversityWorkbench framework, such as “DiversityCollection”, you need access to a database. If you do not yet have an account for your institutional DWB platform, please contact your institution’s DWB administrator. If you wish to set up and use your own personal, institutional, domain-specific, or research-group-internal database environment, you will find instructions here.
Connect to a database
-
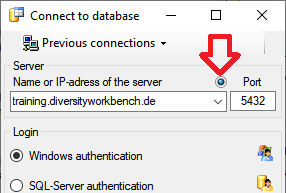
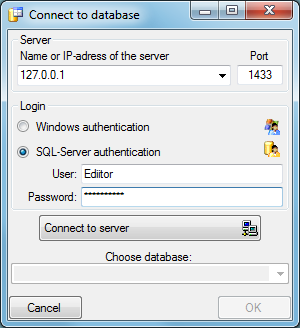
At the top left of the main window, go to Connection → Database … or click the Connect button  . A dialog form “Connect to database” opens.
-
In the “Server” section, add the server name or the IP address and the port number.
-
In the “Login” section, choose an option:
-
Click on the Connect to server button.
-
If the connection information is valid, you can Choose a database from the drop-down list at the bottom.
-
Choose the database you want to work with and click OK.
-
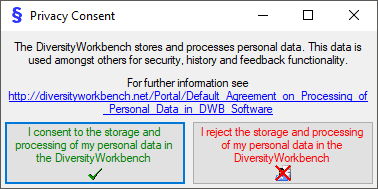
If you access a database for the first time, you will be asked to consent
to the storage and processing of your personal data (see below)
according to the General Data Protection Regulation.
Without your consent the access is not possible.
Important
The standard port number for SQL-Server is 1433 and is set as
default. If the database server is configured to use a different port, you must change the port number in the port input field.
Previous connection
If you have been connected to a database in previous sessions, you can select one of these connections:
- At the top of the “Connect to database” dialog form, click on the Previous connections button
 .
.
- Select a connection from the drop-down list. This inserts the name or IP address and the port in the corresponding input fields in the server section.
- To log into a database, proceed as described above starting from step 3.
Testing a connection
To test the connection, you can send a ping by clicking the button  .
.
As a first step the IP resp. Server will be tested. If the connection to the server is successful, the port will be tested as a second step.
Switch between databases
- At the top left, go to Connection → Database … or click on the Connect button .
- If you are already connected to a server, you can select a database from the drop-down list Choose database at the bottom of the dialog box.
Reset and Cancel
Reset:
If you are connected to a server, there is a Reset button below the “Login” section of the “Connect to database” dialogue box.
Click the Reset button to change your server or login settings.
Cancel:
If you do not want to change anything, click on Cancel.
Encryption
By default, the connection to the databases is encrypted.
The icon  next to the Connect to server button indicates an encrypted connection.
By clicking on the icon, you can switch to an unencrypted connection, indicated by the icon
next to the Connect to server button indicates an encrypted connection.
By clicking on the icon, you can switch to an unencrypted connection, indicated by the icon  .
.
Videos
- Login to a database: .
Subsections of Tutorial
Tutorial Backlinks
Tutorial - module relations resp. backlinks
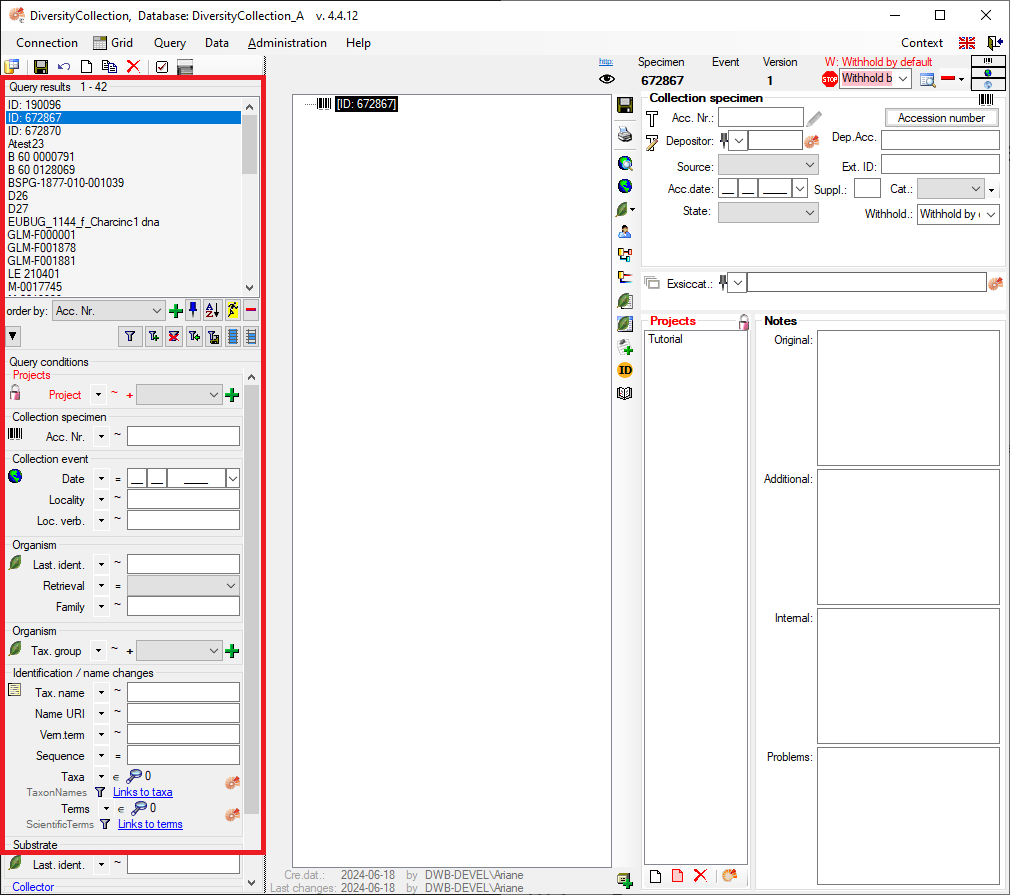
DiversityCollection
 To display dataset in the module DiversityCollection that are linked to
the current plot, you can activate the query for these data in the menu
Data - Scan modules - DiversityCollection (for the specimen) and Data -
Scan modules - Images for the images. Please keep in mind that these
backward query will increase the response time of the application.
To display dataset in the module DiversityCollection that are linked to
the current plot, you can activate the query for these data in the menu
Data - Scan modules - DiversityCollection (for the specimen) and Data -
Scan modules - Images for the images. Please keep in mind that these
backward query will increase the response time of the application.
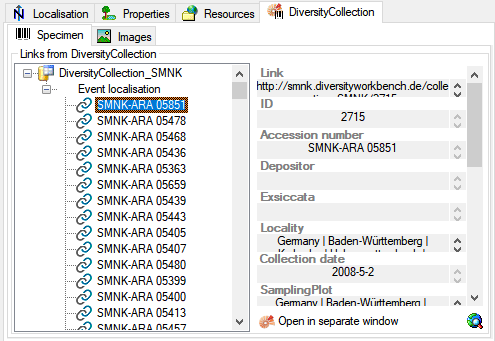
Specimen
 All specimen within the DiversityCollection databases as listed in the
connections and linked to the current plot will be
listed as shown below.
All specimen within the DiversityCollection databases as listed in the
connections and linked to the current plot will be
listed as shown below.
Images
To show the images within a certain DiversityCollection database, linked
to a plot, in the  images tab use the
 button to connect to the
DiversityCollection database. Then all images will be listed as shown
below.
button to connect to the
DiversityCollection database. Then all images will be listed as shown
below.
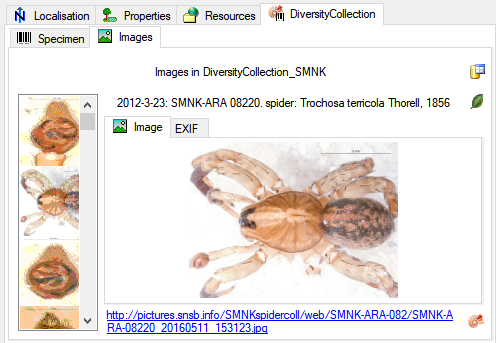
Use the link beneath the image to show the image in a separate window.
The EXIF tab contains the corresponding information of the image.
Tutorial Edit Plots
Tutorial - create or change plots
To create a new sampling plot click at the  icon of
the tool bar. A Window will pop up and ask you to enter the identifier
of the new plot.
icon of
the tool bar. A Window will pop up and ask you to enter the identifier
of the new plot.
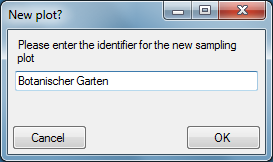
The new plot will be created and shown on the screen.
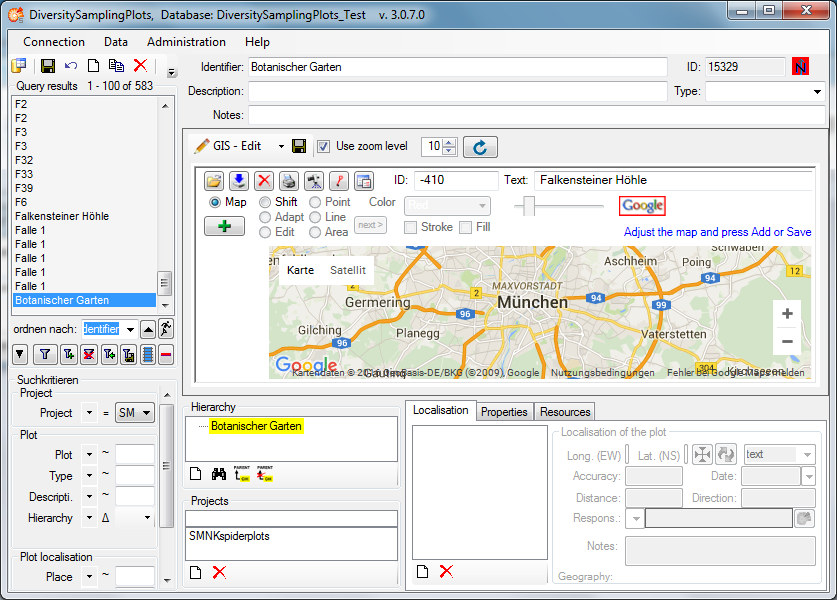
Now you may edit the parameters and either add a geography of any kind
using the GIS-Editor window or a certain point with WGS84 coordinates
using the Localisation control.
For the usage of the GIS-Editor please see the
Description in the second part
of the help file. You may select an appropriate map style, navigate to
your region of interrest by shiftig and zooming the map and create it as
a background map by clicking the  button. Then select
Point, Line or Area mode and draw your geography on the background map.
Add one or more geographies using the button. The
geographies may be changed later on using the Editmode of the GIS-Editor. Finally
save the geography to the database by clicking on the
button. Then select
Point, Line or Area mode and draw your geography on the background map.
Add one or more geographies using the button. The
geographies may be changed later on using the Editmode of the GIS-Editor. Finally
save the geography to the database by clicking on the
 button of the GIS-Edit window ( not that of
the Query toolbar!). A WGS84 localisation will be created
automatically.
button of the GIS-Edit window ( not that of
the Query toolbar!). A WGS84 localisation will be created
automatically.
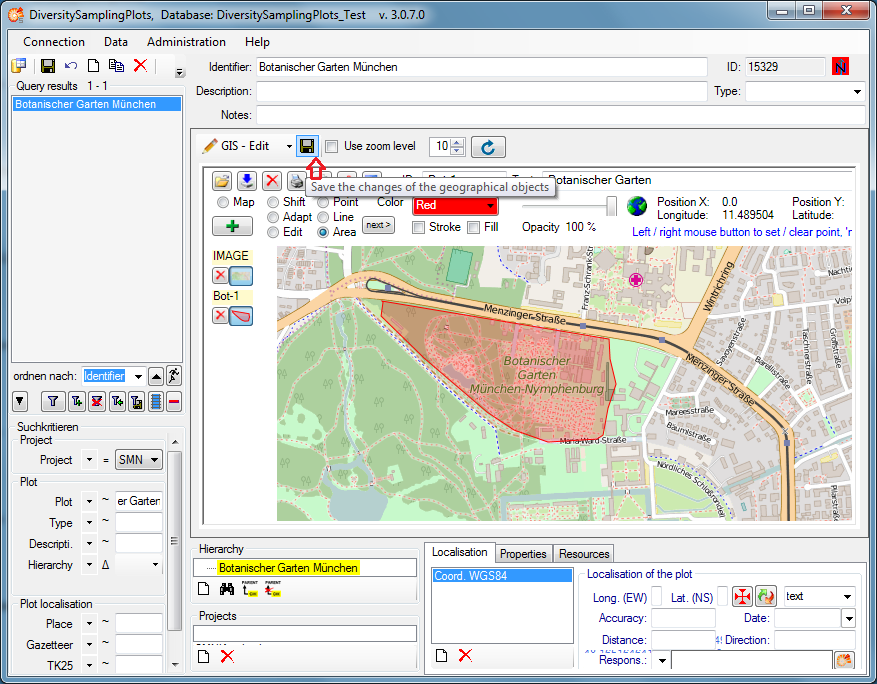
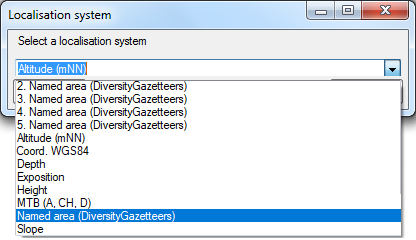
Alternatively you may create a WGS84 localisation using the
button in the Localisation tab below the GIS-Edit
window. A dialog will pop up.
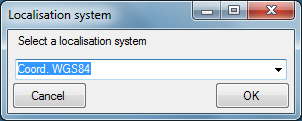
Select “Coord. WGS84” from the drop down list and then press the OK
butten. The new localisation will be shown in the list of the
Localisation tab.
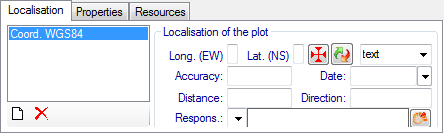
Select the localisation in the list and click at the  button. The coordinates window as known
from other DiversityWorkbench modules will be shown.
button. The coordinates window as known
from other DiversityWorkbench modules will be shown.
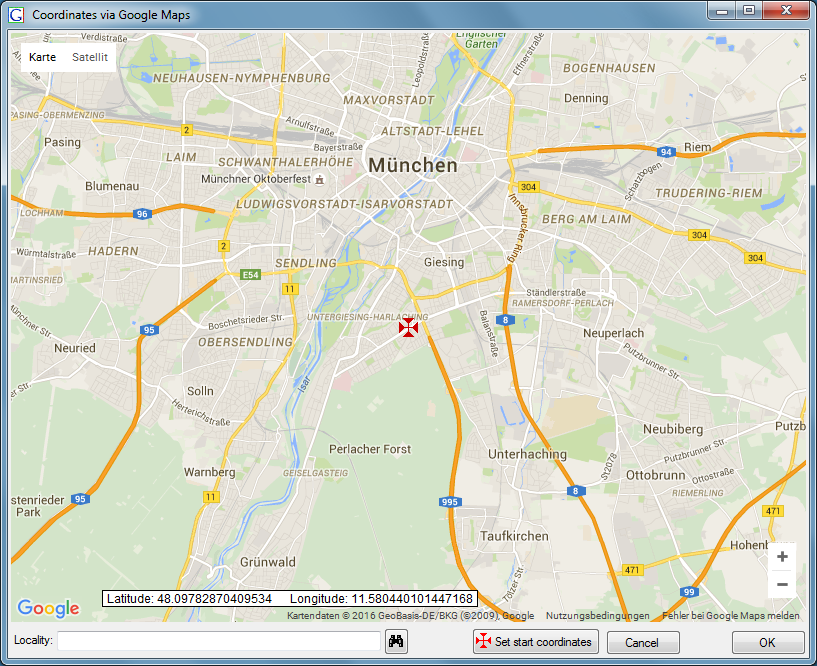
Shift the map using the mouse to localise a certain coordinate point
with the static cross in the center. Then press the OK button and the
coordinate point will be shown in the WGS84 localisation tab.
Additionally an Altitude and a Named area localisation will be created
automatically by calling the Geonames web service. Press the
button of the Query toolbar to save the new
localisation.
Tutorial Hierarchy
Tutorial - plot hierarchy
The plots may be hierarchical organised as a tree view. The location of
the current plot within the hierarchy is displayed in the hierarchy
window:
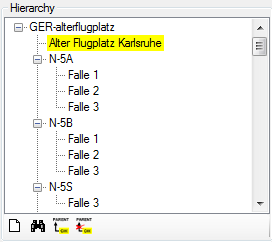
To add a new plot within the selected plot click on the button.
To change to another plot within the hierarchy tree just select the plot
in the tree view and click on the  button.
The new plot will be displayed.
button.
The new plot will be displayed.
To set the superior plot for the current sampling plot click on the
 button.
To remove the superior plot for the current sampling plot click on the
 button.
Wizard Tutorial
Import wizard - tutorial
This tutorial demostrates the import of a small file into the database.
The following data should be imported (the example file is included in
the software): At the end of this tutorial you will have imported
several datasets and practiced most of the possibilities provided by the
import wizard. The import is done in 2 steps to demonstrate the
attachment functionallity of the wizard.
Step1 - Import of the collection events
Choose Data → Import →  Wizard
 Sampling plot … from the menu. A window as
shown below will open. that will lead you through the import of the
data. The window is separated in 3 areas. On the left side, you see a
list of possible data related import steps according to the type of data
you choosed for the import. On the right side you see the list of
currently selected import steps. In the middle part the details of the
selected import steps are shown.
Sampling plot … from the menu. A window as
shown below will open. that will lead you through the import of the
data. The window is separated in 3 areas. On the left side, you see a
list of possible data related import steps according to the type of data
you choosed for the import. On the right side you see the list of
currently selected import steps. In the middle part the details of the
selected import steps are shown.
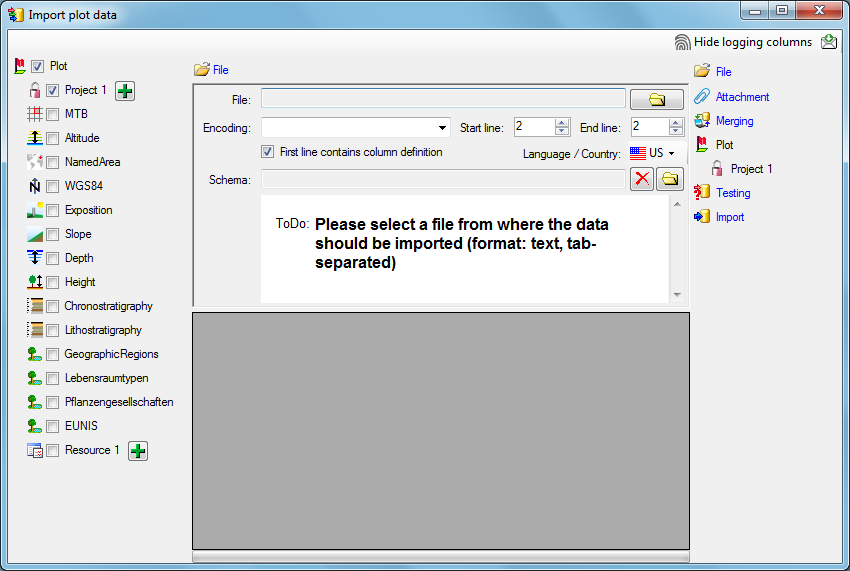
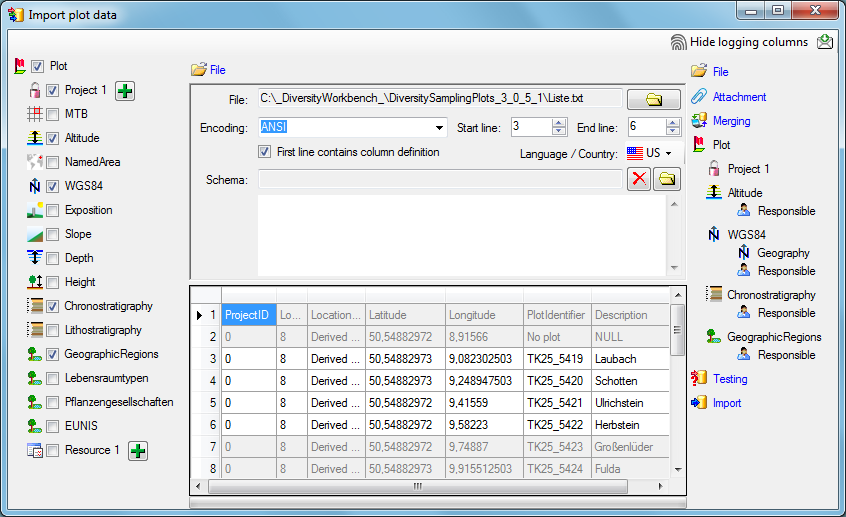
Choosing the File
As a first step, choose the  File from where the data
should be imported. The currently supported format is tab-separated text. Than choose the Encoding
of the file, e.g. Unicode. The Start line and End line will
automatically be set according to your data. You may change these to
restrict the data lines that should be imported. The not imported
parts in the file are indicated as shown below with a gray
background. If the
File from where the data
should be imported. The currently supported format is tab-separated text. Than choose the Encoding
of the file, e.g. Unicode. The Start line and End line will
automatically be set according to your data. You may change these to
restrict the data lines that should be imported. The not imported
parts in the file are indicated as shown below with a gray
background. If the  First line contains the
column definition this line will not be imported as well. If your data
contains e.g. date information where notations differ between countries
(e.g. 31.4.2013 - 4.31.2013), choose the Language / Country to
ensure a correct interpretation of your data. Finally you can select a
prepared Schema (see chapter Schema below) for the import.
First line contains the
column definition this line will not be imported as well. If your data
contains e.g. date information where notations differ between countries
(e.g. 31.4.2013 - 4.31.2013), choose the Language / Country to
ensure a correct interpretation of your data. Finally you can select a
prepared Schema (see chapter Schema below) for the import.
Choosing the data ranges
In the selection list on the left side of the window (see below) all
possible import steps for the data are listed according to the type of
data you want to import.
Certain tables can be imported in parallel. To add parallels click on
the add button (see below). To remove parallels, use the
 button. Only selected ranges will appear in the
list of the steps on the right (see below).
button. Only selected ranges will appear in the
list of the steps on the right (see below).
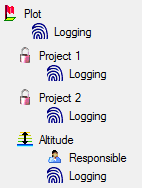
To import informations of logging columns like who created and changed
the data, click on  button in the header line.
This will include a additional substeps for every step containing the
logging columns (see below). If you do not import these data, they will
be automatically filled by default values like the current time and
user.
button in the header line.
This will include a additional substeps for every step containing the
logging columns (see below). If you do not import these data, they will
be automatically filled by default values like the current time and
user.
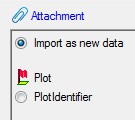
Attaching data
You can either import your data as new data or
 Attach them to data in
the database. Select the import step Attachment from the
list. All tables that are selected and contain columns at which you can
attach data are listed (see below). Either choose the first option
Import as new data or one of the columns
the attachment columns offered like SeriesCode in the table Series in
the example below.
Attach them to data in
the database. Select the import step Attachment from the
list. All tables that are selected and contain columns at which you can
attach data are listed (see below). Either choose the first option
Import as new data or one of the columns
the attachment columns offered like SeriesCode in the table Series in
the example below.
If you select a column for attachment, this column will be marked with a
blue backgroud (see below and chapter Table data).

Merging data
You can either import your data as new data or
 Merge them wih data in the database. Select the import step
Merge from the list. For every table you can choose between
Merge them wih data in the database. Select the import step
Merge from the list. For every table you can choose between
 Insert,
  Merge,
  Update and
Attach (see below).
Update and
Attach (see below).
The Insert option will import the data
from the file independent of existing data in the database.
The Merge option will compare the data
from the file with those in the database according to the
 Key columns (see below). If no matching data are
found in the database, the data from the file will be imported,
otherwise the data will be updated..
Key columns (see below). If no matching data are
found in the database, the data from the file will be imported,
otherwise the data will be updated..
The Update option will compare the data
from the file with those in the database according to the
Key columns. Only matching data found in the
database will be updated.
The Attach option will compare the data from
the file with those in the database according to the
Key columns. The found data will not be changed, but used as a
reference data in depending tables.
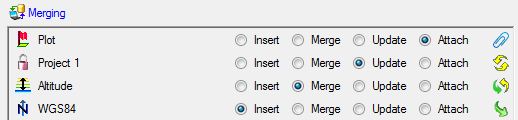
Table data
To set the source for the columns in the file, select the step of a
table listed underneath the Merge step. All columns available for
importing data will be listed in the central part of the window. In the
example shown below, the first column is used to attach the new data to
data in the database.
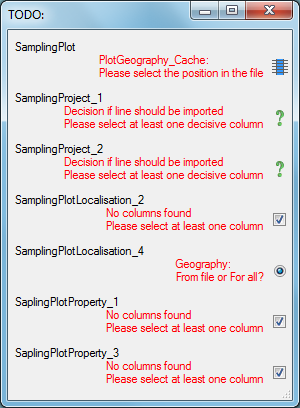
A reminder in the header line will show you what actions are still
needed to import the data into the table:
- Please select at least one column = No
column has been selected so far.
- Please select at least one decisive column
 =
If data will be imported depends on the content of decisive colums, so
at least one must be selected.
=
If data will be imported depends on the content of decisive colums, so
at least one must be selected.
- Please select the position in the file
 =
The position in the file must be given if the data for a column should
be taken from the file.
=
The position in the file must be given if the data for a column should
be taken from the file.
- Please select at least one column for comparision
= For all merge types other than insert columns for comparision with
data in the database are needed.
- From file or For all = For every you have
to decide whether the data are taken from the file or a value is
entered for all
- Please select a value from the list
 = You have
to select a value from the provided list
= You have
to select a value from the provided list
- Please enter a value
 = You have to enter a
value used for all datasets
= You have to enter a
value used for all datasets
The handling of the columns in described in the chapter
columns.
Testing
To test if all requirements for the import are met use the
 Testing step. You can use a certain line in
the file for you test and than click on the Test data in line:
button. If there are still unmet requirements, these will be listed in a
window as shown below.
Testing step. You can use a certain line in
the file for you test and than click on the Test data in line:
button. If there are still unmet requirements, these will be listed in a
window as shown below.
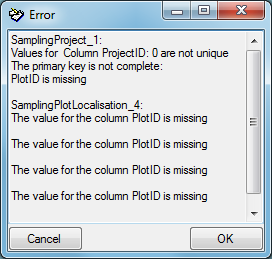
If finally all requirements are met, the testing function will try to
write the data into the database and display you any errors that
occurred as shown below. All datasets marked with a red backgroud, produced some
error.
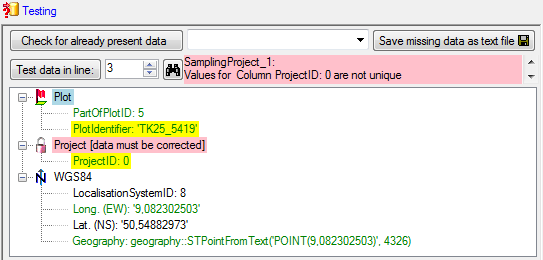
To see the list of all errors, double click in the error list window in the header
line (see below).
If finally no errors are left, your data are ready for import. The
colors in the table nodes in the tree indicate the handling of the
datasets: INSERT, MERGE, UPDATE, No difference. Attach, No data. The colors of the
table colums indicate whether a colums is decisive , a key column or an attachment column.
Import
With the last step you can finally start to  import the data into the
database. If you want to repeat the import with the same settings and
data of the same structure, you can save a schema of the current
settings (see below).
import the data into the
database. If you want to repeat the import with the same settings and
data of the same structure, you can save a schema of the current
settings (see below).
|
|
|
|
| Schedule for import of tab-separated text files into DiversityCollection |
|
|
|
| Target within DiversityCollection: Specimen |
|
|
|
| Schedule version: |
1 |
Database version: |
02.05.41 |
| Lines: |
2 - 3215 |
First line contains column definition: |
? |
| Encoding: |
Unicode |
Language: |
de |
Tables
CollectionSpecimen
(CollectionSpecimen)
Parent: CollectionEvent
Merge handling: Insert
| Column in table |
? |
Key |
Copy |
Pre |
Post |
File pos. |
Transformations |
Value |
Source |
Table |
| CollectionSpecimenID |
|
|
|
|
|
|
|
|
Database |
|
| AccessionNumber |
? |
? |
|
|
|
0 |
|
|
File |
|
IdentificationUnit_1
(IdentificationUnit)
Parent: CollectionSpecimen
Merge handling: Merge
| Column in table |
? |
Key |
Copy |
Pre |
Post |
File pos. |
Transformations |
Value |
Source |
Table |
| CollectionSpecimenID |
|
|
|
|
|
|
|
|
Database |
|
| IdentificationUnitID |
|
|
|
|
|
|
|
|
Database |
|
| LastIdentificationCache |
|
? |
|
|
|
2 |
|
|
File |
|
| + |
|
|
|
|
|
3 |
|
|
File |
|
| + |
|
|
|
|
|
4 |
|
|
File |
|
| + |
|
|
|
|
|
5 |
|
|
File |
|
| TaxonomicGroup |
? |
|
|
|
|
|
|
fish |
Interface |
|
IdentificationUnitAnalysis_1_1
(IdentificationUnitAnalysis)
Parent: IdentificationUnit_1
Merge handling: Update
| Column in table |
? |
Key |
Copy |
Pre |
Post |
File pos. |
Transformations |
Value |
Source |
Table |
| CollectionSpecimenID |
|
|
|
|
|
|
|
|
Database |
|
| IdentificationUnitID |
|
|
|
|
|
|
|
|
Database |
|
| AnalysisID |
|
|
|
|
|
|
|
94 |
Interface |
|
| AnalysisNumber |
|
|
|
|
|
|
|
1 |
Interface |
|
| AnalysisResult |
? |
? |
|
|
|
39 |
|
|
File |
|
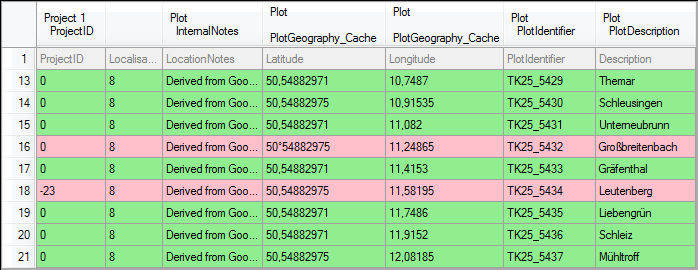
Lines that could not be imported will be marked with a red background
while imported lines are marked green (see below).
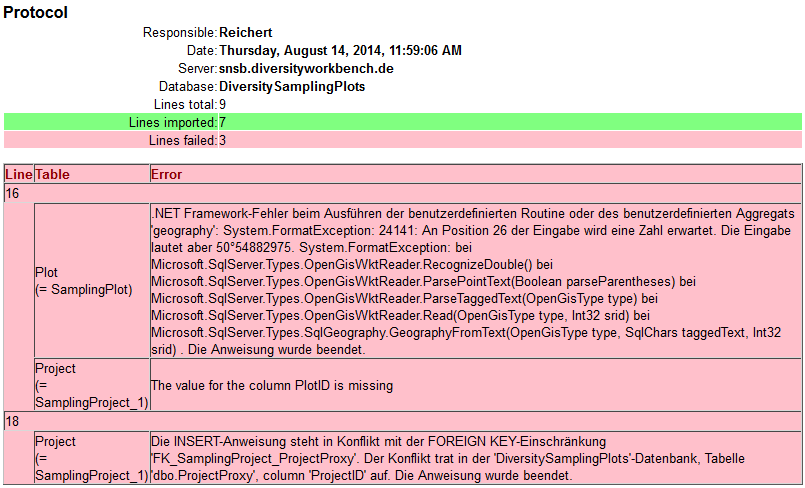
If you want to save lines that produce errors during the import in a
separate file, use the Save failed lines option. The protocol of the
import will contain all settings acording to the used schema and an
overview containing the number of inserted, updated, unchanged and
failed lines (see below).
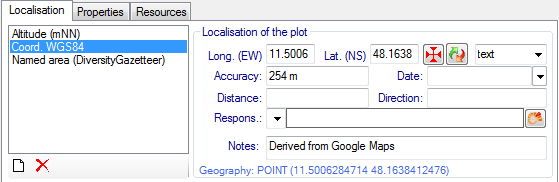
Tutorial Localisation
Tutorial - localisation
Different kinds of localisation may be assigned to the sampling plots:
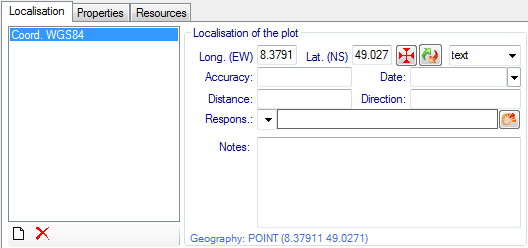
To add a new localisation for the selected plot click at the button. Select the desired kind of localisation from
the drop down list and press the OK button.
Fill up the data fields in the right part of the window. Each kind of
localisation can only be assigned once. The list will contain the
remaining choices.
Some buttons are provided depending on the selected localisation:
: Open a GoogleMaps window to select
the coordinates.
 : Convert coordinates to another
coordinate system.
: Convert coordinates to another
coordinate system.
 : Open an appropriate Diversity
Workbench remote module.
: Open an appropriate Diversity
Workbench remote module.
To remove a localisation, select it and click at the  button. The localisation will disappear from the
list.
button. The localisation will disappear from the
list.
Finally press the item in the Query
toolbar to store the localisation for the plot in the database.
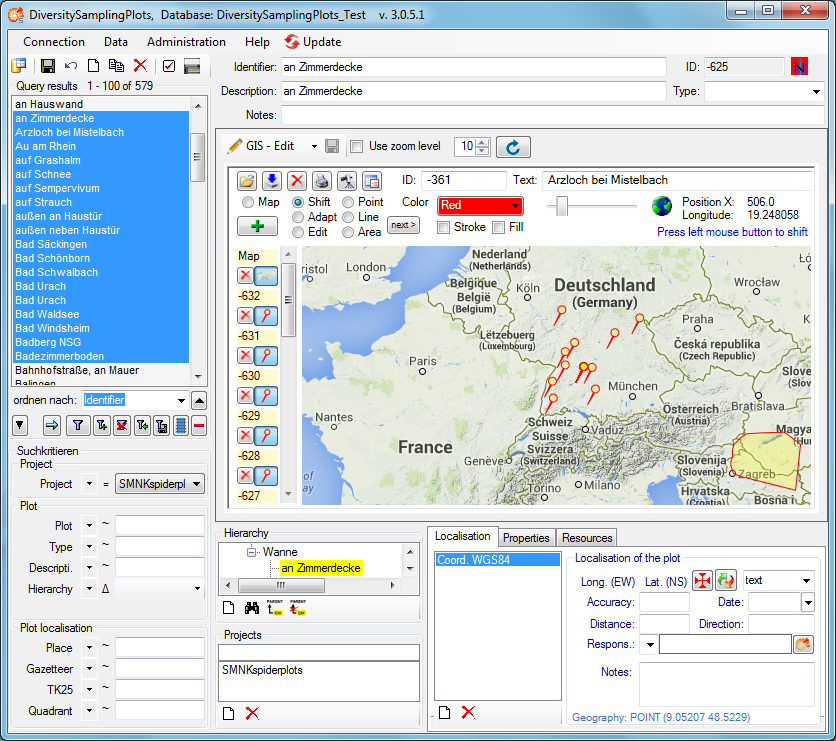
Tutorial Maps
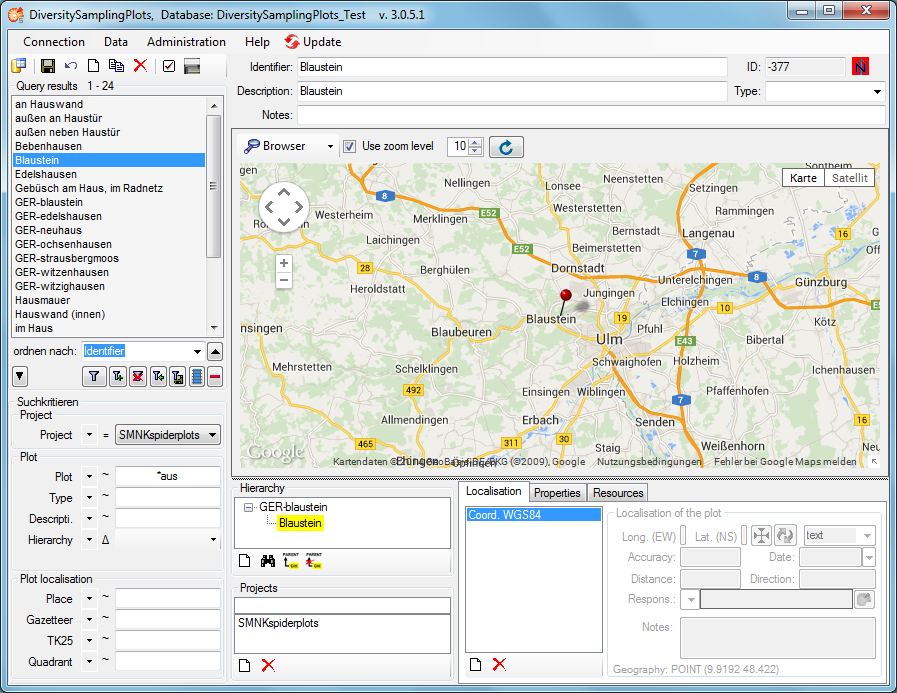
Tutorial - show plots on the maps
The results list box displays the current set of plots found by the
database query. To show a certain plot on the map, just click at the
entry. Due to the coordinates of the place the map will be adjusted to
this area and build up. There are 3 choices how to display the plot:
 Browser,
  GIS - View and
  GIS - Edit:
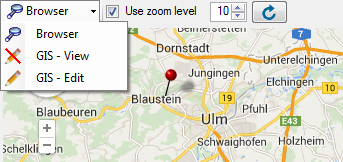
Browser uses a GoogleMaps window and
pins to show the geography of the plot, if any. This is rather fast and
interactive, but there is currently no support of areas or line strings
and no possibility to display more than one plot.
GIS - View uses the powerful GIS
Editor tool of the Diversity
Workbench, which can handle all kinds of geographies and display
distribution maps of multiple plots. Depending on the internet
connection and the map server it can take some seconds until the map
tiles have been build. A message box will pop up to advice the user to
wait, until the map is complete:
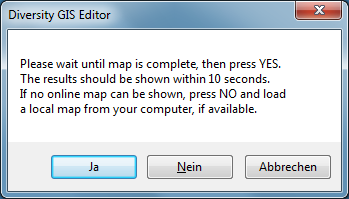
When all tiles of the background map are drawn, press OK to continue.
Then the online map will be scanned and frozen and the plots should
appear on the map:
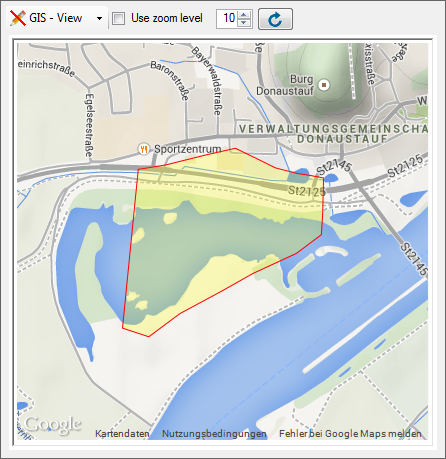
Be aware that this mode is just a viewer of the GIS Editor’s geography
objects. If multiple plots have been selected in the query list box,
press the  reload button to display
them. If you want a certain zoom level for the map, select the Use zoom
level check box and adjust the desired level.
reload button to display
them. If you want a certain zoom level for the map, select the Use zoom
level check box and adjust the desired level.
GIS - Edit provides all controls and
capabilities of the GIS Editor including editing the sample plot. Select
a plot in the query list, then the map will be adjusted and a message
box will pop up according to the GIS - View mode. Press OK to add the
map and the plot to the sample list and display the geography:
Tutorial Properties
Tutorial - properties
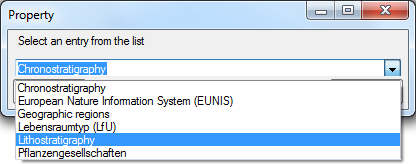
Some kinds of properties may be assigned to the selected sampling plot.
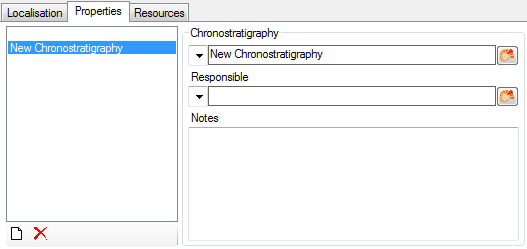
To add a new property for the selected plot click at the button. Select the desired kind of property from the
drop down list and press OK.
Press the button to open an
appropriate Diversity Workbench remote module for the property data.
To remove a property, select it and click at the button. The property will disappear from the list.
Finally press the item in the Query
toolbar to store the properties for the plot in the database.
Tutorial Query
Tutorial - query
To search for data in the database, use the query section in the left
part of the window. To select the query conditions, click on the
 button in the top panel. A window as shown below
will open.
button in the top panel. A window as shown below
will open.
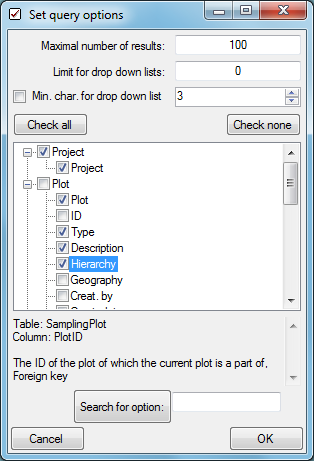
With the Maximal number of results, you can limit the paket size
that should be retrieved from the server. For a slow connection to the
database server choose a low value (e.g. 100 as set by default).
Select the desired entries, e.g.:
Click OK to close the window. Your query conditions will look like the
image below.
Within the query options you have several possibilities to specify your
search restriction. Use the drop down button  to
change between the operators.
to
change between the operators.
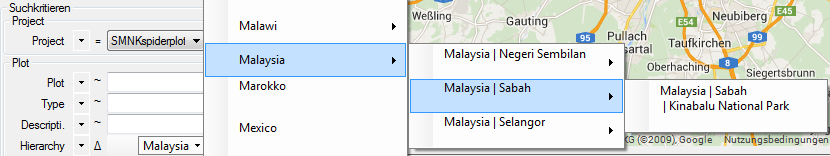
If the hierarchy operator Δ is selected, you may choose a desired
hierarchy node by clicking at the drop down box on the right. Then a
tree view of the current hierachy pops up, where you can select a given
node with the mouse:
After all query conditions are set, click on the  button to start the query. In the resultlist all plots will be displayed which
matches your query and the selected maximal number of results.
button to start the query. In the resultlist all plots will be displayed which
matches your query and the selected maximal number of results.
Tutorial Query Results
Tutorial - query results
Pressing the button will display all plots
in the list box which matches the query conditions and the selected
maximal number of results:
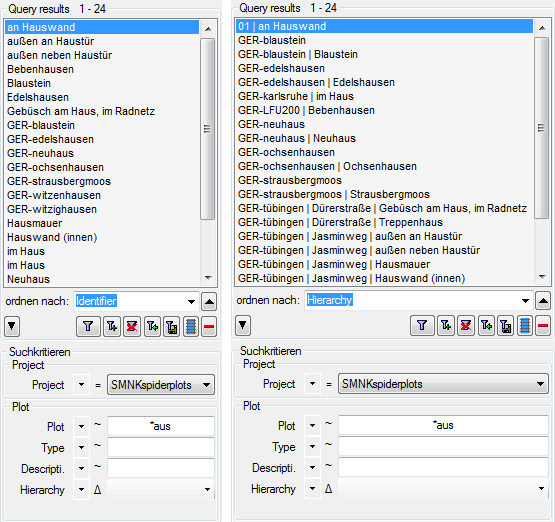
The kind of entries to be shown can be selected in the “order by” list
box. They may be the plot identifiers, the plot descriptions or the plot
hierarchy strings.
The data of the selected plot (identifier, description, ID, type, notes
etc.) is displayed right of the query area. If a geography has been
assigned, the place is shown on the map in the middle. The plot
identifier is marked with yellow background, embedded in the hierarchy
tree in the box below the map.
Tutorial Resources
Tutorial - resources
Resources (e.g. pictures) may be assigned to the selected sampling plot.
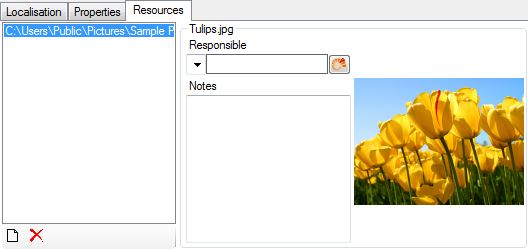
To add a new resource click at the button. A
browser will open where you can select and add the desired file.
Press the button to open the
DiversityAgents remote module, where you may select the responsible for
the resource data. Annotations may be entered in the Notes field.
To remove a resource, select it and click at the button. The resource will disappear from the list.
Finally press the item in the Query
toolbar to store the resource settings for the plot in the database.
Diversity Sampling Plots
Query
Once you are connected to your database, you can search across all data. A wide range of search options is available.
All functions related to querying can be found on the left-hand side of the main window.
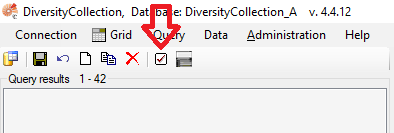
The upper part of the query section contains the list of all results, titled “Query Results”.
Below this, you will find a section containing all the buttons relevant to the search.
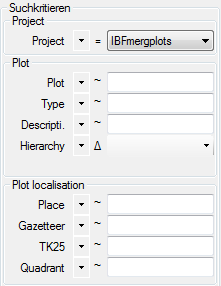
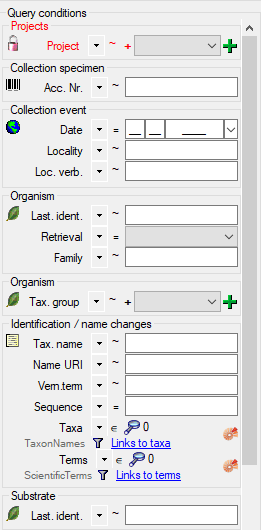
Below the query buttons, you will find the “Query Conditions” section. This is where you can enter all available search criteria.
Display the Entire Dataset
To display the entire dataset, start a search without specifying any criteria in the “Query conditions” section:
-
In the middle of the query section on the left-hand side of the main window, click on the “Filter” button.
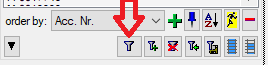
-
A list of the results will be displayed in the “Query Results” section. The number of results is shown above the list, next to the “Query Results” label.
Filter a Search
Below the query buttons, at the bottom of the query section, you will find the “Query Conditions”.
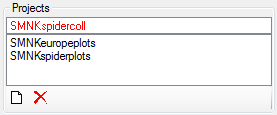
- Enter the filter criteria for your search. For example, you can select a project from the dropdown list.
- You can combine as many criteria as needed to narrow down your results.
- Start the query by clicking the “Filter” button .
- A list of results will be displayed in the “Query Results” section. The number of results is shown above the list, next to the “Query Results” label. If no results match the query, the list remains empty and the label “No match” is displayed.
Edit and Customise Query Conditions
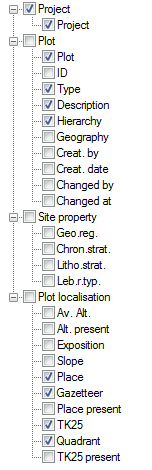
You can choose which query conditions are displayed in the main window, and you can change this at any time.
- At the top left, above the query results list, click the “Checkbox” button .
- Select any query conditions you want to use for your searches by selecting the respective checkboxes in the treeview.
Customise the Interface
Hide/Show the Entire Query Section
In the main window, go to the menu item Query → Show Query.
Hide the “Query Conditions” Section
On the left side of the “Query Buttons”, in the middle of the query section, click the “Arrow” button .
Switch Between Vertical and Horizontal Arrangement
You can change the layout of the query elements from vertical to horizontal and vice versa. To do this, click the button located below the main menu bar:
Edit the Result List
Add Results to the Existing List
You can add new results, based on different query conditions, to your current result list.
- Enter the new filter criteria for your additional search.
- Start the query and add the results to the existing list by clicking the button
 .
.
- The new results will be appended to the existing list.
Remove Result Items from the List
You can remove entries from your current result list:
- Select the entries you want to remove.
- Click the button .
Important This does not delete the data from the database. It only affects the current display in the results list.
Many Result Columns
The option to display a result list with many columns is described in the
chapter Many Columns.
Query Conditions
Remember the Last Query
By default, the values you entered for the previous query will be remembered. Your query criteria will be pre-filled when the programme starts. To change this behaviour, click the Pin button
 .
.
Query Annotation
The query for annotations differs from a standard query (see below).
In addition, you can specify the type of annotation (Annotation
 , Problem
  , Reference
 ) and the linked table (see
Annotation).
) and the linked table (see
Annotation).
Duplicates
Certain query condition fields allow you to add up to three duplicates of the same condition. For adding a ‘duplicate’ search criteria, click the green “Plus” button . Remove a ‘duplicate’ search condition with a click on the red “Minus” button . The restrictions can be combined with AND + and OR |. To switch between these modes, click the resp. + or | icon.
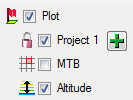
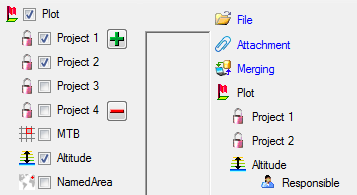
Query Modules
In the “Query Conditions” section, some values may be linked to other modules. For example, within the “Identification” group, the fields “Taxa” and “Terms” are linked to the “DiversityTaxonNames” and “DiversityScientificTerms” modules, respectively. You can also add “linked” values to your query condition.
- Select the operator that determines how the entries are used in the search. An explanation of all available operators can be found in the table below.
- To connect to the linked module, click the “Ammonite” button located to the right of the relevant query field.
- A query window for the linked module will open.
- Search for values within the linked module and click “Ok” to confirm your section.
- If you want to view a list of the selected items, click the Magnifying Glass button .
Info: There is also a detailed available, which explains all possible operators and how to use them.
| Operator |
Meaning |
Example |
| ∈ |
Search for entries with a list |
Rosa | Rosa caninia \ |
| ∉ |
Search for entries not within a list |
Rosa | Rosa caninia | ... |
+H  |
search for entry including lower hierarchy |
Picea | Picea abies | ... |
+S  |
search for entry including synonyms |
Picea abies | Pinus abies | ... |
+HS  |
search for entry including lower hierarchy and synonyms |
Picea | Picea abies | Pinus abies | ... |
|
Change filter mode between link and text |
http://tnt.diversityworkbench.de/TaxonNames_Plants/4269 <> Picea abies L. |
Videos
- Introduction on how to use the query conditions:
- How to use special query conditions:
- Tutorial on how to query modules:
- Tutorial on how to save a query:
.
Wildcards in SQL
There are 4 different possibilities for wildcards in SQL:
| Operator |
Description |
Example |
Result |
| % |
any string consisting of no, one or many characters |
Pinus % |
will find anything like Pinus, Pinus sylvestris, Pinus strobus etc. |
| * |
same effect as % (see above) |
|
|
| _ |
a single character |
Pinus s_lvestris |
will find Pinus sylvestris and Pinus silvestris etc. |
| […] |
any character out of a given range like [abcde] or [a-e] |
Pinus s[iy]lvestris |
will find Pinus sylvestris and Pinus silvestris |
| [^…] |
any character not in a given range like [^abcde] or [^a-e] |
Pinus s[^i]lvestris |
will find Pinus sylvestris but not Pinus silvestris |
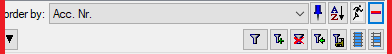
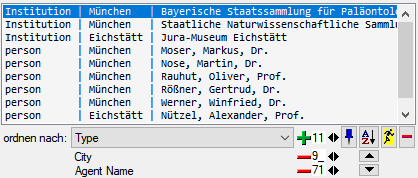
Many colunns
The option to include several columns in the result list is only
available for optimized queries  . To display
several columns in the result list, click on the
button next to the order by column (see below). A window will open where
you can select the next column for the sorting. Underneath the order by
column the second column for the sorting will be added. To remove this
sorting column you can click on the button. By
default the width for the columns is set to 10. You can change this
according to content. To set the width to the maximal length of the
current content, click on the
. To display
several columns in the result list, click on the
button next to the order by column (see below). A window will open where
you can select the next column for the sorting. Underneath the order by
column the second column for the sorting will be added. To remove this
sorting column you can click on the button. By
default the width for the columns is set to 10. You can change this
according to content. To set the width to the maximal length of the
current content, click on the  button.
To change the sorting of the added order column click on the
button. The colums are separated via "
| " as shown in the image below.
button.
To change the sorting of the added order column click on the
button. The colums are separated via "
| " as shown in the image below.
For an introduction see the videos:
- Mehrspaltige Suche:
- Sortierung:

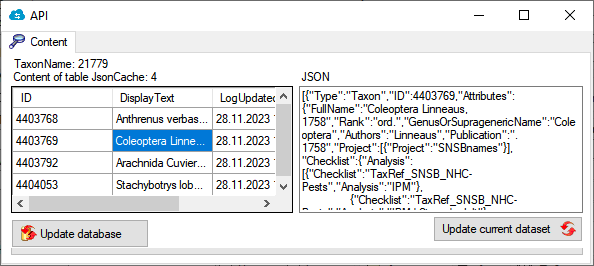
 New table JsonCache containing the data related to a plot as JSON. In the menu accessible via Administration →
  Inclusion of ExternalID for comparision in maintenance for links to DiversityScientificTerms
 Inclusion of hierarchy of location properties
 Bugfixes in Workbench.dll


 Module connections … Edit the connections to the other modules within the Diversity Workbench.
 Transfer previous settings Transfer the settings for IP-Address and port of the server, name of the database, login etc. of a previous version of the client to the current version.
 Quit Quit the application and stop all processes started by the application
 Backup database … Creating a backup of the currently connected database
 Replication Synchronise the content of 2 databases
 Add publisher … Define a publishing database
 Download … Download data from the data provider and server respectively in your local database
 Merge … Merge data between the data provider and server respectively and your local database
 Upload … Upload data from your local database to the replication provider and server respectively
 Clean database … Clean your local database
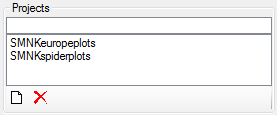
 Projects … Administration of the projects
 Logins … Administration of the users and their permissions in the database
 Rename database … Rename the currently connected database
 Documentation … Documentation of the structure of the database
 Database tools … Database tools
 Update database … Update to a new available database version
 Update client … Update to a new available client version
 Manual Opens the online manual
 Feedback … Opens a window for sending feedback
 Feedback history… Opens a window for browsing former feedback
 DiversitySamplingPlots.exe in the directory where you copied the files
of DiversitySamplingPlots. The main window will open.
DiversitySamplingPlots.exe in the directory where you copied the files
of DiversitySamplingPlots. The main window will open.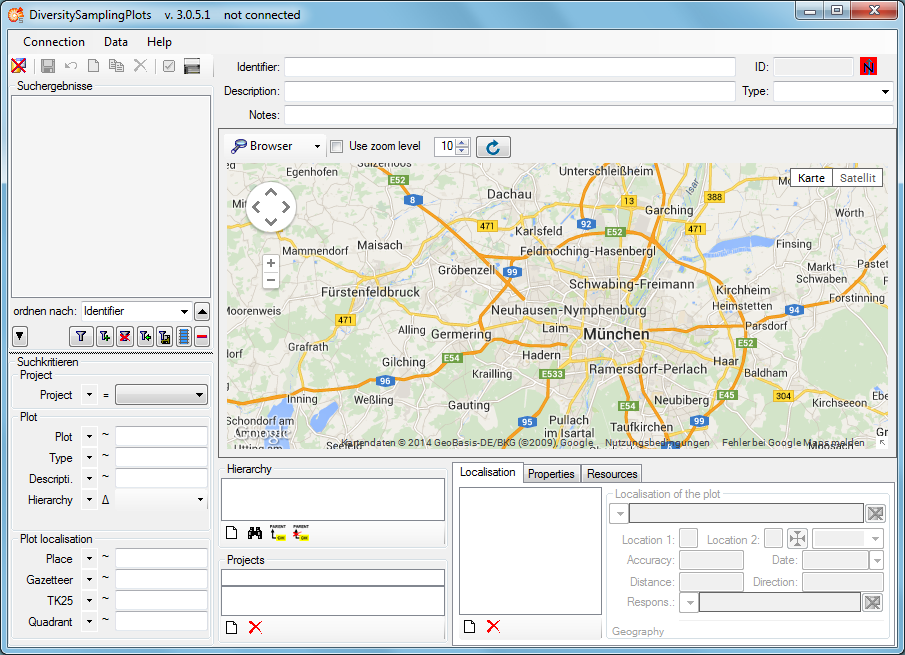


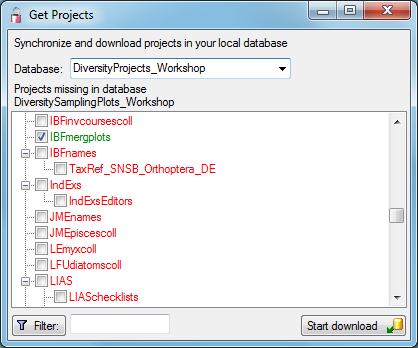
 DiversityProjects.exe and
access to the database DiversityProjects. If DiversityProjects is not
available you can create a new project with the Administration -
DiversityProjects.exe and
access to the database DiversityProjects. If DiversityProjects is not
available you can create a new project with the Administration -


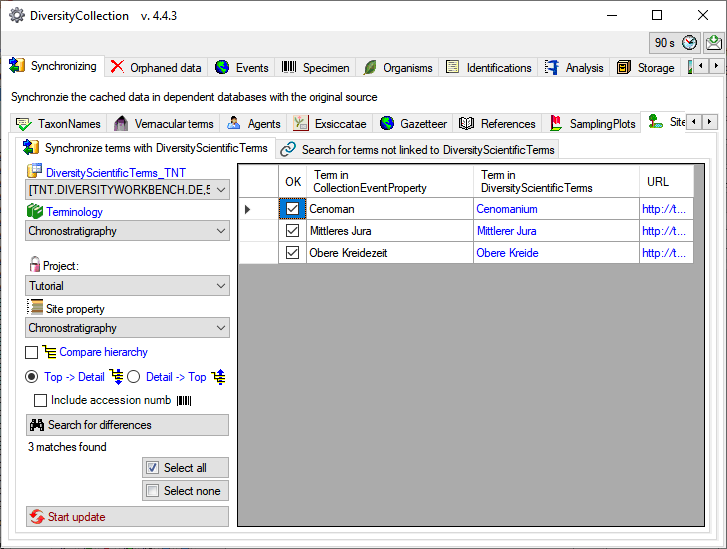
 or
or  . As shown below 2 more columns will be
included, containing the hierarchies in DiversitySamplingPlots and DiversityScientificTerms.
. As shown below 2 more columns will be
included, containing the hierarchies in DiversitySamplingPlots and DiversityScientificTerms. 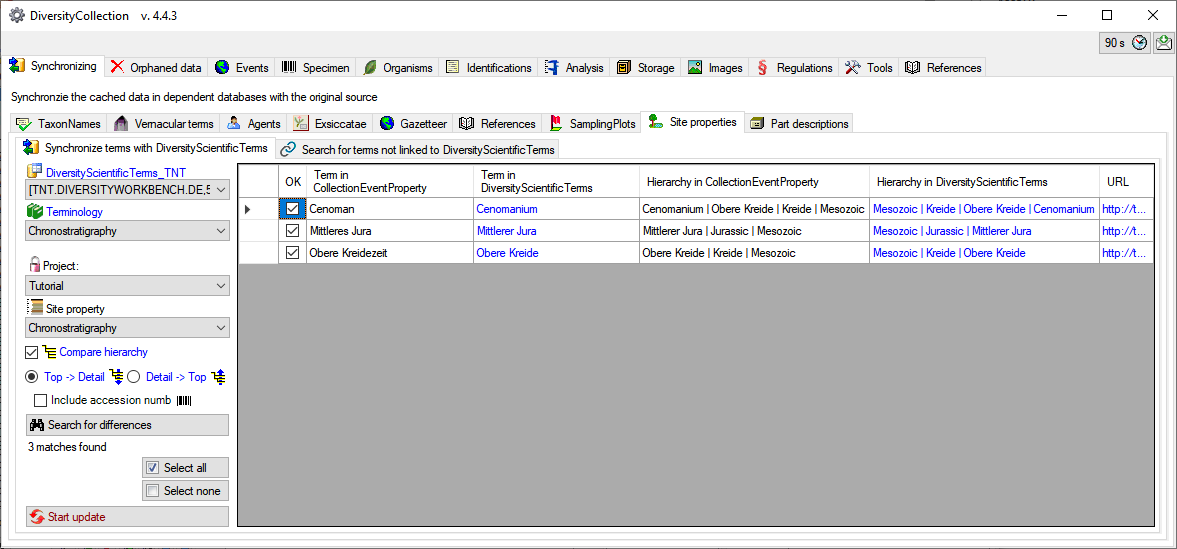
 for terms
corresponding to terms in DiversityScientificTerms (see below) click on the
for terms
corresponding to terms in DiversityScientificTerms (see below) click on the
 will split the data according to the specimen
as shown below. With this option set, you can inspect the content of
single specimen in the list using the
will split the data according to the specimen
as shown below. With this option set, you can inspect the content of
single specimen in the list using the 
 Select
none. To update the database click on the
Select
none. To update the database click on the  [Start
update] button.
[Start
update] button.