Subsections of Modes
GIS Editor
Map Mode
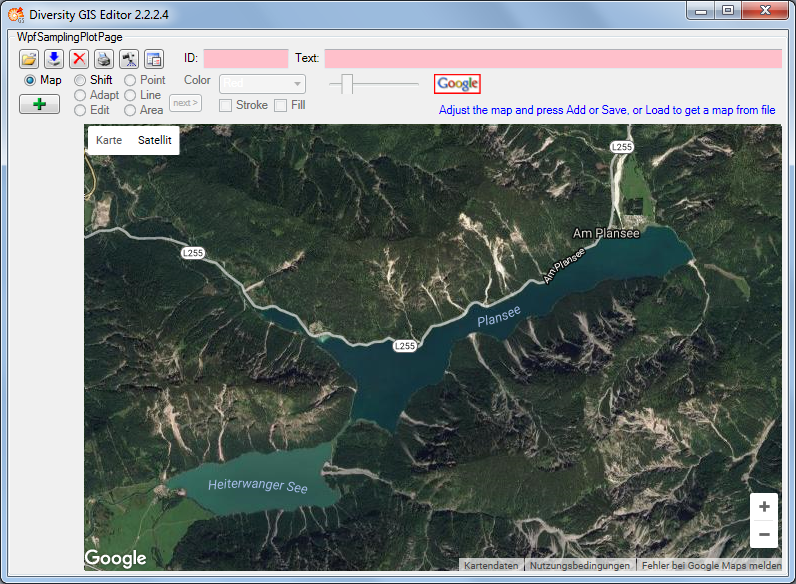
In Map mode the editor connects via Internet to the SNSB Google Maps
service or alternatively to the Open Street Maps service, regarding on
the GIS-Editor Settings, and displays an online
map which can be moved, zoomed and switched as usual. The status area
shows the  or
respectively the
or
respectively the
 symbol. The
size of the map area adapts to the size of the working area, even when
resizing the window.
symbol. The
size of the map area adapts to the size of the working area, even when
resizing the window.
In case of Google the controls for moving, zooming and map type are
displayed by default. The overview window in the bottom right corner can
be switched manually. The map can be adjusted to the user’s needs as
follows:
- Select map area: Press and hold left mouse button and move the mouse
- Zoom map: Turn the mouse wheel (if any), double click (left or right
mouse button) on a location
- Switch map type: Use Google map type control
- Hide Google controls: Click right mouse button to hide, left mouse
button to show them again
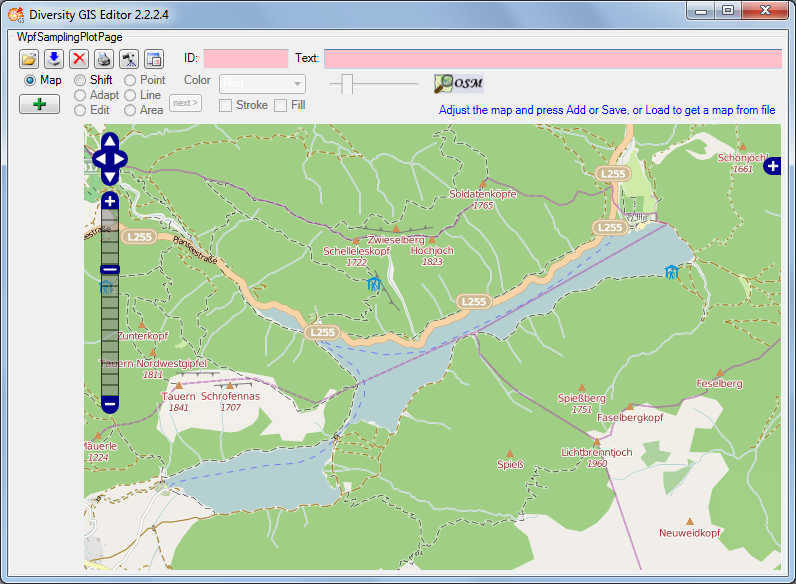
In case of Open Street Maps the pan and zoom control is displayed by
default. It can be switched off or on by clicking the left mouse button
anywhere within the map area. The layer switch control is hidden and can
be opened by pressing the  or closed
again by pressing the
or closed
again by pressing the  button on the
right side. The map can be adjusted to the user’s needs as follows:
button on the
right side. The map can be adjusted to the user’s needs as follows:
- Select map area: Press and hold left mouse button and move the mouse,
or use the OSM pan control
- Zoom map: Turn the mouse wheel (if any), double click (left mouse
button) on a location or use the OSM zoom control
- Switch map type: Open the layer switch and select a layer
- Hide or show pan and zoom control: Click left mouse button to toggle
the control
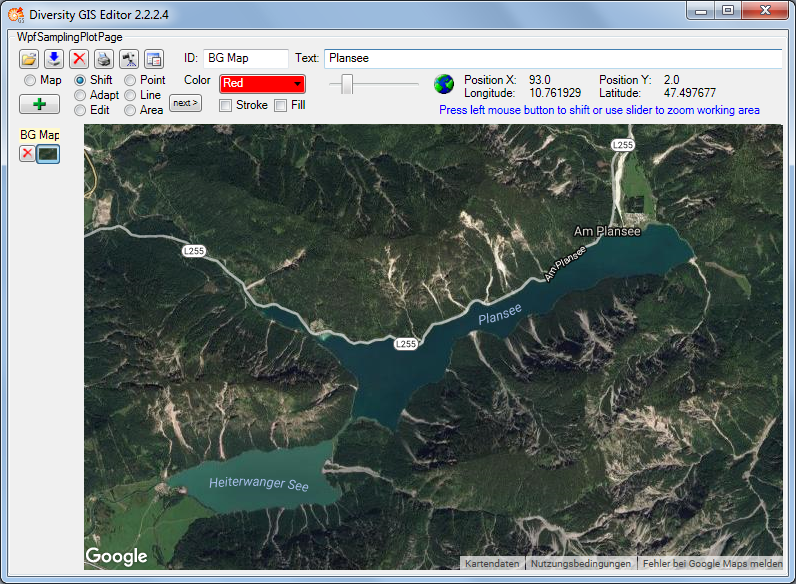
If an appropriate area has been selected, just press the Add button
 , then the area will be scanned and added to
the Sample List as a reference map. A little image of the map will
appear on the toggle button in the Sample List. The controls should be
switched off before adding to get a neat map image.
, then the area will be scanned and added to
the Sample List as a reference map. A little image of the map will
appear on the toggle button in the Sample List. The controls should be
switched off before adding to get a neat map image.
Then the mode will be switched to Shift mode automatically and the
status symbol will change to
 indicating
that world coordinates are present. The screen and world coordinates
will be shown in the status lines if the mouse is moved over the map
surface.
indicating
that world coordinates are present. The screen and world coordinates
will be shown in the status lines if the mouse is moved over the map
surface.
The maps are subject to the Mercator projection, which is the GIS
Editor’s precondition for every bitmap used as a reference map. While
the screen coordinates are linear in horizontal and vertical direction,
the world coordinates are non linear in vertical direction.
GIS Editor
Shift Mode
This is the quasi default mode of the GIS Editor. The cursor changes to
a move shape  when touching the
background map. The map is “frozen” and exists as an image sample on the
sample list. Changing the map region or resolution is no longer
possible. But the Shift Mode provides 2 features:
when touching the
background map. The map is “frozen” and exists as an image sample on the
sample list. Changing the map region or resolution is no longer
possible. But the Shift Mode provides 2 features:
- Move the working area
- Zoom the working area
Moving the working area
Press and hold the left mouse button and move the mouse to shift the
working area within the display window. This is useful when having
loaded a map from a storage unit which is larger than the GIS Editor’s
window, or in combination with zooming the working area.
Zooming the working area
Place the mouse cursor at the slider control, press and hold the left
mouse button and move the control left to zoom out or right to zoom in
the working area. The range of the zoom is from factor 0.6 to 3.0. The
current value is displayed beneath the zoom control. Double click the
slider control to reset the zoom to default value 1.0.
Enlarging the working area makes it more easy to place objects
precisely. The relevant area then could be selected by moving the zoomed
working area. Downsizing the working area gives an overview of large map
regions.
Note that the resolution of the map itself does not change any more when
zooming in. But objects on the map are created in vector graphics, so
the markers, lines or areas will remain sharp and clear while zooming.
And they will adapt there thickness smoothly to the size.
GIS Editor
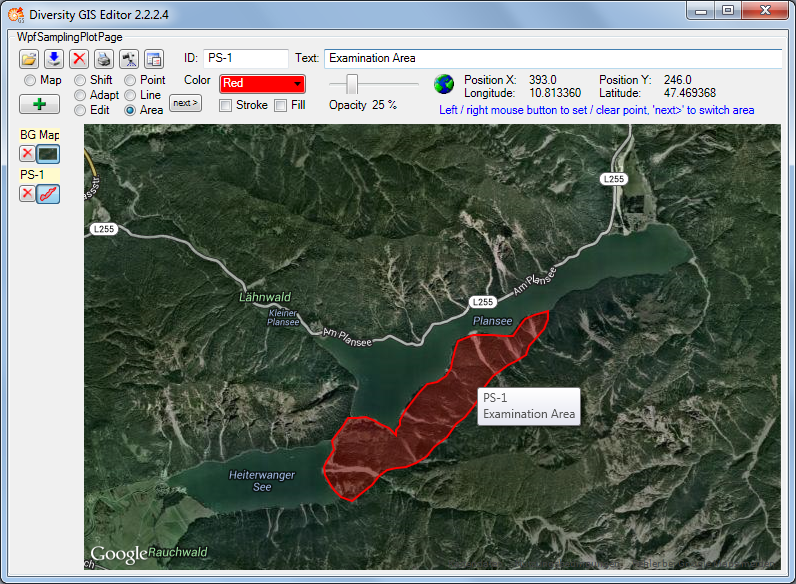
Area Mode
This mode is used to create areas (polygons) on the background map. The
cursor changes to a cross line when touching the background map. Each
click on the left mouse button sets a new point of the polygon. Every
click on the right mouse button clears the last point set. The closed
polygon defined by the points is displayed completely at any time. When
holding the left mouse button the point can be placed while the lines of
the polygon are shown as a “rubber band” display.
To create more than one area for a sample, just click the
 button. This will finish the current
polygon and start another one. It could be repeated without limitation
of the number of polygons.
button. This will finish the current
polygon and start another one. It could be repeated without limitation
of the number of polygons.
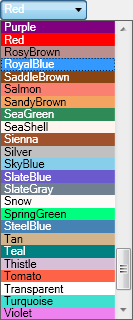
Setting the color
The areas are created as filled polygons, this means they have a border
line (stroke) and a filling. The color of stroke and filling can be set
independently or simultaneously by clicking the appropriate check boxes
beneath the Color list box. Clicking on the list box will open a drop
down menu with the complete set of 141 predefined brushes. Use the
scroll bar to navigate to the preferred color and select it with the
left mouse button.
Setting the transparency
Besides the color the transparency of the area could also be set for
stroke and filling. In each edit mode the slider control is used for
that. The area stroke or filling changes smoothly from invisible at the
left till completely opaque on the right slider position. The value
beneath the slider control indicates the opaqueness in a range from 0%
to 100%. The default settings are 100% for stroke and 25% for filling.
Before adding the polygon to the Sample List an Identifier (ID) and a
Description (Text) should be written to the text boxes in the control
panel.
Clicking the Add button will put the
current area(s) as one sample into the Sample List. The toggle button
will show a small picture of the first area of the sample. The ID will
be displayed above the button. Furthermore a tool tip will be created
for the sample holding the ID and Description, which will pop up when
moving the mouse over the toggle button or over the polygon in the
working area.
GIS Editor
Line Mode
This mode is used to create line strings on the background map. The
usage is adequate to the Area Mode. The cursor
changes to a cross line when touching the background map. The points of
the line strings can be set or cleared by clicking the mouse buttons.
Clicking the button will switch to the
next line string for the sample. The distance of the last drawn line
string section is displayed beneath the status area.
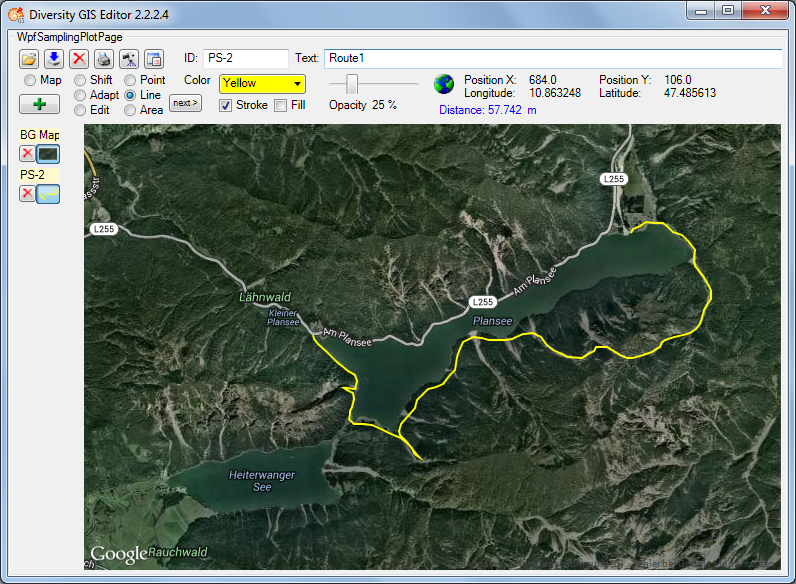
Color and transparency can be set for the line strings using the
appropriate controls, but only for stroke, because the line strings do
not have a filling. Thus checking the Fill box will have no effect.
After adding the lines to the sample list a small picture of the first
line string will appear on the toggle button.
GIS Editor
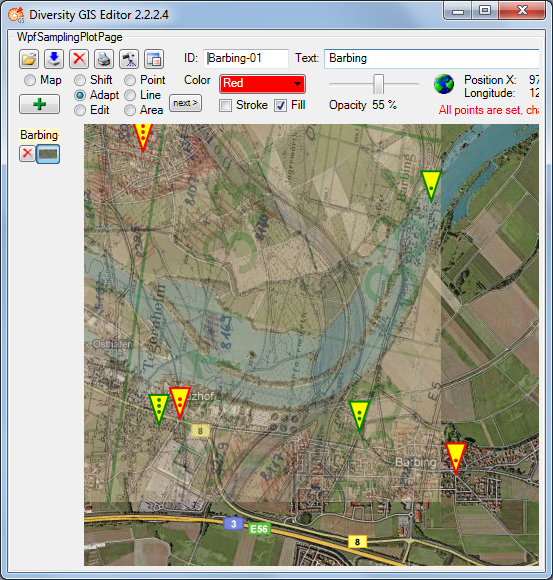
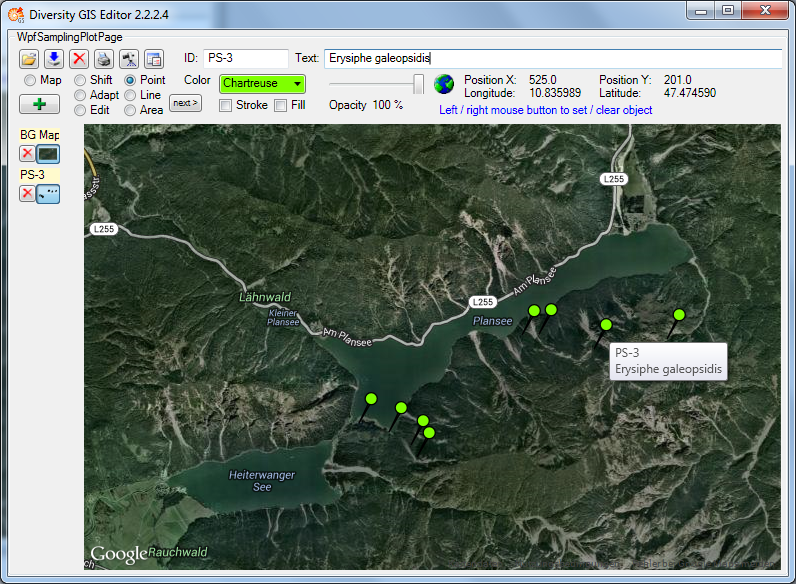
Point Mode
This mode is used to create Points (object markers) on the background
map. The usage is similar to the Area Mode. The
cursor changes to a cross line when touching the background map. The
object markers can be set by clicking the left mouse button, clicking
the right mouse button will clear the last markers one by one again. The
button has no impact, because each Point
represents a complete object and needs not to be finished before
creating the next one.
The shape of the object markers can be selected from a number of
predefined Point symbols and icons within the Settingswindow, e.g.:
|
|
| Pin: |
 |
| Diamond: |
 |
| Needle: |
 |
| Cross: |
 |
| Pyramid: |
 |
| X: |
 |
| Cone: |
 |
| Square: |
 |
| Questionmark: |
 |
| Circle: |
 |
| Minus: |
 |
| Myxomycete: |
 |
| Fungus: |
 |
| Lichen: |
 |
| Bryophyt: |
 |
| Plant: |
 |
| Evertebrate: |
 |
| Mollusc: |
 |
| Assel: |
 |
| Insect: |
 |
| Echinoderm: |
 |
| Vertebrate: |
 |
| Fish: |
 |
| Reptile: |
 |
| Bird: |
 |
| Mammal: |
 |
Color can be set for the symbol markers using the appropriate controls.
It depends on the selected point symbol, whether it just has a stroke
(e.g. “Cross”) or also a filling (e.g. “Pin”). Transparency can be set
for both, the symbol and icon markers. The stroke thickness and the size
of the markers can be set in the Settings menu.
After adding the object markers to the sample list a small picture of
the collection will appear on the toggle button.
GIS Editor
Edit Mode
This mode is used to modify all samples (objects and images) which are
currently visible on the working area. It applies to the elements of
the Sample List as well as to the current sample.
Changing the position or shape of objects (points, line strings, areas)
To change an object one has to move the vertices (“corner points”) which
are defining it. To do so just move the mouse close to a vertex to
localize it. As soon as the corner has been grabbed the cursor changes
its shape to a hand symbol  .
.
Now press the left mouse button and hold it, then move the mouse to
change the position of the vertex accordingly. The shape of the object
or the marker will change in the same manner. Release the mouse button
when the preferred position has been set.
Note that areas and line strings cannot be moved in total while keeping
their shapes!
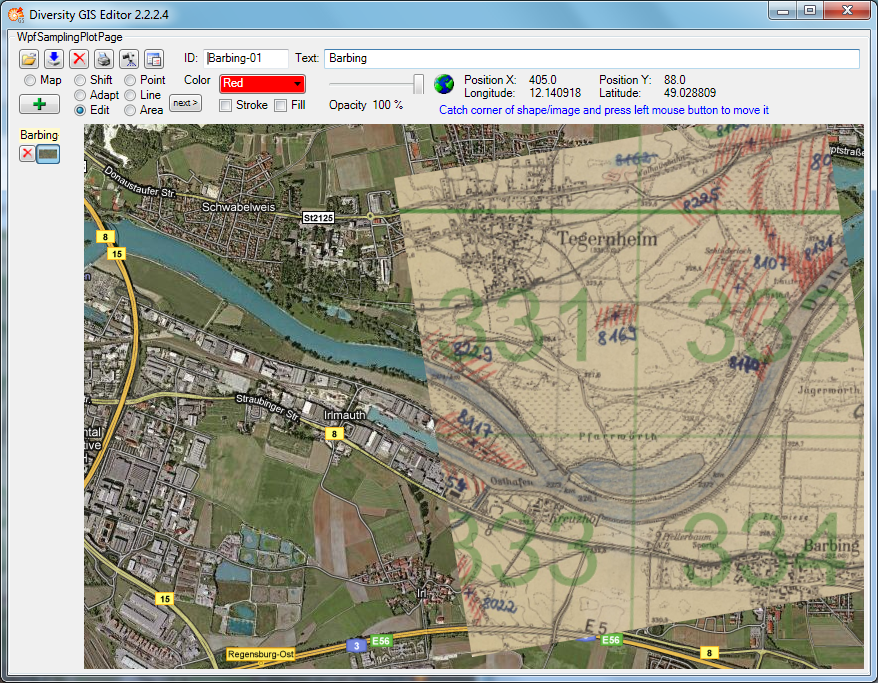
Changing the position or shape of images (maps)
Images (e.g. maps) can be moved completely (keeping their aspect ratio),
scaled in horizontal and vertical direction and skewed within an affine
transformation. Editing an image can be divided into 4 stages by
grabbing and moving the following corners:
- Top-left: Moving the total image by keeping its aspect ratio
- Bottom-right: Squeezing or stretching the image horizontally and
vertically
- Bottom-left, top-right: Skewing the image in an affine way by
keeping the corner points top-left and bottom-right at its positions
- Bottom-right again: Skewing the image in an affine way by keeping
the corner points top-left and bottom-left at its positions
Stages 1 to 4:
Changing color and transparency
Color and transparency can be set independently (or simultaneously) for
the objects using the appropriate controls and check boxes for Stroke or
Fill. The setting will affect all visible objects, so objects which
should not be changed have to be switched off before with their toggle
buttons. The color of images could not be changed, of course, but the
transparency can be set if the Fill box is checked. The transparency of
the background map cannot be changed.
GIS Editor
Adapt Mode
Essential for visualizing Geographical Objects is a background map with
world coordinates. The GIS Editor’s Map mode offers a convenient way to
create such a map, but it is restricted for the use of Google or OSM
maps which are present in the web and are providing world coordinates.
It would be nice to load scans of e.g. topographical or even historical
maps into the working area and use them as background maps, but the
problem is how to assign world coordinates to them.
The Adapt mode solves this in an easy way by executing the following
steps. As a precondition a background map having world coordinates (e.g.
a Google map) must be present which covers the area of interest of the
new map to be referenced.
-
Load the new map image using the Load button
 . The image will be placed top
left inside the working area.
. The image will be placed top
left inside the working area.
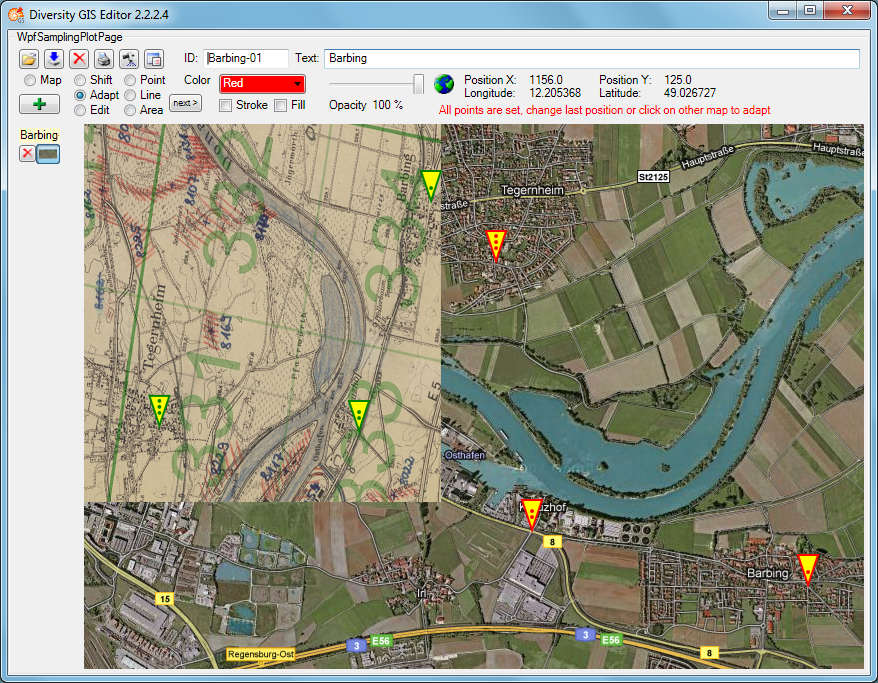
-
Select Adapt mode by checking the Adapt radio button. The cursor
changes to a pointer symbol  having a green border when touching the new image and having a red
one when touching the background map.
having a green border when touching the new image and having a red
one when touching the background map.
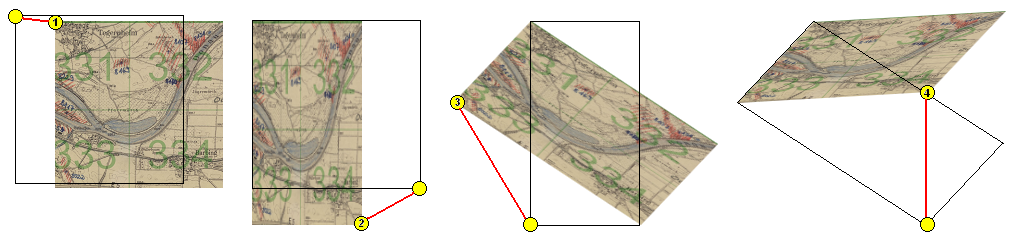
-
Now 3 reference points must be set alternately on background and new
map to assign the appropriate locations (e.g. distinctive landmarks
like road crossings). The last point can be modified as long as the
map is not changed. The cursor always tells you what reference point
will be set, according to its color and the number of dots in the
middle:


Note: It is reasonable to select distant points close to the edges
of the new map, because this will give more accurate results.
-
When all reference points have been set and the cursor touches the
alternate map, it changes to the finished shape
 . The next click will place
the new map into the appropriate background map area.
. The next click will place
the new map into the appropriate background map area.
The adapted image has been transformed to fit into the current world
coordinates of the background map. Now the new map can be added to the
sample list by pressing the Add button .
When it is finally saved to disk by pressing the Save button
 , the new assigned world coordinates will
be saved, too, in an XML file with the same name (see SaveSamples).
, the new assigned world coordinates will
be saved, too, in an XML file with the same name (see SaveSamples).
Sometimes it is difficult to place the new map and the reference map
side by side, because the window is too small, and zooming out would
blur the details needed for setting the reference points. If the new map
covers the background map, the reference points can be set anyway
Note: The Fill box must be checked to change the transparency of the
new map. The background map’s transparency cannot be changed.