Diversity Collection

Distribution maps
If WGS84 coordinates are available for your collection sites, you can
create distribution maps of your samples in the database. To use this
service you need access to the internet. Choose
Map in the header to show the maps. To
display distribution maps choose the
appropriate option from the first drop down list in the mapscontrol.
To add data sets to the distribution search for the data sets you want
to see in the map, mark them in the list (either use the  button to mark all data sets, mark a
list/single data sets or check the
button to mark all data sets, mark a
list/single data sets or check the  option for the distribution map) and click
the
option for the distribution map) and click
the  add button. To display the map click on the
  button. The displayed localities in the map will
not change until you add new localities or click the button to start with a new distribution map. If
you want to set different icons for the positions of different series of
your samples, set the style of the icon (symbol, color, size etc.) in
the menu before you add them to the distribution list.
button. The displayed localities in the map will
not change until you add new localities or click the button to start with a new distribution map. If
you want to set different icons for the positions of different series of
your samples, set the style of the icon (symbol, color, size etc.) in
the menu before you add them to the distribution list.
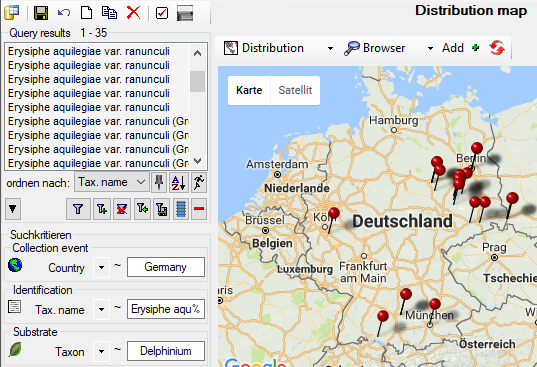
To show a distribution map of all the specimens found in your query as
shown below, select the option
Distribution from the drop down menu. For the display in the map you
can choose either the  Browser (see below) or
the
Browser (see below) or
the  GIS-Editor. In
the browser all objects will be shown with their center coordinates and
the number of specimens that can be depicted is limited, thus, it may be
necessary to restrict your query. With the GIS editor all objects will
be shown with their whole geography (e.g. an area will not be reduced to
its central coordinates) and there is no limit to the number.
Furthermore you can vary the symbols for different groups.
GIS-Editor. In
the browser all objects will be shown with their center coordinates and
the number of specimens that can be depicted is limited, thus, it may be
necessary to restrict your query. With the GIS editor all objects will
be shown with their whole geography (e.g. an area will not be reduced to
its central coordinates) and there is no limit to the number.
Furthermore you can vary the symbols for different groups.
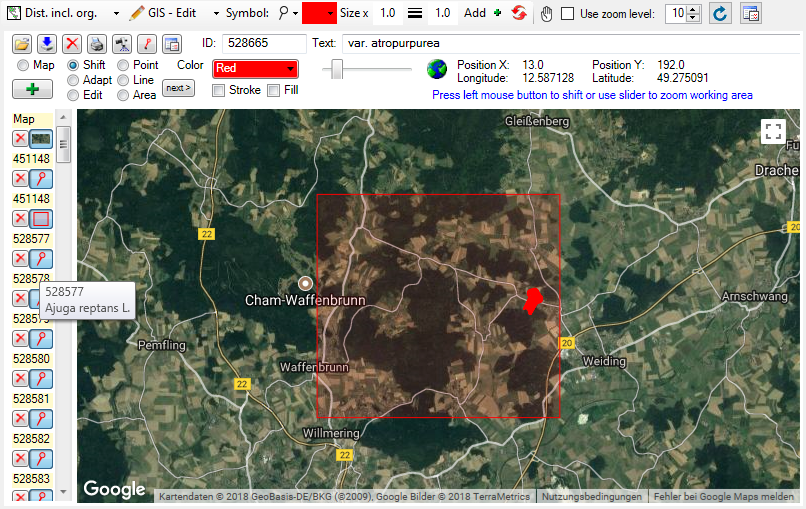
The upper distribution map is restricted
to coordinates of the collection event  . If
you want to include coordinates from the organisms
. If
you want to include coordinates from the organisms
 , choose the distribution map including organisms
 . For the positions of the
organisms in this map, the ID of the organism ( = IdentificationUnitID,
528577 in example below) is shown as identifier and the last
identification ( = LastIdentificationCache) as display text (Ajuga
reptans L. in example below).
. For the positions of the
organisms in this map, the ID of the organism ( = IdentificationUnitID,
528577 in example below) is shown as identifier and the last
identification ( = LastIdentificationCache) as display text (Ajuga
reptans L. in example below).
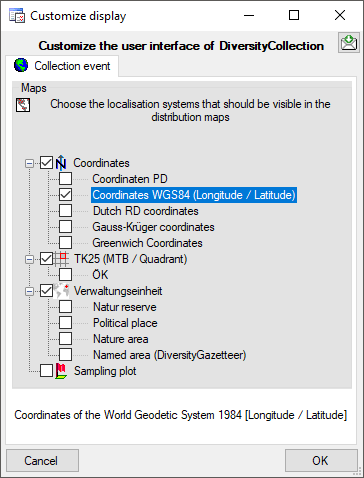
If you want to restrict the display to the organisms, click on
the  button to open the window for custimizing
the display (see below) and deselect all localisation systems for the
collection event.
button to open the window for custimizing
the display (see below) and deselect all localisation systems for the
collection event.
While in the GIS tool the objects are represented with their real
geography (see above), in the browser every object is reduced to a
single point. For an introduction see a short tutorial
 .
.