Diversity Collection
Grids
To edit the data in a data grid, select Grid mode
 for the specimen
 , the organisms
 , the parts
 , the images
 the collection events
 or the collection event series
 from the menu. A window will open where
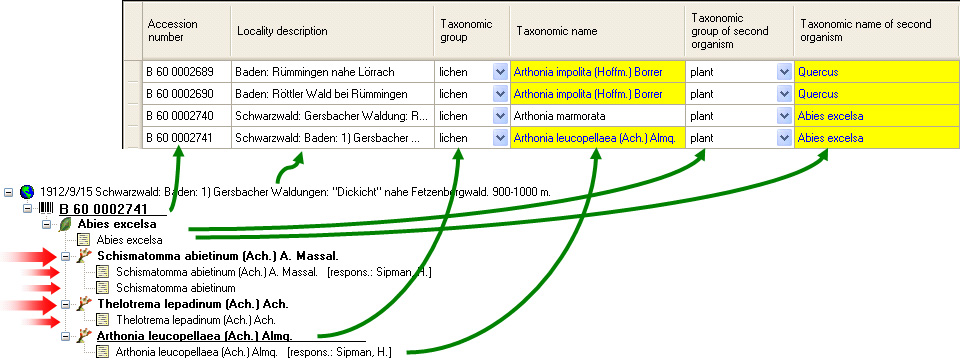
each dataset from the query result list is represented in a single line for
a specimen, an organism, a CollectionEvent or a CollectionEventSeries
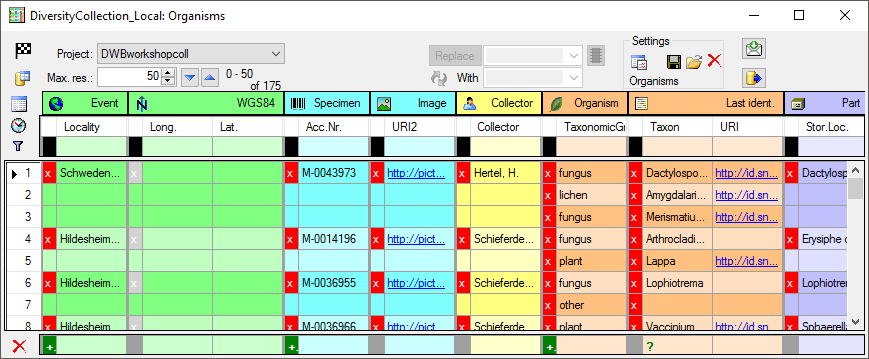
respectively. Please note that in this view, only a limited part of the
data is visible. For example, only the most recent identification of an
organism is displayed. This is shown in the image below,
where two organisms (marked with red arrows) are not visible in
the grid view because only the latest identification per organism is shown.
from the menu. A window will open where
each dataset from the query result list is represented in a single line for
a specimen, an organism, a CollectionEvent or a CollectionEventSeries
respectively. Please note that in this view, only a limited part of the
data is visible. For example, only the most recent identification of an
organism is displayed. This is shown in the image below,
where two organisms (marked with red arrows) are not visible in
the grid view because only the latest identification per organism is shown.
When using grid mode for organisms, all organisms will appear, but only with their most recent identification.
Customise column headers
The names of the columns can be changed using the
database description.
Customise fiel visibility
The selection of the visible fields can be adjusted in the tree above the
list. Change the selection of the columns and click on the Set columns button.
Customise column width and sequence
To adjust the width of the columns or the height of the rows, either drag
the border with the mouse or double-click on the border to obtain the optimum
size for a column. You can also click the  button for the optimal height of the rows or the
  button for the optimal width of the columns. To change the
width and sequence of the columns, drag the
columns to the position of your choice or adjust the width to your
preference. These changes will be saved for this session and
the next time you use grid mode. To return to the original sequence
of the columns, click the Reset sequence button.
button for the optimal width of the columns. To change the
width and sequence of the columns, drag the
columns to the position of your choice or adjust the width to your
preference. These changes will be saved for this session and
the next time you use grid mode. To return to the original sequence
of the columns, click the Reset sequence button.
Sorting the data
To sort the data in the grid, click in the header of the column
you want to use as the sorting column. The sort will persist
even if you change values in that column. This means that if you change
a value in the sort column, the changed record will be placed in
the new position according to its new value. The sorting of a column
is indicated by an arrow indicating the direction of sorting (up or
down) and by a thicker right margin of that column (see image below).
Find and replace
To use the find and replace functions, you must either select several fields in this column or click the  button to select the whole column. You can then select the function you
wish to use (remove, insert, append or replace). To replace a part of
the text in the selected fields, type the text to be replaced
and type the replacement in the appropriate fields. To start the
replacement, click on the
button to select the whole column. You can then select the function you
wish to use (remove, insert, append or replace). To replace a part of
the text in the selected fields, type the text to be replaced
and type the replacement in the appropriate fields. To start the
replacement, click on the  button. To insert a
string to the beginning of all entries in the selected fields, click
the
button. To insert a
string to the beginning of all entries in the selected fields, click
the  button. To append a string to all entries
in the selected fields, click the
button. To append a string to all entries
in the selected fields, click the  button. To
remove all entries from the selected fields, click the
button. To
remove all entries from the selected fields, click the  button.
Transfer from spreadsheet
You can transfer data from a spreadsheet, such as Excel or Calc. Copy the
relevant columns from your spreadsheet and paste them into
DiversityCollection. Click in the top-left cell where the data
should be inserted, then open the context menu (click the right mouse
button) and select Insert to paste the data.
Editing
Some columns cannot be edited directly, but are linked to external
modules or services. These columns are displayed as buttons. Click on
the button to access the service. If a value is linked to an entry in an
external module, the background will change to
[yellow], and the text will no longer be editable.
Together with the links (as shown in the example above [Link to
DiversityAgents]), you can also select columns that
allow you to remove links to modules (e.g.
[Remove link for collector] in image above). These
columns appear as buttons  . Simply
click on the button associated with a link to remove the connection to the
corresponding module. After doing so, you can edit the text field containing
the previously linked value.
. Simply
click on the button associated with a link to remove the connection to the
corresponding module. After doing so, you can edit the text field containing
the previously linked value.
Some values are linked to a predefined list of options. To change such a value, use the drop-down list available in the column.
New dataset
If you click on the empty line at the base of the data grid, you will be
asked if you wish to create a new dataset. The program will ask you for
a new accession number and the project of the new dataset. Another way
to create a new dataset is to use the copy button  . Simply
click on the row you wish to create a copy of and then click on the
copy button . For details see the Data
section. A copy of the dataset will be inserted at the base of the data
grid.
. Simply
click on the row you wish to create a copy of and then click on the
copy button . For details see the Data
section. A copy of the dataset will be inserted at the base of the data
grid.
Saving the data
To save all changes, click the  button. To undo
all changes since the last time the datasets were saved, click the
button. To undo
all changes since the last time the datasets were saved, click the  button. To save the changes to the current dataset
use the
button. To save the changes to the current dataset
use the  save button. To undo the changes in the
current dataset, click the
save button. To undo the changes in the
current dataset, click the  undo button. If you click
the OK button, you will be asked if you want to save the changes before
the window closes. If you click the Cancel button or close the window, your changes will not be
saved. To export the data displayed in the grid as a text file with tabs as
column separators, click on the
undo button. If you click
the OK button, you will be asked if you want to save the changes before
the window closes. If you click the Cancel button or close the window, your changes will not be
saved. To export the data displayed in the grid as a text file with tabs as
column separators, click on the  export button.
Subsections of Grids
Diversity Collection
Grids
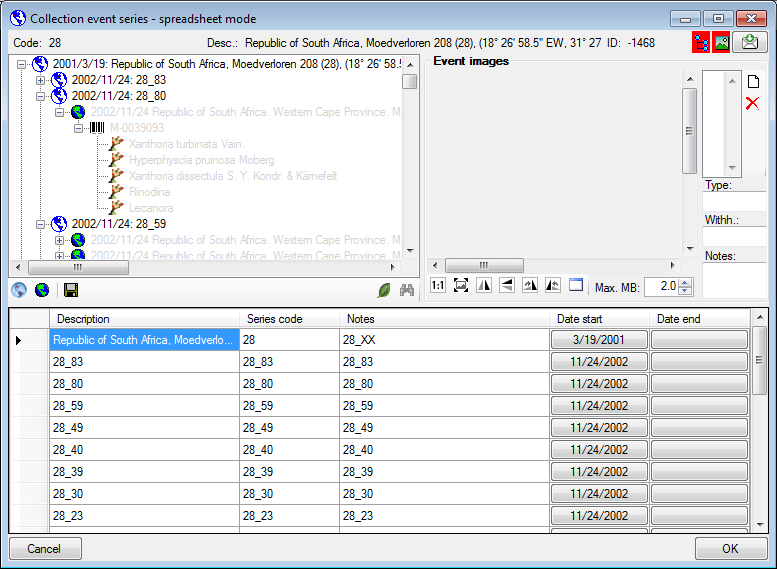
Collection Event Series
To edit the data in a data grid choose the Grid mode
for the CollectionEventSeries
from the menu. A window will open where
every data set for a CollectionEventSeries from the query result list is
restricted to one line (see below).
Customize the window
To change the width of a column simply use your mouse to adapt the width
to your preference. To hide or show parts of the window use the  button for the hierarchy tree and
the
button for the hierarchy tree and
the  button for the images in the upper right corner
of the window. If the parts are shown, the icon will have red background
e.g.
button for the images in the upper right corner
of the window. If the parts are shown, the icon will have red background
e.g.  .
.
History and feedback
To inspect the history of a data set click on the  button. A window will open as described in the
History chapter. To send a feedback use
the
button. A window will open as described in the
History chapter. To send a feedback use
the  button. Details are described in the
Feedback chapter.
button. Details are described in the
Feedback chapter.
Sorting of the data
To sort the data in the grid simply click in the header of the column
which you want to use as sorting column. The sorting sequence will be
kept even if you change values in this column. This means if you change
a value in the sorting column, the changed data set will be placed at
the new position according to its new value. The sorting of a column
will be indicated by an arrow for the direction of the sorting (up or
down) and by a thicker right border of this column (see image below).
Handling the data
To save the changes click on the save button. To insert
new data sets use the button for a
CollectionEventSeries and the button for a
CollectionEvent.
Diversity Collection
Grids
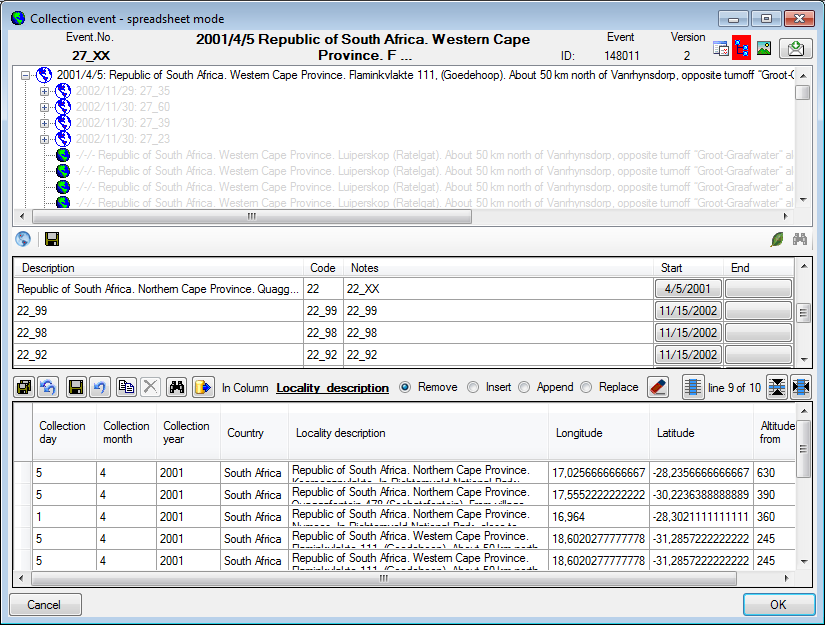
Collection Event
To edit the data of the CollectionEvents in a data grid choose the
Grid mode for the event
from the menu. A window will open where every data
set for a CollectionEvent from the query result list is restricted to
one line. Please keep in mind you can only see a limited part of the
data while in this view. For example only a part of the localisation
will be displayed (see below).
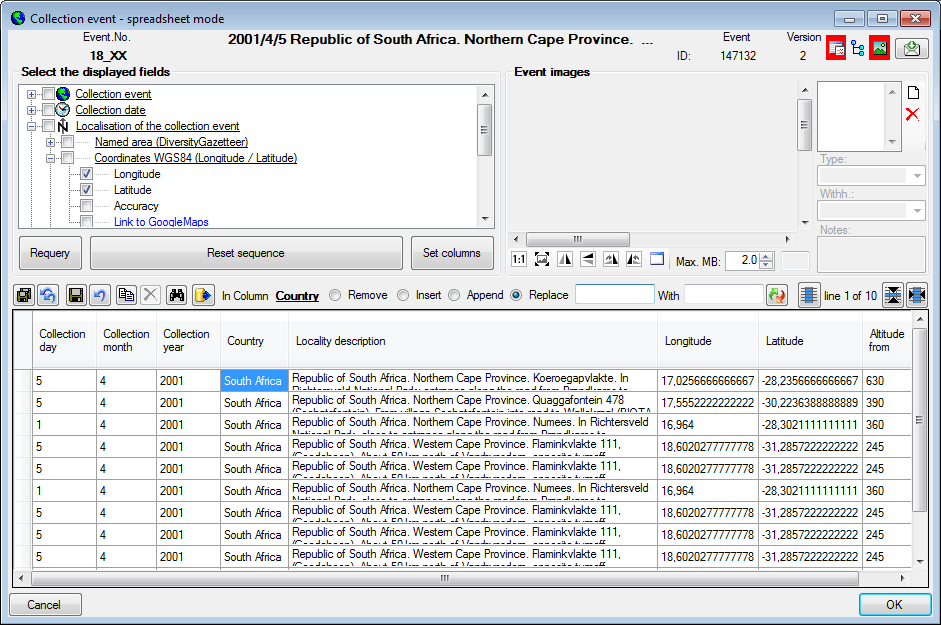
Customize the window
To change the width of a column simply use your mouse to adapt the width
to your preference. To hide or show parts of the window use the  button for the setting of the visible columns,
the button for the hierarchy tree
and the button for the images in the upper right
corner of the window. If the hierarchy tree is visible
(, see below), you have access to
the CollectionEventSeries which are linked to the CollectionEvents. Here
you can edit the hierarchy via drag & drop. Please keep in mind that
ramifications within the hierarchy can only be realized using
EventSeries with CollectionEvents
placed within and specimen
button for the setting of the visible columns,
the button for the hierarchy tree
and the button for the images in the upper right
corner of the window. If the hierarchy tree is visible
(, see below), you have access to
the CollectionEventSeries which are linked to the CollectionEvents. Here
you can edit the hierarchy via drag & drop. Please keep in mind that
ramifications within the hierarchy can only be realized using
EventSeries with CollectionEvents
placed within and specimen
 placed within the CollectionEvents. To insert a
new EventSeries use the button below the
tree.
placed within the CollectionEvents. To insert a
new EventSeries use the button below the
tree.
To change the width and sequence of the columns simply use your mouse to
drag the columns to the position of your choice or adapt the width to
your preference. These changes will be saved for this session as well as
for the next time you use the grid mode. To return to the original
sequence of the columns click on the Reset sequence button.
Customize visibility of fields
The selection of the visible fields can be adapted in the tree above the
list. Change the selection of the columns and click on the Set columns button.
Sorting of the data
To sort the data in the grid simply click in the header of the column
which you want to use as sorting column. The sorting sequence will be
kept even if you change values in this column. This means if you change
a value in the sorting column, the changed data set will be placed at
the new position according to its new value. The sorting of a column
will be indicated by an arrow for the direction of the sorting (up or
down) and by a thicker right border of this column (see image below).
To adapt the width of the columns or the height of the rows either drag
the border with the mouse or double click the border to get the optimal
size for one column. You may also click on the
button for an optimal height of the rows or the button for an optimal width of the columns.
Handling the data
Find and replace
To use the find and replace functions you must either select a part of
the field in this column or click on the
button to select the entire column. You may then choose the function you
wish to apply (remove, insert, append or replace). To replace a part of
a text in the selected fields enter the text which should be replaced
and enter the replacement in the corresponding fields. To start the
replacement click the button. To insert a
string to the beginning of all entries in the selected fields click
the button. To append a string to all entries
in the selected fields click the button. To
remove all entries from the selected fields click the button.
Editing
Some columns can not be edited directly but are linked to external
modules or services. These columns appear as buttons. Simply click on
the button to call the service. If a value is linked to an entry in an
external module, the background will change to
[yellow] and you will not be able to
change the text.
Together with the links (in the example above [Link to
DiversityAgents]) you can select columns that
provide the possibility to release the links to the modules (e.g.
[Remove link for collector] in image above). These
columns will appear as buttons . Simply
click on the button related to a link to release the link to the
corresponding module. After that you can edit the text field containing
the linked value.
Some values are linked to a list of values. Use the drop-down list to
change the value in one of these columns.
Saving the data
To save all changes click on the button. To undo
the all changes since the last time the data sets were saved click on
the button. To save the changes in the current
data set use the save button. To undo the changes in the
current data set click the undo button. If you click
the OK button, you will be asked whether you would like to save
the changes before the window will be closed. If you click the
Cancel button or close the window your changes will not be
saved. To export the data shown in the grid as a text file with tabs as
column separators click on the export button.
Diversity Collection
Grids
Collection Specimen
To edit the data of the specimens in a data grid choose the Grid mode for the specimen
from the menu. A window will open where every
data set for a specimen from the query result list is restricted to one
line. Please keep in mind you can only see a limited part of the data
while in this view. For example only the last identification of an
organism will be displayed. This is demonstrated in the image below
where two organisms, indicated with the red arrows, will not appear in
the grid. If you use the grid mode for the organisms, all organisms will
appear with their last identification.
Customizing
Customize visibility of fields
The selection of the visible fields can be adapted in the tree above the
list. If this part is hidden click on the
button to make it accessible. Change the selection of the columns and
click on the [Set columns] button.
Customize column width and sequence
To adapt the width of the columns or the height of the rows either drag
the border with the mouse or double click the border to get the optimal
size for one column. You may also click on the
button for an optimal height of the rows or the button for an optimal width of the columns. To change the
width and sequence of the columns simply use your mouse to drag the
columns to the position of your choice or adapt the width to your
preference. These changes will be saved for this session as well as for
the next time you use the grid mode. To return to the original sequence
of the columns click on the Reset sequence button.
Sorting of the data
To sort the data in the grid simply click in the header of the column
which you want to use as sorting column. The sorting sequence will be
kept even if you change values in this column. This means if you change
a value in the sorting column, the changed data set will be placed at
the new position according to its new value. The sorting of a column
will be indicated by an arrow for the direction of the sorting (up or
down) and by a thicker right border of this column (see image below).
Data handling
Find and replace
To use the find and replace functions you must either select a part of
the field in this column or click on the
button to select the entire column. You may then choose the function you
wish to apply (remove, insert, append or replace). To replace a part of
a text in the selected fields enter the text that should be replaced and
enter the replacement in the corresponding fields. To start the
replacement click the button. To insert a
string to the beginning of all entries in the selected fields click
the button. If the selected column is a link to a
module or webservice, a  button will
appear where you can search for a linked data set. The insert will set
the selected column and related columns according to the linked data
set. Thus, if you choose e.g. a value from the DiversityGazetteer, the
coordinates and the country will be changed as well. Click on the link
to see all related information. To reset the link use the
button will
appear where you can search for a linked data set. The insert will set
the selected column and related columns according to the linked data
set. Thus, if you choose e.g. a value from the DiversityGazetteer, the
coordinates and the country will be changed as well. Click on the link
to see all related information. To reset the link use the  delete button. To append a string to all entries in
the selected fields click the button. To
remove all entries from the selected fields click the button.
delete button. To append a string to all entries in
the selected fields click the button. To
remove all entries from the selected fields click the button.
Transfer from spreadsheet
You can transfer data from a spreadsheet e.g. Excel or Calc. Copy the
columns of this data from the spreadsheet and then insert it in
DiversityCollection. Click in the upmost left cell where this data
should be transferred to and use the context menu (click the right mouse
button) to insert the data.
Editing
Some columns can not be edited directly but are linked to external
modules or services. These columns appear as buttons. Simply click on
the button to call the service. If a value is linked to an entry in an
external module, the background will change to
yellow and you will not be able to
change the text.
Together with the links (in the example above [Link to
DiversityAgents]) you can select columns that
provide the possibility to release the links to the modules (e.g.
[Remove link for collector] in image above). These
columns will appear as buttons . Simply
click on the button related to a link to release the link to the
corresponding module. After that you can edit the text field containing
the linked value.
Some values are linked to a list of values. Use the drop-down list to
change the value in one of these columns.
If you click in the empty line at the base of the data grid, you will be
asked if you wish to create a new data set. The program will ask you for
a new accession number and the project of the new data set. Another way
to create a new data set is the copy button . Simply
click in the line you wish to create a copy of and then click on the
copy button . For details see the Data
section. A copy of the data set will be inserted at the base of the data
grid.
In the grid view for the organisms a part of the columns can not be
edited. These columns contain data which can be related to several
organisms. This is indicated by a gray background.
The Relation has two states:
either external  (the column
[Related specimen URL] will be shown in the interface)
or internal.
(the column
[Related specimen URL] will be shown in the interface)
or internal.  (the column
[Related specimen display text] will be shown in the interface)
Use the [Relation is internal] column to change the state and
the [Link to DiversityCollection for relation] column to set an
internal relation.
(the column
[Related specimen display text] will be shown in the interface)
Use the [Relation is internal] column to change the state and
the [Link to DiversityCollection for relation] column to set an
internal relation.
Saving the data
To save all changes click on the button. To undo
all changes since the last time the data sets were saved click on the button. To save the changes in the current data
set use the save button. To undo the changes in the
current data set click the undo button. If you click
the OK button, you will be asked whether you would like to save
the changes before the window will be closed. If you click the
Cancel button or close the window your changes will not be
saved. To export the data shown in the grid as a text file with tabs as
column separators click on the export button.
Inserting new data
To insert a new data set simply click in the last empty line of the data
grid. The program may ask you to specify a project in which the new data
should be placed. In the grid for the organisms a window will open as
shown below.
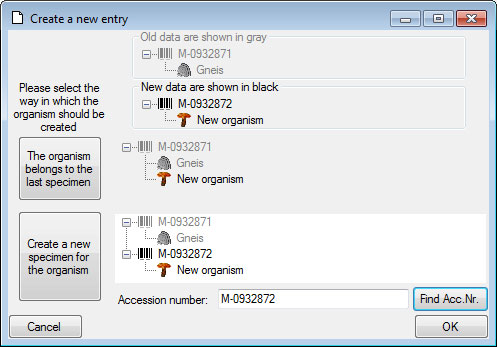
Here you have the option to insert the new data set of the organism in
the last specimen in the grid or to create a new specimen for the
organism. In the second case you can specify the accession number of the
new specimen. Use the Find Acc. Nr. button to search for the
next free accession number in the database which matches your entry in
the Accession number field.
For new data sets you can specify certain project settings e.g. the
material category of a part of the specimen. The taxonomic group of a
new organism will correspond to the first organism in your last specimen
unless you specify a certain taxonomic group in the project settings for
the project you are working in. To enter or change a setting you need
the module DiversityProjects. For further information please turn to
the documentation provided with this module.
Copy data
To copy a data set select the line of the data grid you wish to create a
copy of and click on the button. For further
details, see the chapter Copy specimen.
Diversity Collection
Grids
Organisms (Units)
To edit the data of the organisms in a data grid choose the Grid
mode for the organisms
from the menu. A window will open where every data set for an organism
from the query result list is restricted to one line. Please keep in
mind that you can only see a limited part of the data in this view. For
example only the last identification of an organism will be displayed.
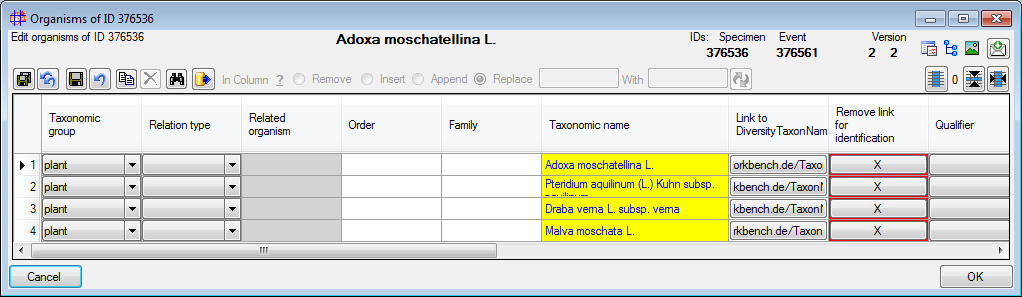
In the grid view for the organisms a part of the columns can not be
edited. These columns contain data which can be related to several
organisms. This is indicated by a gray background.
Customize the window
To change the width and sequence of the columns simply use your mouse to
drag the columns to the position of your choice or adapt the width to
your preference. These changes will be saved for this session as well as
for the next time you use the grid mode. To return to the original
sequence of the columns click on the Reset sequence button.
To adapt the width of the columns or the height of the rows either drag
the border with the mouse or double click the border to get the optimal
size for one column. You may also click on the
button for an optimal height of the rows or the button for an optimal width of the columns.
The selection of the visible fields can be adapted in the tree above the
list. Change the selection of the columns and click on the Set columns button.
Analysis
In this grid you can edit up to 10 different types of analysis, however,
only the last analysis will be shown for each type. By default the
available analysis types will be generated dynamically depending on the
data. If you need an additional type in the grid, simply return to the
main form and enter the required type in one of the data sets. If you
wish to specify which analysis you want to see in the grid, you can set
the list in the options. Click on the button to open a
window as shown below.
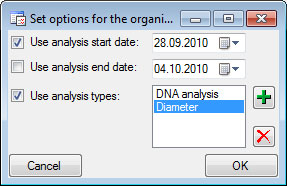
Here you can restrict the range of the dates of the analysis and the
types of the analysis which should be displayed. To change the entries
in the list use the  and buttons to add
or delete entries.
and buttons to add
or delete entries.
Sorting of the data
To sort the data in the grid simply click in the header of the column
which you want to use as sorting column. The sorting sequence will be
kept even if you change values in this column. This means if you change
a value in the sorting column, the changed data set will be placed at
the new position according to its new value. The sorting of a column
will be indicated by an arrow for the direction of the sorting (up or
down) and by a thicker right border of this column (see image below).
Handling the data
Some columns can not be edited directly but are linked to external
modules or services. These columns appear as buttons. Simply click on
the button to call the service. If a value is linked to an entry in an
external module, the background will change to
[yellow] and you will not be able to
change the text.
Together with the links (in the example above [Link to
DiversityAgents]) you can select columns that
provide the possibility to release the links to the modules (e.g.
[Remove link for collector] in image above). These
columns will appear as buttons . Simply
click on the button related to a link to release the link to the
corresponding module. After that you can edit the text field containing
the linked value.
Some values are linked to a list of values. Use the drop-down list to
change the value in one of these columns.
If you click in the empty line at the base of the data grid, you will be
asked if you wish to create a new data set. The program will ask you for
a new accession number and the project of the new data set. Another way
to create a new data set is the copy button . Simply
click in the line you wish to create a copy of and then click on the
copy button . For details see the Data
section. A copy of the data set will be inserted at the base of the data
grid.
In the grid view for the organisms a part of the columns can not be
edited. These columns contain data which can be related to several
organisms. This is indicated by a gray background.
Find and replace
To use the find and replace functions you must either select a part of
the field in this column or click on the
button to select the entire column. You may then choose the function you
wish to apply (remove, insert, append or replace). To replace a part of
a text in the selected fields enter the text which should be replaced
and enter the replacement in the corresponding fields. To start the
replacement click the button. To insert a
string to the beginning of all entries in the selected fields click
the button. To append a string to all entries
in the selected fields click the button. To
remove all entries from the selected fields click the button.
To save all changes click on the button. To
undo all changes since the last time the data sets were saved click on
the button. To save the changes in the current
data set use the save button. To undo the changes in the
current data set click the undo button. If you click
the OK button, you will be asked whether you would like to save
the changes before the window will be closed. If you click the
Cancel button or close the window your changes will not be
saved. To export the data shown in the grid as a text file with tabs as
column separators click on the export button.
To copy a dataset select the line of the data grid which you wish to
create a copy of and click on the button. A copy of
the selected data set will be added at the base of the spreadsheet.
Diversity Collection
Grid
Organisms of a specimen
To edit the data of the organisms of a specimen select the specimen
entry in the tree and click on the  button in the panel on the right. A window as shown below will open with
the functionality of the grid for the organisms but
restricted to the organisms of the current specimen.
button in the panel on the right. A window as shown below will open with
the functionality of the grid for the organisms but
restricted to the organisms of the current specimen.
Diversity Collection
Grids
Specimen Parts
To edit the data of the parts in a data grid choose the Grid mode for the
Parts... from the menu. A window will open where every data set
for a part from the query result list is restricted to one line. Please
keep in mind you can only see a limited part of the data while in this
view. For example only the last processing or analysis of a certain type
of a part will be displayed.
Customize the window
To change the width and sequence of the columns simply use your mouse to
drag the columns to the position of your choice or adapt the width to
your preference. These changes will be saved for this session as well as
for the next time you use the grid mode. To return to the original
sequence of the columns click on the Reset sequence button.
To adapt the width of the columns or the height of the rows either drag
the border with the mouse or double click the border to get the optimal
size for one column. You may also click on the
button for an optimal height of the rows or the button for an optimal width of the columns.
The selection of the visible fields can be adapted in the tree above the
list. Change the selection of the columns and click on the Set columns button.
Analysis
In this grid you can edit up to 10 different types of processing,
however, only the last analysis will be shown for each type. To specify
which analysis you wish to see in the grid click on the button to open a
window as shown below.
Here you can restrict the range of the dates of the analysis and the
types of the analysis which should be displayed. To change the entries
in the list use the
and buttons to add
or delete entries. For taxonomic groups which miss certain types of
analysis the columns will be blocked.
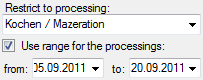
Processing
In this grid you can display up to 5 different processings, however,
only the last processing will be shown. You can define a time range for
the processing that should be displayed and / or restrict the processing
to a certain type (see image below). For material categories which miss
certain types of processing the columns will be
blocked.
Sorting of the data
To sort the data in the grid simply click in the header of the column
which you want to use as sorting column. The sorting sequence will be
kept even if you change values in this column. This means if you change
a value in the sorting column, the changed data set will be placed at
the new position according to its new value. The sorting of a column
will be indicated by an arrow for the direction of the sorting (up or
down) and by a thicker right border of this column (see image below).
Selecting of the data
To restrict the data in the grid you can filter an entry. Select the
entry for which you want to filter and click on the  filter button. To remove data from the grid select the
rows which should be removed and click on the
filter button. To remove data from the grid select the
rows which should be removed and click on the  button.
Handling the data
Some columns can not be edited directly but are linked to external
modules or services. These columns appear as buttons. Simply click on
the button to call the service. If a value is linked to an entry in an
external module, the background will change to
[yellow] and you will not be able to
change the text.
Together with the links (in the example above [Link to
DiversityAgents]) you can select columns that
provide the possibility to release the links to the modules (e.g.
[Remove link for collector] in image above). These
columns will appear as buttons . Simply
click on the button related to a link to release the link to the
corresponding module. After that you can edit the text field containing
the linked value.
Some values are linked to a list of values. Use the drop-down list to
change the value in one of these columns.
If you click in the empty line at the base of the data grid, you will be
asked if you wish to create a new data set. The program will ask you for
a new accession number and the project of the new data set. Another way
to create a new data set is the copy button . Simply
click in the line you wish to create a copy of and then click on the
copy button . For details see the Data
section. A copy of the data set will be inserted at the base of the data
grid.
In the grid view for the parts a part of the columns can not be edited.
These columns contain data which can be related to several parts. This
is indicated by a gray background.
Find and replace
To use the find and replace functions you must either select a part of
the field in this column or click on the
button to select the entire column. You may then choose the function you
wish to apply (remove, insert, append or replace). To replace a part of
a text in the selected fields enter the text which should be replaced
and enter the replacement in the corresponding fields. To start the
replacement click the button. To insert a
string to the beginning of all entries in the selected fields click
the button. To append a string to all entries
in the selected fields click the button. To
remove all entries from the selected fields click the button.
To save all changes click on the button. To undo
all changes since the last time the data sets were saved click on the button. To save the changes in the current data
set use the save button. To undo the changes in the
current data set click the undo button. If you click
the OK button, you will be asked whether you would like to save
the changes before the window will be closed. If you click the
Cancel button or close the window your changes will not be
saved. To export the data shown in the grid as a text file with tabs as
column separators click on the export button.
To copy a dataset select the line of the data grid which you wish to
create a copy of and click on the button. A copy of
the selected data set will be added at the base of the spreadsheet.
Diversity Collection
Grids
Specimen images
To edit the data of the images in a data grid choose the Grid mode for the
Images... from the menu. A window
will open where every data set for an image from the query result list
is restricted to one line (see below).
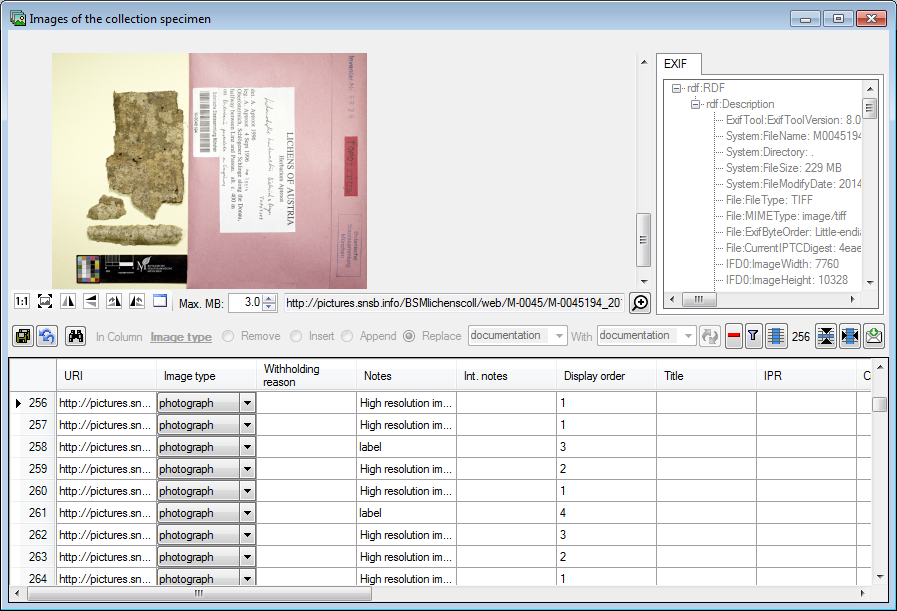
Sorting of the data
To sort the data in the grid simply click in the header of the column
which you want to use as sorting column. The sorting sequence will be
kept even if you change values in this column. This means if you change
a value in the sorting column, the changed data set will be placed at
the new position according to its new value. The sorting of a column
will be indicated by an arrow for the direction of the sorting (up or
down).
Selecting the data
To restrict the data in the grid you can filter an entry. Select the
entry for which you want to filter and click on the filter button. To remove data from the grid select the
rows which should be removed and click on the
button.
Handling the data
Some columns can not be edited directly because they are linked to
external modules or services. These columns appear as buttons. Simply
click on the button to call the service. If a value is linked to an
entry in an external module, the background will change to
[yellow] and you will not be able to
change the text.
Next to the links there are columns which allow you to remove a link to
the corresponding module . Simply click
on the button to remove the link. After that you can edit the text field
containing the linked value.
Some values are linked to a list of values (e.g. Image type). Use the
drop-down list to change the value in one of these columns.
Find and replace
To use the find and replace functions you must either select a part of
the field in this column or click on the
button to select the entire column. You may then choose the function you
wish to apply (remove, insert, append or replace). To replace a part of
a text in the selected fields enter the text which should be replaced
and enter the replacement in the corresponding fields. To start the
replacement click the button. To insert a
string to the beginning of all entries in the selected fields click
the button. To append a string to all entries
in the selected fields click the button. To
remove all entries from the selected fields click the button.
To data are automatically saved when you close the window. To undo all
changes click on the button.
Diversity Collection
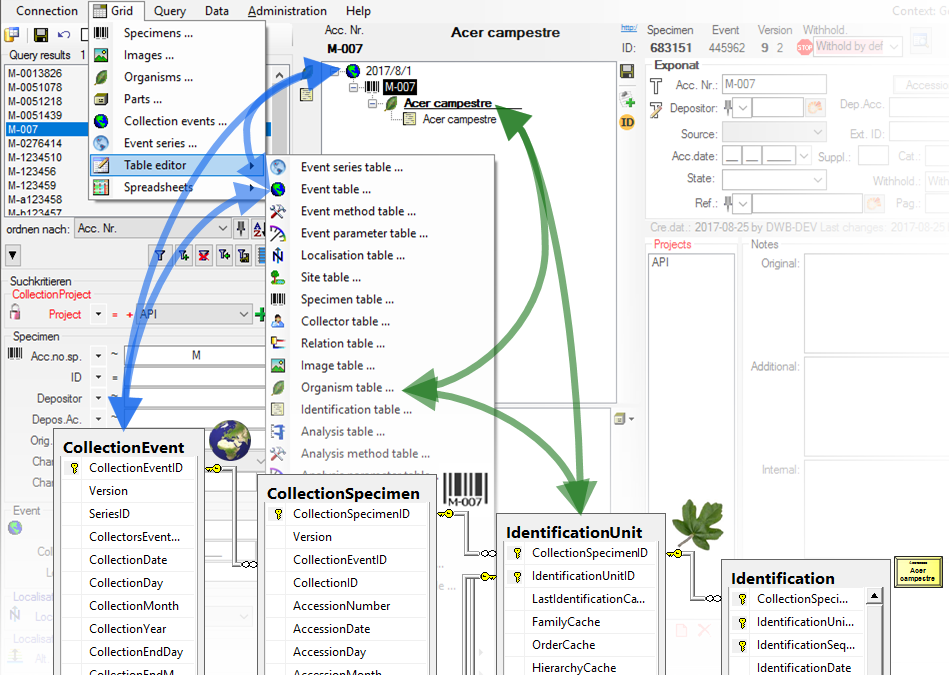
Table Editors
For the data selected in the main window the table editors offer a
direct access to the tables of the database as shown in the image below.
In the hierarchy tree of the main window every entry corresponds to a
table in the database, marked for the image below for the tables
CollectionEvent and IdentificationUnit. Underneath the menu
Grid select one of the  Table editors (see below). For an introduction
see a short tutorial
Table editors (see below). For an introduction
see a short tutorial
 .
.
A window with the content of the table will open. Columns with a [gray
background] can not be edited here.
Columns with a [light gray
background] are linked to the
contents of lookup tables where you can change according to the contents
of these tables. If you are using the optimzed query
 certain columns that are linked to lookup
tables show the translated content instead of the IDs. With the
[ ID ]
button you can change back to the original, not translated content of
the table. The tables below are examples for those that are included for
direct access via a table editor:
certain columns that are linked to lookup
tables show the translated content instead of the IDs. With the
[ ID ]
button you can change back to the original, not translated content of
the table. The tables below are examples for those that are included for
direct access via a table editor:
With the button you can set the widths of
the columns according to the header and the content. With the  button the width is set to the
content. After the column width is set, this will be indicated with a
yellow background
button the width is set to the
content. After the column width is set, this will be indicated with a
yellow background  . Click again on the button to release the setting of the
column width .
. Click again on the button to release the setting of the
column width .
Data Handling
For the data selected in the main window the table editors offer a
direct access to the tables of the database. The menu Data -
Table editors provide an editor for selected tables within the database.
A window with the content of the table will open. Columns with a gray
background can not be edited here. Columns with a light gray background
are linked to the contents of lookup tables where you can change
according to the contents of these tables.
Select  Set timeout ... from the menu to
increase the default timeout from 5 seconds to a higher value, e.g. for
greater amounts of data.
Set timeout ... from the menu to
increase the default timeout from 5 seconds to a higher value, e.g. for
greater amounts of data.
Editing
You can either edit the contents of the table directly or perform
changes to any number of marked fields. To mark a whole column use
the button. Once you have selected the
contents to change, select one of the modes of change that appear in the
upper left corner. The modes of change are:
- Insert: Insert the given value at the
beginning of the content
- Append: Append the given value at the end of
the content
- Replace: Replace a string in the content
with the given value
- Clear: Remove the content
After selecting the change mode, enter the text in the field where
necessary and click on the corresponding button to perform the changes
Deleting
If you select whole lines, a delete button will appear. Click on it to remove the selected datasets from the database.
Filtering
To filter the content of the table, click in the column that should be
used for filtering. Then choose the mode of comparision:
- = : The content must be exactly like the given value
- ~ : The content must contain the given value
- ≠ : The content must be different to the given value
If you want the filtering to be case sensitive, choose the
 a<>A option. After all parameters are set,
click on the filter button. To undo the filtering, click
on the
a<>A option. After all parameters are set,
click on the filter button. To undo the filtering, click
on the  button. This will reset the data to the
last saved version. If you want your changes to be saved, click the
button before you reset the filtering. If you close
the window all changes so far will be saved automatically. So if you do
not want to save your changes, click on the
button before closing the window.
button. This will reset the data to the
last saved version. If you want your changes to be saved, click the
button before you reset the filtering. If you close
the window all changes so far will be saved automatically. So if you do
not want to save your changes, click on the
button before closing the window.
Export
To export the data as a tab separated text file, click on the
button. The file will be automatically saved in
the client-folder.
To export the data in a SQLite database click on the
 button. The data
will be exported into the SQLite database DiversityAgentTables.sqlite in
the folder Export in your application directory. If you want to save
previous exports, please rename the SQLite database or copy it to a
different directory.
button. The data
will be exported into the SQLite database DiversityAgentTables.sqlite in
the folder Export in your application directory. If you want to save
previous exports, please rename the SQLite database or copy it to a
different directory.
Log data
To see the log data of the table, you can click on the
button. The content of the log table can not be
changed, but is read only.
Diversity Collection
Spreadsheets
The program provides several spreadsheets with different focus:
- Event
- Main table: CollectionEvent
- The focus is the collection event
- TK25
- Editing data that are linked to a TK25 entry.
- The sheet provides a link to distribution maps with the option to select data via these maps
- Organism
- Mineral
- Focus on mineral specimen
- Part
- Collector
- Main table: CollectionAgent
- All collectors of a specimen
- Image
- Main table: CollectionSpecimenImage
- All images of a specimen
- Analysis
- Main table: Analysis
- Administration of the analysis
The spreadsheets similar to the grids provide a tabular access to the
data. In addition you can search and filter data independent from the
main form. For an introduction see two short tutorials
(overview),
(tables and columns). To open a spreadsheet, choose
Grid -  Spreadsheets - and then one of the provided versions, e.g.
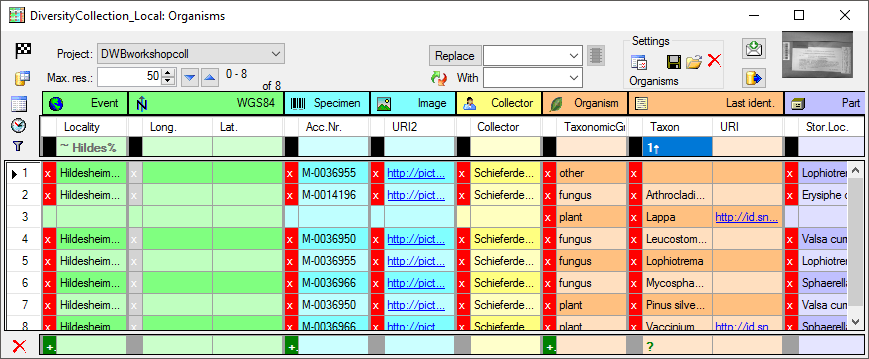
Organisms from the menu. A window as shown below will open where the data are marked and organized according to the database tables. If values in one of the tables are missing, this will be indicated with a grey background. The colors correspond to the overview for the database.
Spreadsheets - and then one of the provided versions, e.g.
Organisms from the menu. A window as shown below will open where the data are marked and organized according to the database tables. If values in one of the tables are missing, this will be indicated with a grey background. The colors correspond to the overview for the database.
Start
To use any of the spreadsheets as a starting window, click on the  button. Now the application will directly open the spreadsheet with the same parameters when you close it.
Database
To change to another database, click on the  button and choose the database as described here.
Please keep in mind that the main form will connect to the new selected
database.
button and choose the database as described here.
Please keep in mind that the main form will connect to the new selected
database.
Project
 If a user has read only projects available, a
 button will appear in front of the project. Click on this button to change to the list of projects with read only access. The window will change into the Read only mode (see below). To return to the list of projects with write access, just click no the button again. After changing the source for the project list, the project label will blink with red to remind you, to select a project from the list.
Getting the data
The data are always restricted to one project, selected in the corresponding field (see image above) and restricted to the first top lines as specified in the Max. res. field. To change to the next or previous block of data, use the  resp.
resp.  button.
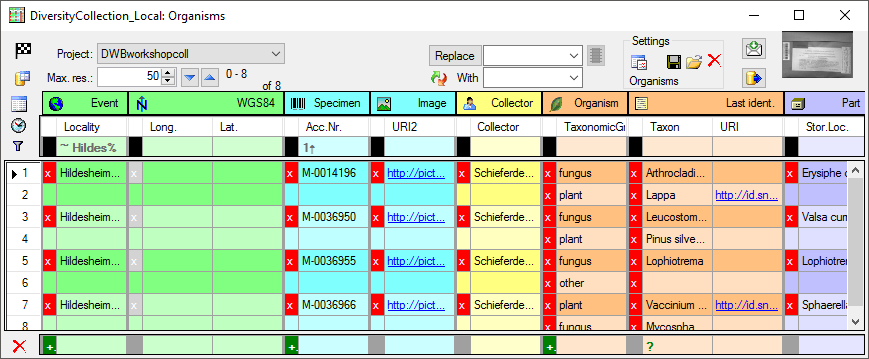
The program will organize the data in blocks indicated by the colors as
shown above. In the example above the first block contains 2
Organisms
all belonging to the block starting with Hildesheim...
for the Event
and M-0014196 for the
Specimen. The next block then starts with
Hildesheim... indicated by a
change in the color containing 2 Organisms. For most of the spreadsheets, the
presence of the Event in the data is a
prerequisit. As long as you do not sort or filter the data (see below), these blocks will be consistent with the data. As soon as you filter or sort the data, these blocks may be split and may not correspond to the data blocks in the database any more. In the example below you see the effect of sorting by the column Taxon on breaking up the blocks. E.g.
the block for the specimen M-0036950
is split into 2.
SQL
The query used for the retrieval of the data can be accessed with a click on the SQL button.
Filtering
To filter the content of a table you can apply a filter either on the whole table or on each of the columns of the table.
Table filter
This filter will apply on the whole table. Click in the black box next
to the filter area and select one of the filter options as shown below.
- ♦: Filled (all visible columns)
- ◊: Empty (all visible columns)
- •: Data in table do exist
- Ø: Data in table do not exist
Tutorial:
Column filter
Tutorial:
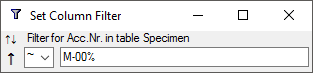
This filter will apply on a single column of a table. To set a filter click in the field underneath the column name. A window as shown below will open. With a click on the add button you can enter a value from the current content of the column as filter.
Here you set the sorting (see below), enter the search string and choose among several ways of comparison with the contents in the database:
- =: The content must be exactly like the given value
- ≠: The content must be different to the given value
- ~: The content must be similar to the given value, use wildcards % for any string or _ for a single character
- ¬: The content must NOT be similar to the given value, use wildcards % for any string or _ for a single character
- <: The content must be smaller than the given value
- >: The content must be bigger than the given value
- |: The content must be in a given list of values
- ∉: The content must NOT be in a given list of values
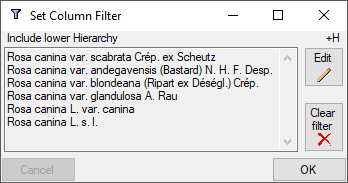
For columns linked to modules of the DiversityWorkbench there may be additional options. E.g. for a column linked to DiversityTaxonNames you get 3 additional options:
- +H: Include lower Hierarchy
- +S: Include Synonyms
- +H+S: Include lower Hierarchy and Synonyms
After selecting one of these options, you will be asked for the database
and the project where the data should be taken from. In the next step
the corresponding names as retrieved from the selected source will be
listed (see below). To change the filter click on the
 button and on the delete button to
remove it.
button and on the delete button to
remove it.
Sorting
↓↑ Tutorial:
The data can be sorted by each visible column. If you click into the field underneath the column name a window will open as described above. To change between the modes of sorting, just click on the current
sorting. The modes are:
- -: Not sorted
- ↑: Sorted in ascending sequence
- ↓: Sorted in descending sequence
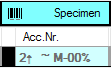
After all parameters are set, the sort mode and filter settings will be
shown in the field underneath the column name (see image below). The
number indicates the sequence within the sorting columns.
Timeout
After all parameters are set, click on the button. If for any reason you get a timeout, meaning the query for the data takes too long, either simplify your query or adapt the time for the query after a click on the button. If you do not want to restrict the time for the queries, set the value to 0. The
default value is 30 seconds.
Read only mode
<>  Tutorial:
The formatting of the sheet including the color indication of tables and data blocks is rather time consuming. If these are not needed, e.g. for exporting the data, you can switch to
the Read only mode for higher performance. For projects with read only access (see above), the mode is automatically set to Read only.
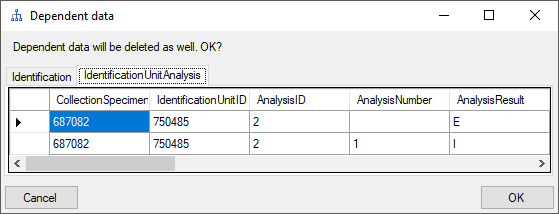
Editing
To edit the data, just change them. If data are missing, type or select a value in the corresponding field. To remove data, click on the x field. This will remove all entries dependent on this entry that means all data right from the entry in the same line resp. block and any depending data. If there are any depending data, a window will open as shown below listing these data. Click OK if you want to remove the selected data including all depending data as shown in the window.
To change the content of several values in a column, either select the whole column with a click on the button or select the fields manually. To avoid the pop-up of data-entry windows e.g. for columns with a lookup list, click no the  button. Once you have selected the
contents to change, select the mode of change:
button. Once you have selected the
contents to change, select the mode of change:
- Prepend: Insert the given value at the beginning of the content
- Append: Append the given value at the end of the content
 Overwrite: Remove current content and insert given value
- Replace: Replace a string in the content with the given value
- Clear: Remove the content
After selecting the change mode, enter the text in the field where necessary and click on the corresponding button to perform the changes.
With the context menu (mark area and right click) you can
Remove data (for single data fields with a list behind),  Tranfer or Copy the content into the clipboard and
  Insert the content
of the clipboard into the selected cells. Tutorial:
Insert the content
of the clipboard into the selected cells. Tutorial:
Locked columns
Columns that can not be edited are indicated with a lighter background color of the header and a gray text of title and content. These columns contain e.g. database generated content or data from lookup tables.
Inclusion of RowGUID
By default the primary key can not be changed in the spreadsheet. In some cases you may want to change parts of the primary key. To do this, you must include the column RowGUID in the list of selected columns. The program will ensure that the changed data do not collide with existing data, that is having the same primary key. See an example in a short tutorial:
Fixed sources
 Tutorial:
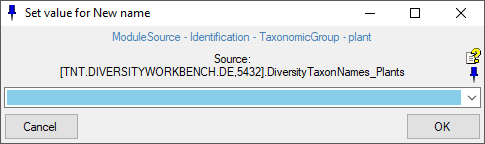
For columns that are linked to a remote module, you can fix the
source for the query. If the source is fixed, the query will directly contact the source as shown in the image below. To set resp. change the source, click on the button. A window will open where you can select either a webservice or a source database together with a project within the database. To remove the source, click on the
button (only visible if a source is present).
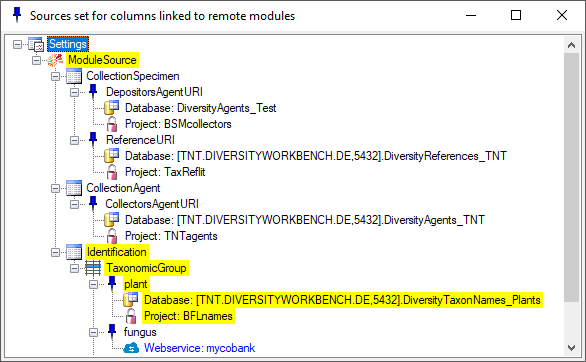
To see an overview for the fixed sources, click on the
 button. A window will open where all sources are listed with the source for the current
column marked with a yellow
background.
button. A window will open where all sources are listed with the source for the current
column marked with a yellow
background.
A "right-click" on the button in the main form will show the settings as well and with a click on the
button you can set the connection for the selected column. If a column depends on values from the data as for example the relations to the module DiversityTaxonNames with a dependence on the taxonomic group, the relation will change with the selected row, depending on the data retrieved from the selected row. If there is no connection to the related module defined, the button will appear gray
 and if the column has no relation to a module, the button will appear like
If the source is not fixed the query will start as described
here.
Settings
-
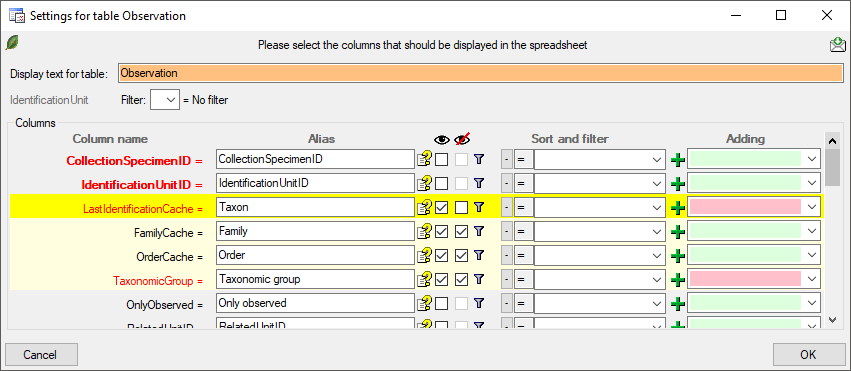
To change the data shown in the query results, either click on the header of the tables, e.g. Event for that table. A window as shown below will open where you can select or deselect columns, change their headers etc. Red columns need to be filled (either by the database, the program or the user). In the Alias field you can rename the columns to your preferences. The
button will show a description of the columns. For columns linked to a module, the current settings for the link will be shown in addition to the description. To display a column in the sheet use the  checkbox .
If a column is needed, but should be hidden, select the
checkbox .
If a column is needed, but should be hidden, select the
 checkbox. Displayed columns are indicated by a yellow background while hidden columns get a light yellow background. Certain columns are required (indicated by a purple color) and can not be removed e.g. if they are involved in a link to a remote module like in the example below the columns FamilyCache and OrderCache. Columns linked to a module are indicated by a blue color.
The  button allows you to include one of the tables missing in the sheet (see image below). After selection of the table, select the column(s) you want to include in the sheet as shown in the image above.
To store resp. load settings, use the resp.
 button. If a setting file has been corrupted click on the delete button to remove it and restart with factory settings. The spreadsheet will always start with the previous settings. The location where the settings are stored are set under
Administration -
button. If a setting file has been corrupted click on the delete button to remove it and restart with factory settings. The spreadsheet will always start with the previous settings. The location where the settings are stored are set under
Administration -  Resources directory ... . For an introduction see a short tutorial
.
Resources directory ... . For an introduction see a short tutorial
.
Column width
Tutorial:
The width of the columns can be set manually (in the filter area) or automatically with a click on the button. A window will open where you can choose and set the parameters for setting
the column width.
Adding
Tutorial:
To add new data, use the area underneath the data table. You can enter preset values that will be used for the new data. If the new data should be added to existing entries, select the corresponding row. Then click on the + field of the datarange that should be inserted. If preset values are given, all corresponding tables will be filled together with the new inserted data. Defaults for the responsibles can be set under Administration - Customize Display. If a column is linked to a remote module, the corresponding columns will be filled together with the selection of the link, so e.g. if you select a link for a taxonomic name to a DiversityTaxonNames the columns for the taxon and if available the familiy etc. will be filled as well. To remove a linked value, select it a choose Remove from the
context menu (right click).
Export
Tutorial:
To export the data as a tab separated text file (UTF8), click on the
button. You will be asked if you want to include the hidden columns. These are the primary keys you may need for statistic evaluations etc.
Feedback
To send a feedback to the developer of the software, create a screenshot and click on the button.
Details
Tutorial:
To see all details of a dataset, select the dataset in the sheet and click on the DWB button. A window, corresponding to the main form will open, showing all data related to the selected specimen.
Image
Tutorial:
If an image is present a preview will be shown in the right upper area of the window. Click on it to see the image in a separate form. The images are restricted to the first image of one source, so e.g. in the organisms sheet only the first image of the specimen linked with this organism will be shown while images of e.g. linked to none or another organism or the collection event will not be addressed.
Subsections of Spreadsheets
Diversity Collection
Spreadsheet
Maps
Introduction:
For certain spreadsheets you can display the content in a map. The
content will be displayed with the GIS-Editor like in the example below.
To set the symbols etc. representing the values, click on the  button. A window as shown below will open, where
you can set the parameters for the map.
button. A window as shown below will open, where
you can set the parameters for the map.
Transparency
For the creation of heat maps, the transparency of the symbols displayed
in the map can be set to a value below 255 (= no transparency).
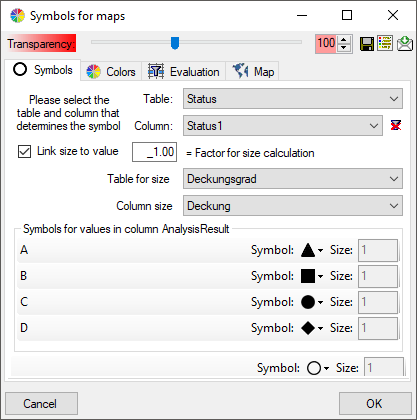
Symbols
Introduction to  Symbols:
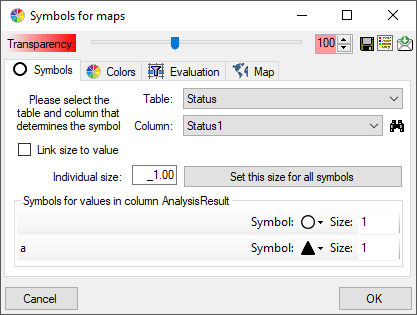
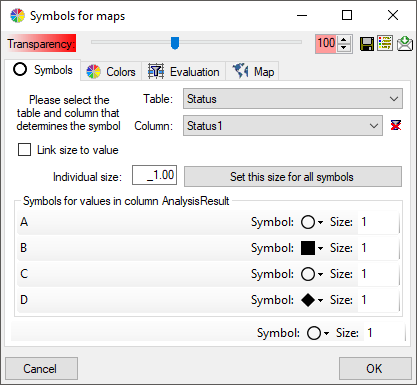
The symbols can be linked to the value within the database. A typical
example would be the status of a plant, e.g. endagered, rare etc. stored
as an analysis. Choose the Table where the values should
be taken from. Now you can choose the column within the table. The
different values will be listed and you can attribute a symbol together
with the size to every listed value. In the image below, the symbols are
linked to the values of a column named Last Nr for a certain analysis.
The tables in the drop down list (see above) correspond to the content
and definitions in the spreadsheets. Accordingly the values the symbols
are linked to are restricted to the current content of the spreadsheet.
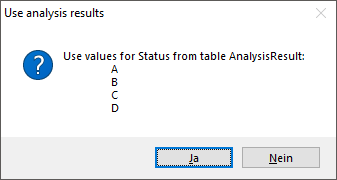
As an alternative and in preparation for data containing other values to
get the whole range of possible values you can select the source for the
values from the whole database. Click on the  button
to select the source table. The programm will try to find the relevant
data an make a proposal as shown in the image below.
button
to select the source table. The programm will try to find the relevant
data an make a proposal as shown in the image below.
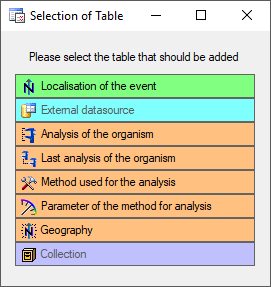
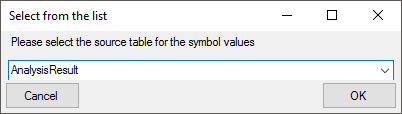
If the proposal does not fit, set the source manually: In the window
that will open as shown below, choose the source table for the values
and click OK. (The table names in this list correspond to those in the
database)
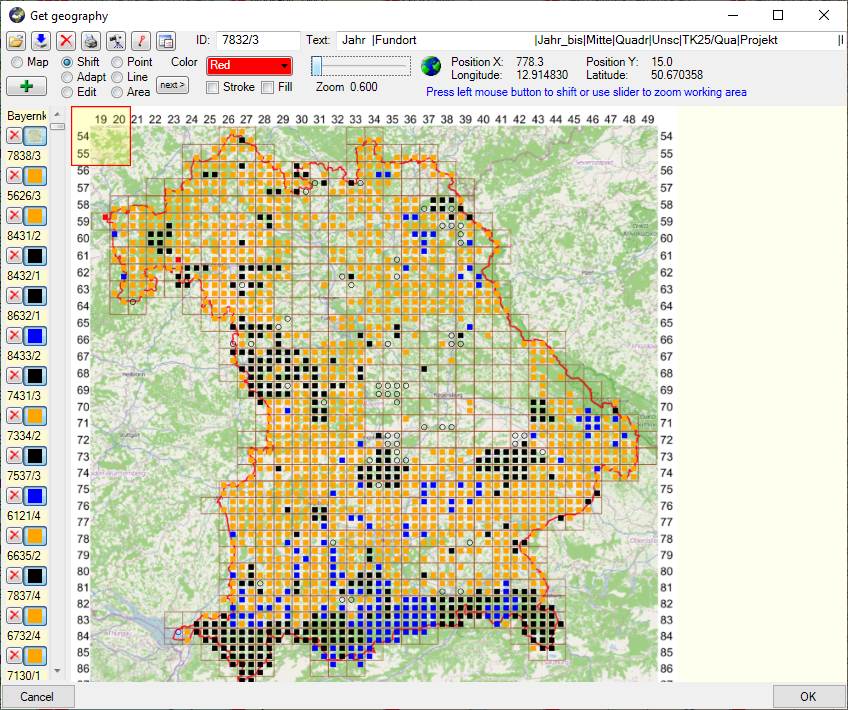
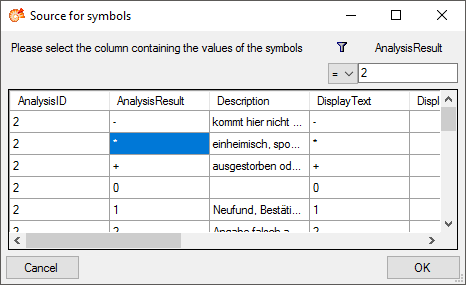
This will open the source table as shown below. Here choose the column
for a filter, e.g. AnalysisID, select the type of comparision and enter
the restriction value. Now you can click on the
button to restrict the values. In the example below the values were
restricted to the analysis with the ID = 2. Finally select the column
containing the values you need (AnalysisResult in the example below) and
click OK (see below).
Now all values from the source are listed, not only those contained in
the data form the spreadsheet (see below). The button
will change to  and will
now remove the source, to return to the values contained in the
spreadsheet. If certain values should not appear in the map, choose
as symbol.
and will
now remove the source, to return to the values contained in the
spreadsheet. If certain values should not appear in the map, choose
as symbol.
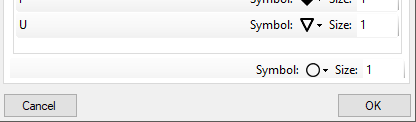
If the list does not contain a missing value, a separate control will
appear at the end of the list, where you can set the symbol for missing
values (see below).
The size of the symbols can be set either for every symbol or for all
symbols with the button Set this size for all
symbols. Another option is to link the size of the symbols to a
numeric value within the data (see below). Choose the table and the
column within this table containing the numeric value.
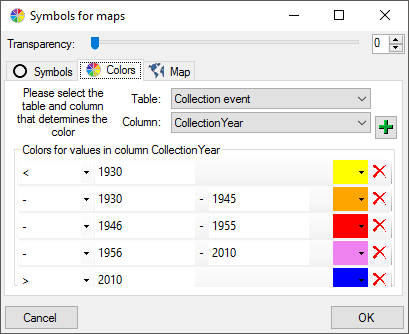
Colors
Introdoction to colors:
The colors can be linked to numeric values within the database. Select
the table and the column where the values should be taken from. Now
click on the add button to add colors and the
restrictions linked to the colors as shown below.
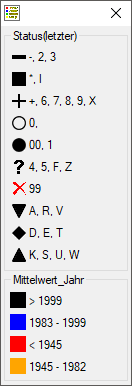
Legend
Introduction to  legend:
With a click on the button, you can open a window
listing all symbols and colors with their attributed values (see below).
In the spreadsheet window, click on the button
underneath the button to open the legend.
Evaluation
There are 3 types of maps available:
Map for WGS84 geography of organisms
For this map type you have to set the table and the column containing
the WGS84 geography, i.e. a content
like POINT(45 … ) for the organism as shown below. Every entry will
be shown in the map with its exact geography.
Map with WGS84 coordinates
 For this map type you have to set the table and the column containing
the WGS84 geography, i.e. a content
like POINT(45 … ) for the collection event as shown below. Every entry
will be shown in the map with the symbol placed in the center of its
geography.
For this map type you have to set the table and the column containing
the WGS84 geography, i.e. a content
like POINT(45 … ) for the collection event as shown below. Every entry
will be shown in the map with the symbol placed in the center of its
geography.
Map for objects aggregated according to TK25 quadrants
 Filter table /
Column: For this map type all objects within a TK25 quadrant will be aggregated to one
value. For the filter according to which the aggreagation is performed,
you have to select the table and the column containing the combination
of the TK25 identifier and the quadrant (see below).
Filter table /
Column: For this map type all objects within a TK25 quadrant will be aggregated to one
value. For the filter according to which the aggreagation is performed,
you have to select the table and the column containing the combination
of the TK25 identifier and the quadrant (see below).
 Gazetteer for
retrieval of TK25 coordinates. The coordinates for the symbols
will be obtained from a gazetteer module. Please select the source as
shown in the example below.
Gazetteer for
retrieval of TK25 coordinates. The coordinates for the symbols
will be obtained from a gazetteer module. Please select the source as
shown in the example below.
Sequence of the
symbols as shown in the map: The sequence of the symbols resp.
the states linked to these symbols can be set here. Use the add button to add an entry at the end of the list and
the delete button to clear the whole list. To remove a
single entry from the list, just click the entry you want to remove.
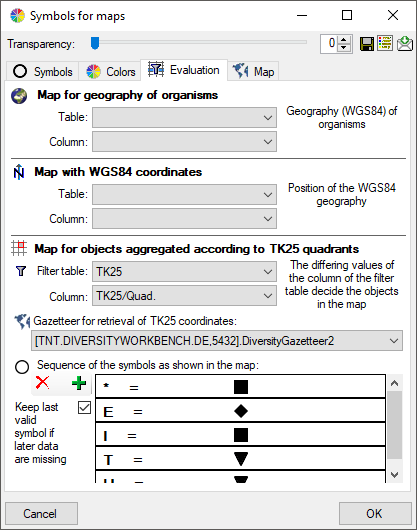
With the option Keep
last valid symbol if later data are missing you can keep the last
valid symbol if in the later evaluated data the correspondig values are
missing.
Map
To display your data in a predefined map you can set this map with a
click on the open button as shown below.
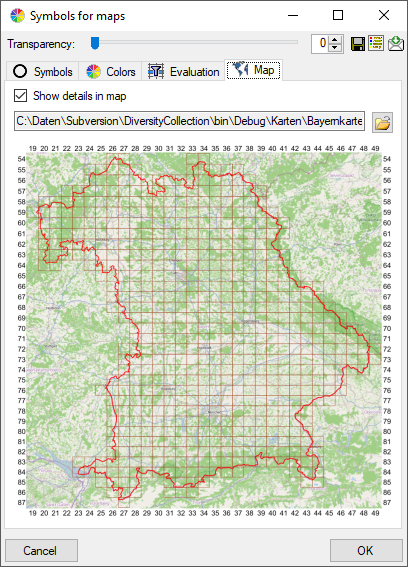
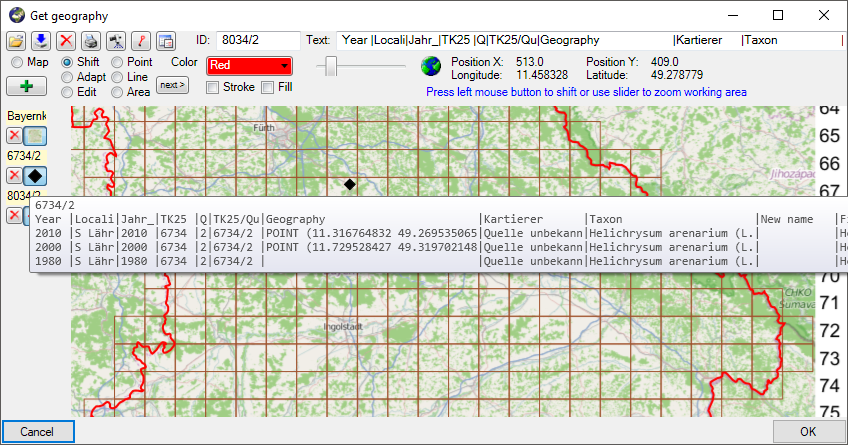
With the option Show details in map the tooltip
in the map will display the details of the data as selected in the
spreadsheet (see below). The widths in the tooltip roughly corresponds
to those set in the spreadsheet. Tutorial:
Maps for organism geography, WGS84 coordinates of the collection event and TK25
Tutorial:
After the parameters for the map are set you can choose among 3 types of
maps:
Map with WGS84 geography of the organisms
This map will show the geography of the organisms.
Map with WGS84 coordinates of the collection event
This map will show all entries with a WGS84
geography.
Map for objects aggregated according to TK25 quadrants
This map will aggregate all entries according to the TK25 quadrants as
shown below.
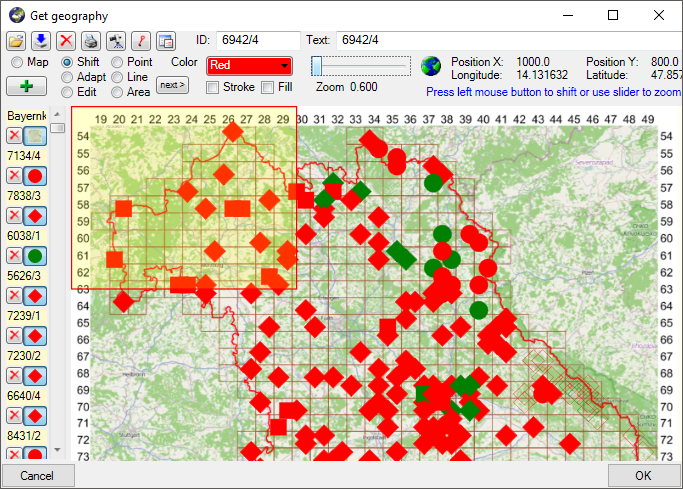
To select the data that should be edited either use the frame (as
described in GIS: Save samples and GIS:
Settings ) or select resp. deselect single data
with the mouse. Click OK to close the map and return to the spreadsheet
containing only the data selected in the map for further editing. For
the TK25 map the filter will be set for the TK25/Quadrant column while for the WGS84 map the filter will be set for the
column IdentificationUnitID
corresponding to organisms shown in the map. The column
IdentificationUnitID will be shown in the spreadsheet if you use the
later filter. Short tutorial:
As only one symbol and color can be shown for every quadrant, a certain
routine is used for the determination.
Color: For the color sortable
values must be provided, e.g. the year or a period. The sorting will be
according to the values were the highest value (e.g. the last year or
period as determined by the user, see above) is preferred.
Symbol: For the symbol the sorting
is determined by the user (see above).
The default routine for the determination:
- Reduce the values for the quadrant to the first digit e.g. 2413 will
be reduced to 2
- Test every data row in the table that corresponds to the filter value
(e.g. TK25 + Quadrant as determined by the user, see above).
- The geography can not be determined - ignore this row. (The
geography is determided via a gazetteer, see above)
- The value for the color is missing - ignore this row.
- The value for the color found in the data row is higher than the
value found so far
- Use this row to determine the color
- The value for the color in the data row is higher than the
color value associated with the symbol found so far
- Use this row to determine the symbol
- The row contains NO value for the symbol and the option
" Keep last valid symbol if later data
are missing" is NOT selected
- Use the symbol for missing values (determined by the user,
see above)
- The value for the color in the data row is equal to the color
value associated with the symbol found so far
- The value for the symbol in the row is above the value found so
far
- Use this row to determine the symbol
- No value for a symbol is found
- Use the symbol for missing values (determined by the user, see
above)


