Diversity Collection

Grids
To edit the data in a data grid, select Grid mode
for the specimen
 , the organisms
 , the parts
 , the images
 the collection events
 or the collection event series
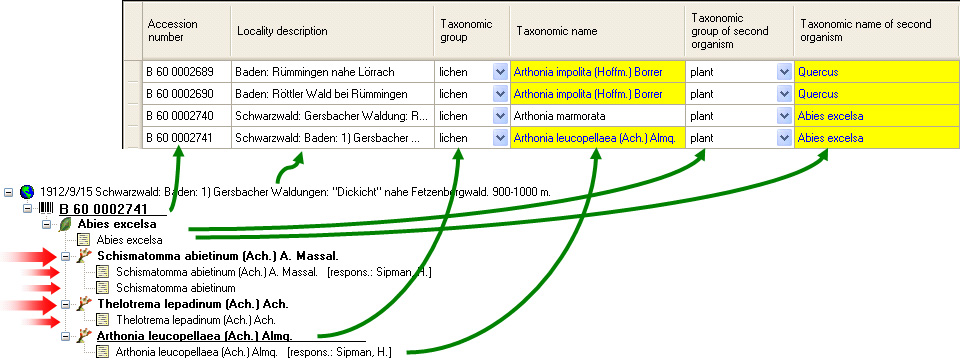
 from the menu. A window will open where
each dataset from the query result list is represented in a single line for
a specimen, an organism, a CollectionEvent or a CollectionEventSeries
respectively. Please note that in this view, only a limited part of the
data is visible. For example, only the most recent identification of an
organism is displayed. This is shown in the image below,
where two organisms (marked with red arrows) are not visible in
the grid view because only the latest identification per organism is shown.
from the menu. A window will open where
each dataset from the query result list is represented in a single line for
a specimen, an organism, a CollectionEvent or a CollectionEventSeries
respectively. Please note that in this view, only a limited part of the
data is visible. For example, only the most recent identification of an
organism is displayed. This is shown in the image below,
where two organisms (marked with red arrows) are not visible in
the grid view because only the latest identification per organism is shown.
When using grid mode for organisms, all organisms will appear, but only with their most recent identification.
Customise column headers
The names of the columns can be changed using the database description.
Customise fiel visibility
The selection of the visible fields can be adjusted in the tree above the list. Change the selection of the columns and click on the Set columns button.
Customise column width and sequence
To adjust the width of the columns or the height of the rows, either drag
the border with the mouse or double-click on the border to obtain the optimum
size for a column. You can also click the  button for the optimal height of the rows or the
  button for the optimal width of the columns. To change the
width and sequence of the columns, drag the
columns to the position of your choice or adjust the width to your
preference. These changes will be saved for this session and
the next time you use grid mode. To return to the original sequence
of the columns, click the Reset sequence button.
button for the optimal width of the columns. To change the
width and sequence of the columns, drag the
columns to the position of your choice or adjust the width to your
preference. These changes will be saved for this session and
the next time you use grid mode. To return to the original sequence
of the columns, click the Reset sequence button.
Sorting the data
To sort the data in the grid, click in the header of the column you want to use as the sorting column. The sort will persist even if you change values in that column. This means that if you change a value in the sort column, the changed record will be placed in the new position according to its new value. The sorting of a column is indicated by an arrow indicating the direction of sorting (up or down) and by a thicker right margin of that column (see image below).
Find and replace
To use the find and replace functions, you must either select several fields in this column or click the  button to select the whole column. You can then select the function you
wish to use (remove, insert, append or replace). To replace a part of
the text in the selected fields, type the text to be replaced
and type the replacement in the appropriate fields. To start the
replacement, click on the
button to select the whole column. You can then select the function you
wish to use (remove, insert, append or replace). To replace a part of
the text in the selected fields, type the text to be replaced
and type the replacement in the appropriate fields. To start the
replacement, click on the  button. To insert a
string to the beginning of all entries in the selected fields, click
the
button. To insert a
string to the beginning of all entries in the selected fields, click
the  button. To append a string to all entries
in the selected fields, click the
button. To append a string to all entries
in the selected fields, click the  button. To
remove all entries from the selected fields, click the
button. To
remove all entries from the selected fields, click the  button.
Transfer from spreadsheet
You can transfer data from a spreadsheet, such as Excel or Calc. Copy the relevant columns from your spreadsheet and paste them into DiversityCollection. Click in the top-left cell where the data should be inserted, then open the context menu (click the right mouse button) and select Insert to paste the data.
Editing
Some columns cannot be edited directly, but are linked to external modules or services. These columns are displayed as buttons. Click on the button to access the service. If a value is linked to an entry in an external module, the background will change to [yellow], and the text will no longer be editable.
Together with the links (as shown in the example above [Link to
DiversityAgents]), you can also select columns that
allow you to remove links to modules (e.g.
[Remove link for collector] in image above). These
columns appear as buttons  . Simply
click on the button associated with a link to remove the connection to the
corresponding module. After doing so, you can edit the text field containing
the previously linked value.
. Simply
click on the button associated with a link to remove the connection to the
corresponding module. After doing so, you can edit the text field containing
the previously linked value.
Some values are linked to a predefined list of options. To change such a value, use the drop-down list available in the column.
New dataset
If you click on the empty line at the base of the data grid, you will be
asked if you wish to create a new dataset. The program will ask you for
a new accession number and the project of the new dataset. Another way
to create a new dataset is to use the copy button  . Simply
click on the row you wish to create a copy of and then click on the
copy button . For details see the Data
section. A copy of the dataset will be inserted at the base of the data
grid.
. Simply
click on the row you wish to create a copy of and then click on the
copy button . For details see the Data
section. A copy of the dataset will be inserted at the base of the data
grid.
Saving the data
To save all changes, click the  button. To undo
all changes since the last time the datasets were saved, click the
button. To undo
all changes since the last time the datasets were saved, click the  button. To save the changes to the current dataset
use the
button. To save the changes to the current dataset
use the  save button. To undo the changes in the
current dataset, click the
save button. To undo the changes in the
current dataset, click the  undo button. If you click
the OK button, you will be asked if you want to save the changes before
the window closes. If you click the Cancel button or close the window, your changes will not be
saved. To export the data displayed in the grid as a text file with tabs as
column separators, click on the
undo button. If you click
the OK button, you will be asked if you want to save the changes before
the window closes. If you click the Cancel button or close the window, your changes will not be
saved. To export the data displayed in the grid as a text file with tabs as
column separators, click on the  export button.