Diversity Collection

Spreadsheets
The program provides several spreadsheets with different focus:
- Event
- Main table: CollectionEvent
- The focus is the collection event
- TK25
- Editing data that are linked to a TK25 entry.
- The sheet provides a link to distribution maps with the option to select data via these maps
- Organism
- Mineral
- Focus on mineral specimen
- Part
- Collector
- Main table: CollectionAgent
- All collectors of a specimen
- Image
- Main table: CollectionSpecimenImage
- All images of a specimen
- Analysis
- Main table: Analysis
- Administration of the analysis
The spreadsheets similar to the grids provide a tabular access to the
data. In addition you can search and filter data independent from the
main form. For an introduction see two short tutorials
 (overview),
(tables and columns). To open a spreadsheet, choose
(overview),
(tables and columns). To open a spreadsheet, choose
 Grid -
Spreadsheets - and then one of the provided versions, e.g.
Grid -
Spreadsheets - and then one of the provided versions, e.g.
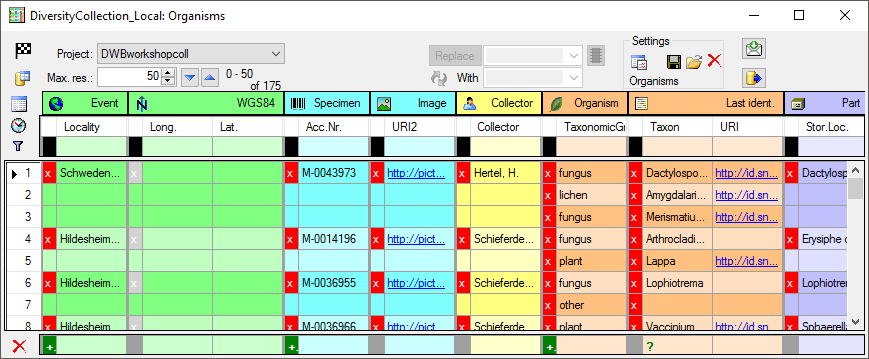
 Organisms from the menu. A window as shown below will open where the data are marked and organized according to the database tables. If values in one of the tables are missing, this will be indicated with a grey background. The colors correspond to the overview for the database.
Start
To use any of the spreadsheets as a starting window, click on the  button. Now the application will directly open the spreadsheet with the same parameters when you close it.
Database
To change to another database, click on the  button and choose the database as described here.
Please keep in mind that the main form will connect to the new selected
database.
button and choose the database as described here.
Please keep in mind that the main form will connect to the new selected
database.
Project
 If a user has read only projects available, a
 button will appear in front of the project. Click on this button to change to the list of projects with read only access. The window will change into the Read only mode (see below). To return to the list of projects with write access, just click no the button again. After changing the source for the project list, the project label will blink with red to remind you, to select a project from the list.
Getting the data
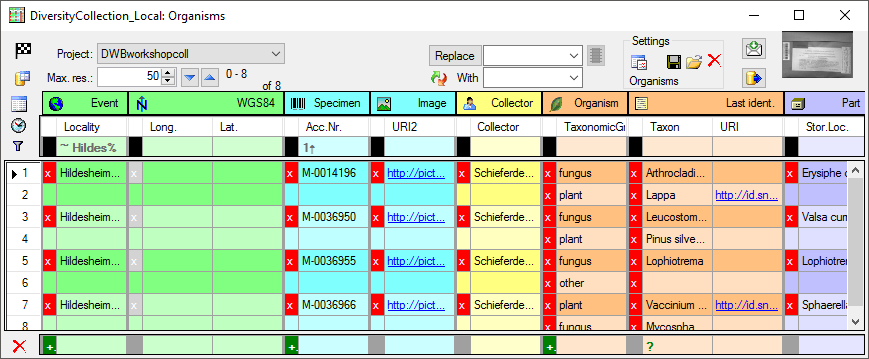
 The data are always restricted to one project, selected in the corresponding field (see image above) and restricted to the first top lines as specified in the Max. res. field. To change to the next or previous block of data, use the
  resp.
resp.  button.
The program will organize the data in blocks indicated by the colors as
shown above. In the example above the first block contains 2
Organisms
all belonging to the block starting with Hildesheim...
for the  Event
and M-0014196 for the
Event
and M-0014196 for the
 Specimen. The next block then starts with
Hildesheim... indicated by a
change in the color containing 2 Organisms. For most of the spreadsheets, the
presence of the Event in the data is a
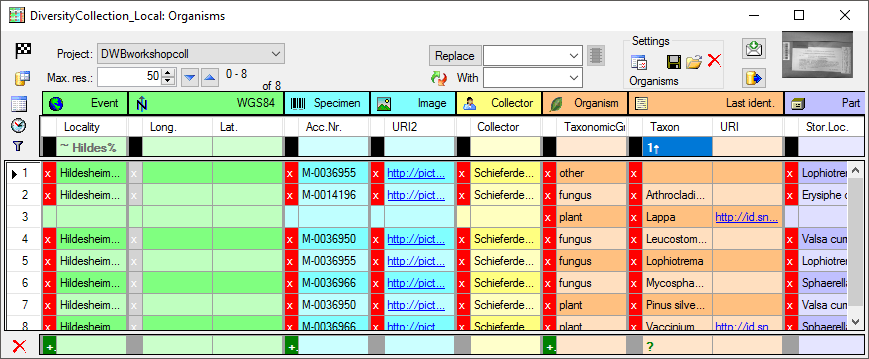
prerequisit. As long as you do not sort or filter the data (see below), these blocks will be consistent with the data. As soon as you filter or sort the data, these blocks may be split and may not correspond to the data blocks in the database any more. In the example below you see the effect of sorting by the column Taxon on breaking up the blocks. E.g.
the block for the specimen M-0036950
is split into 2.
Specimen. The next block then starts with
Hildesheim... indicated by a
change in the color containing 2 Organisms. For most of the spreadsheets, the
presence of the Event in the data is a
prerequisit. As long as you do not sort or filter the data (see below), these blocks will be consistent with the data. As soon as you filter or sort the data, these blocks may be split and may not correspond to the data blocks in the database any more. In the example below you see the effect of sorting by the column Taxon on breaking up the blocks. E.g.
the block for the specimen M-0036950
is split into 2.
SQL
The query used for the retrieval of the data can be accessed with a click on the SQL button.
Filtering
To filter the content of a table you can apply a filter either on the whole table or on each of the columns of the table.
Table filter
This filter will apply on the whole table. Click in the black box next to the filter area and select one of the filter options as shown below.
- ♦: Filled (all visible columns)
- ◊: Empty (all visible columns)
- •: Data in table do exist
- Ø: Data in table do not exist
Column filter
This filter will apply on a single column of a table. To set a filter click in the field underneath the column name. A window as shown below will open. With a click on the  add button you can enter a value from the current content of the column as filter.
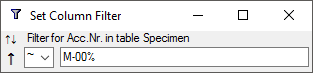
Here you set the sorting (see below), enter the search string and choose among several ways of comparison with the contents in the database:
- =: The content must be exactly like the given value
- ≠: The content must be different to the given value
- ~: The content must be similar to the given value, use wildcards % for any string or _ for a single character
- ¬: The content must NOT be similar to the given value, use wildcards % for any string or _ for a single character
- <: The content must be smaller than the given value
- >: The content must be bigger than the given value
- |: The content must be in a given list of values
- ∉: The content must NOT be in a given list of values
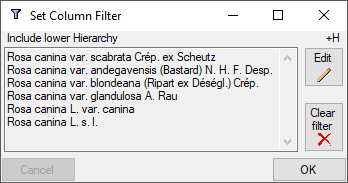
For columns linked to modules of the DiversityWorkbench there may be additional options. E.g. for a column linked to DiversityTaxonNames you get 3 additional options:
- +H: Include lower Hierarchy
- +S: Include Synonyms
- +H+S: Include lower Hierarchy and Synonyms
After selecting one of these options, you will be asked for the database
and the project where the data should be taken from. In the next step
the corresponding names as retrieved from the selected source will be
listed (see below). To change the filter click on the
 button and on the
  delete button to
remove it.
delete button to
remove it.
Sorting
↓↑ Tutorial:
The data can be sorted by each visible column. If you click into the field underneath the column name a window will open as described above. To change between the modes of sorting, just click on the current sorting. The modes are:
- -: Not sorted
- ↑: Sorted in ascending sequence
- ↓: Sorted in descending sequence
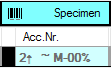
After all parameters are set, the sort mode and filter settings will be shown in the field underneath the column name (see image below). The number indicates the sequence within the sorting columns.
Timeout
 After all parameters are set, click on the button. If for any reason you get a timeout, meaning the query for the data takes too long, either simplify your query or adapt the time for the query after a click on the button. If you do not want to restrict the time for the queries, set the value to 0. The
default value is 30 seconds.
After all parameters are set, click on the button. If for any reason you get a timeout, meaning the query for the data takes too long, either simplify your query or adapt the time for the query after a click on the button. If you do not want to restrict the time for the queries, set the value to 0. The
default value is 30 seconds.
Read only mode
<>  Tutorial:
The formatting of the sheet including the color indication of tables and data blocks is rather time consuming. If these are not needed, e.g. for exporting the data, you can switch to
the Read only mode for higher performance. For projects with read only access (see above), the mode is automatically set to Read only.
Editing
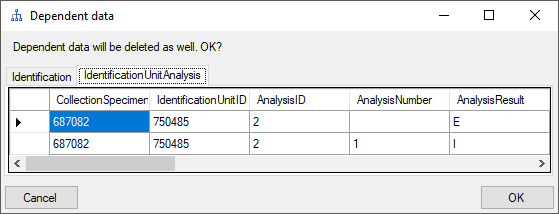
To edit the data, just change them. If data are missing, type or select a value in the corresponding field. To remove data, click on the x field. This will remove all entries dependent on this entry that means all data right from the entry in the same line resp. block and any depending data. If there are any depending data, a window will open as shown below listing these data. Click OK if you want to remove the selected data including all depending data as shown in the window.
To change the content of several values in a column, either select the whole column with a click on the  button or select the fields manually. To avoid the pop-up of data-entry windows e.g. for columns with a lookup list, click no the
  button. Once you have selected the
contents to change, select the mode of change:
button. Once you have selected the
contents to change, select the mode of change:
 Prepend: Insert the given value at the beginning of the content
 Append: Append the given value at the end of the content
 Overwrite: Remove current content and insert given value
 Replace: Replace a string in the content with the given value
 Clear: Remove the content
After selecting the change mode, enter the text in the field where necessary and click on the corresponding button to perform the changes.
With the context menu (mark area and right click) you can
Remove data (for single data fields with a list behind),  Tranfer or
  Copy the content into the clipboard and
  Insert the content
of the clipboard into the selected cells. Tutorial:
Insert the content
of the clipboard into the selected cells. Tutorial:
Locked columns
Columns that can not be edited are indicated with a lighter background color of the header and a gray text of title and content. These columns contain e.g. database generated content or data from lookup tables.
Inclusion of RowGUID
By default the primary key can not be changed in the spreadsheet. In some cases you may want to change parts of the primary key. To do this, you must include the column RowGUID in the list of selected columns. The program will ensure that the changed data do not collide with existing data, that is having the same primary key. See an example in a short tutorial:
Fixed sources
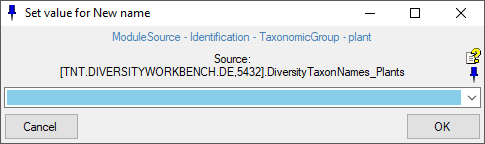
For columns that are linked to a remote module, you can fix the
source for the query. If the source is fixed, the query will directly contact the source as shown in the image below. To set resp. change the source, click on the  button. A window will open where you can select either a webservice or a source database together with a project within the database. To remove the source, click on the
button (only visible if a source is present).
button. A window will open where you can select either a webservice or a source database together with a project within the database. To remove the source, click on the
button (only visible if a source is present).
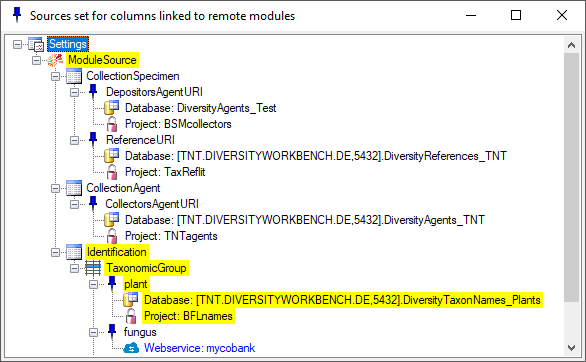
To see an overview for the fixed sources, click on the
 button. A window will open where all sources are listed with the source for the current
column marked with a yellow
background.
button. A window will open where all sources are listed with the source for the current
column marked with a yellow
background.
A "right-click" on the button in the main form will show the settings as well and with a click on the
button you can set the connection for the selected column. If a column depends on values from the data as for example the relations to the module DiversityTaxonNames with a dependence on the taxonomic group, the relation will change with the selected row, depending on the data retrieved from the selected row. If there is no connection to the related module defined, the button will appear gray
 and if the column has no relation to a module, the button will appear like
If the source is not fixed the query will start as described here.
Settings
 -
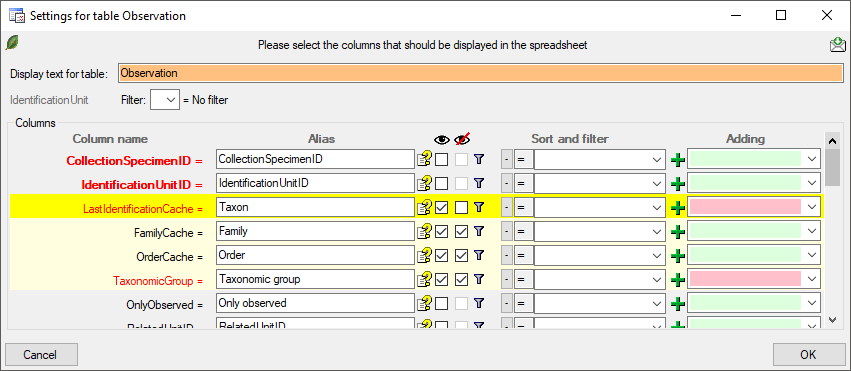
To change the data shown in the query results, either click on the header of the tables, e.g. Event for that table. A window as shown below will open where you can select or deselect columns, change their headers etc. Red columns need to be filled (either by the database, the program or the user). In the Alias field you can rename the columns to your preferences. The
button will show a description of the columns. For columns linked to a module, the current settings for the link will be shown in addition to the description. To display a column in the sheet use the
-
To change the data shown in the query results, either click on the header of the tables, e.g. Event for that table. A window as shown below will open where you can select or deselect columns, change their headers etc. Red columns need to be filled (either by the database, the program or the user). In the Alias field you can rename the columns to your preferences. The
button will show a description of the columns. For columns linked to a module, the current settings for the link will be shown in addition to the description. To display a column in the sheet use the  checkbox
  .
If a column is needed, but should be hidden, select the
.
If a column is needed, but should be hidden, select the
 checkbox. Displayed columns are indicated by a yellow background while hidden columns get a light yellow background. Certain columns are required (indicated by a purple color) and can not be removed e.g. if they are involved in a link to a remote module like in the example below the columns FamilyCache and OrderCache. Columns linked to a module are indicated by a blue color.
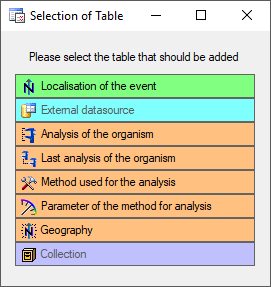
The  button allows you to include one of the tables missing in the sheet (see image below). After selection of the table, select the column(s) you want to include in the sheet as shown in the image above.
To store resp. load settings, use the  resp.
resp.
 button. If a setting file has been corrupted click on the delete button to remove it and restart with factory settings. The spreadsheet will always start with the previous settings. The location where the settings are stored are set under
Administration -
button. If a setting file has been corrupted click on the delete button to remove it and restart with factory settings. The spreadsheet will always start with the previous settings. The location where the settings are stored are set under
Administration -  Resources directory ... . For an introduction see a short tutorial
.
Resources directory ... . For an introduction see a short tutorial
.
Column width
The width of the columns can be set manually (in the filter area) or automatically with a click on the  button. A window will open where you can choose and set the parameters for setting
the column width.
button. A window will open where you can choose and set the parameters for setting
the column width.
Adding
To add new data, use the area underneath the data table. You can enter preset values that will be used for the new data. If the new data should be added to existing entries, select the corresponding row. Then click on the + field of the datarange that should be inserted. If preset values are given, all corresponding tables will be filled together with the new inserted data. Defaults for the responsibles can be set under Administration - Customize Display. If a column is linked to a remote module, the corresponding columns will be filled together with the selection of the link, so e.g. if you select a link for a taxonomic name to a DiversityTaxonNames the columns for the taxon and if available the familiy etc. will be filled as well. To remove a linked value, select it a choose Remove from the
context menu (right click).
Export
To export the data as a tab separated text file (UTF8), click on the
 button. You will be asked if you want to include the hidden columns. These are the primary keys you may need for statistic evaluations etc.
Feedback
To send a feedback to the developer of the software, create a screenshot and click on the  button.
Details
To see all details of a dataset, select the dataset in the sheet and click on the  DWB button. A window, corresponding to the main form will open, showing all data related to the selected specimen.
Image

If an image is present a preview will be shown in the right upper area of the window. Click on it to see the image in a separate form. The images are restricted to the first image of one source, so e.g. in the organisms sheet only the first image of the specimen linked with this organism will be shown while images of e.g. linked to none or another organism or the collection event will not be addressed.

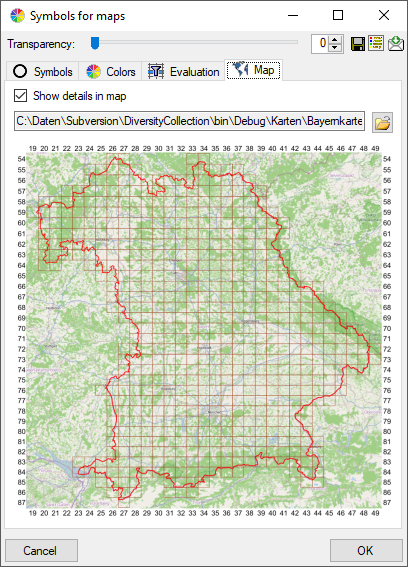
 button. A window as shown below will open, where
you can set the parameters for the map.
button. A window as shown below will open, where
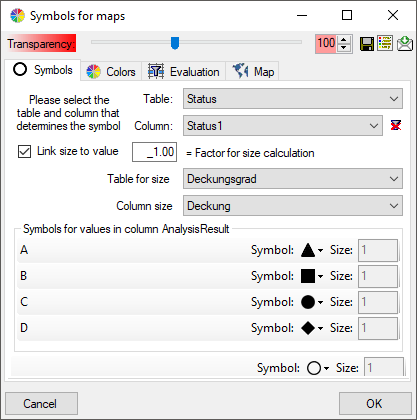
you can set the parameters for the map.  Symbols:
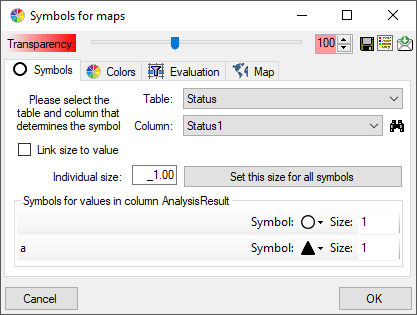
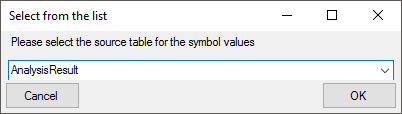
 button
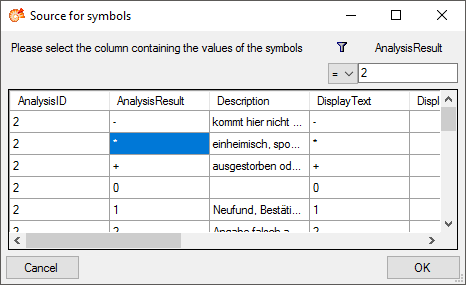
to select the source table. The programm will try to find the relevant
data an make a proposal as shown in the image below.
button
to select the source table. The programm will try to find the relevant
data an make a proposal as shown in the image below.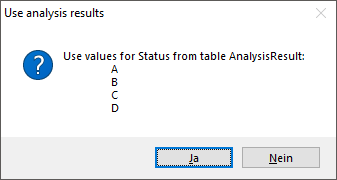
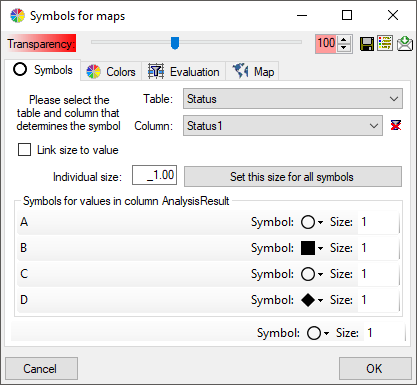
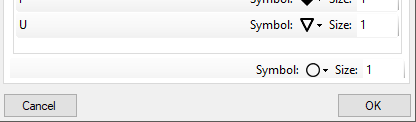
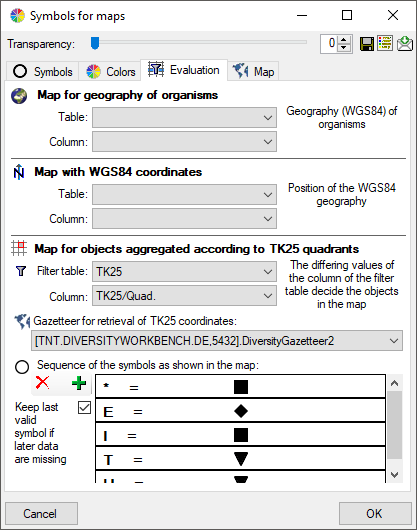
 legend:
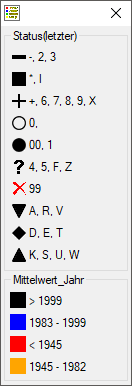
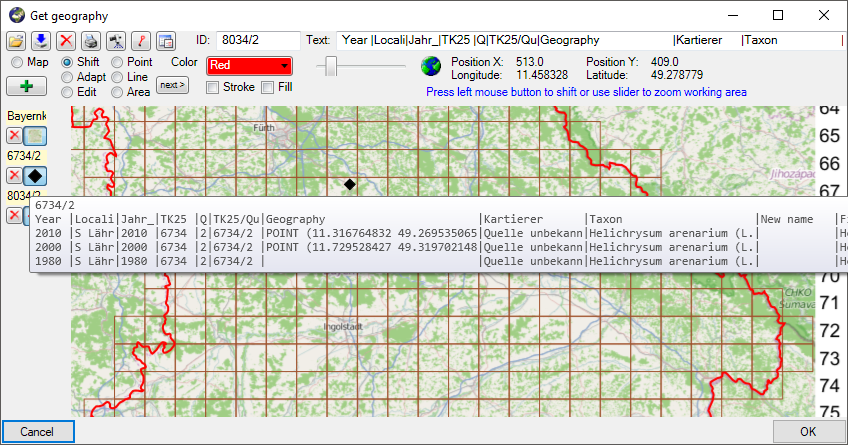
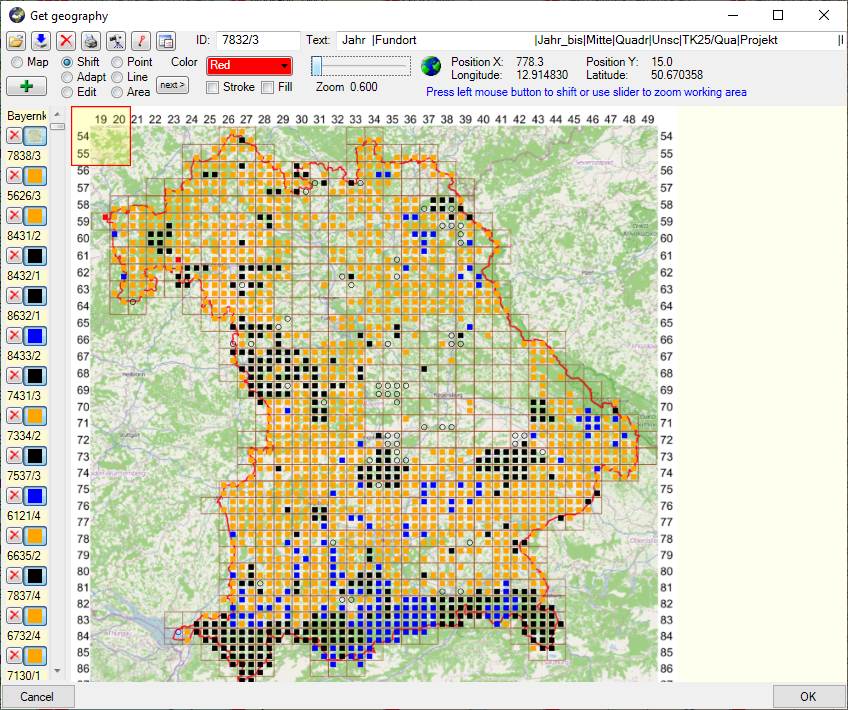
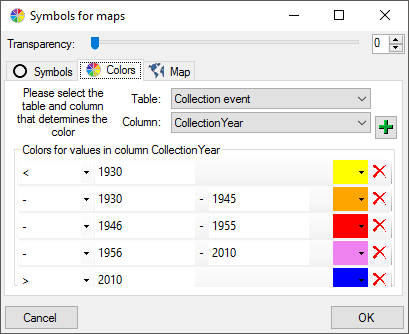
 For this map type you have to set the table and the column containing
the WGS84 geography, i.e. a content
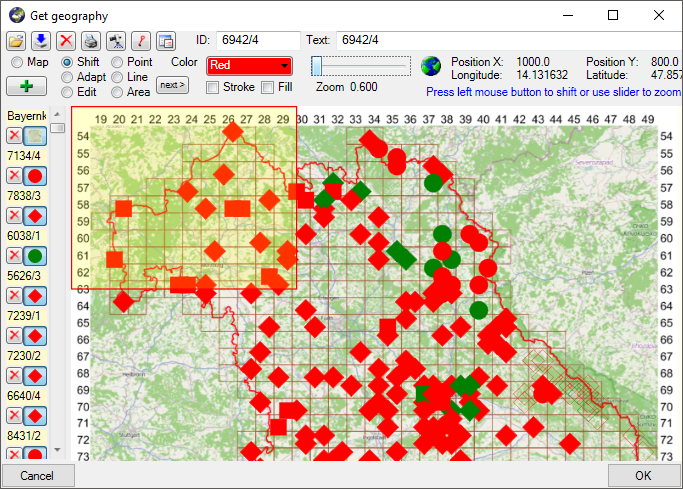
like POINT(45 … ) for the collection event as shown below. Every entry
will be shown in the map with the symbol placed in the center of its
geography.
For this map type you have to set the table and the column containing
the WGS84 geography, i.e. a content
like POINT(45 … ) for the collection event as shown below. Every entry
will be shown in the map with the symbol placed in the center of its
geography. Gazetteer for
retrieval of TK25 coordinates. The coordinates for the symbols
will be obtained from a gazetteer module. Please select the source as
shown in the example below.
Gazetteer for
retrieval of TK25 coordinates. The coordinates for the symbols
will be obtained from a gazetteer module. Please select the source as
shown in the example below.