Edit Description Grid
Copy or create descriptions
To copy one or more descriptions select the whole data rows by clicking
in the area left from the “Description title” column. In the tool strip
the copy button  appears (see image below).
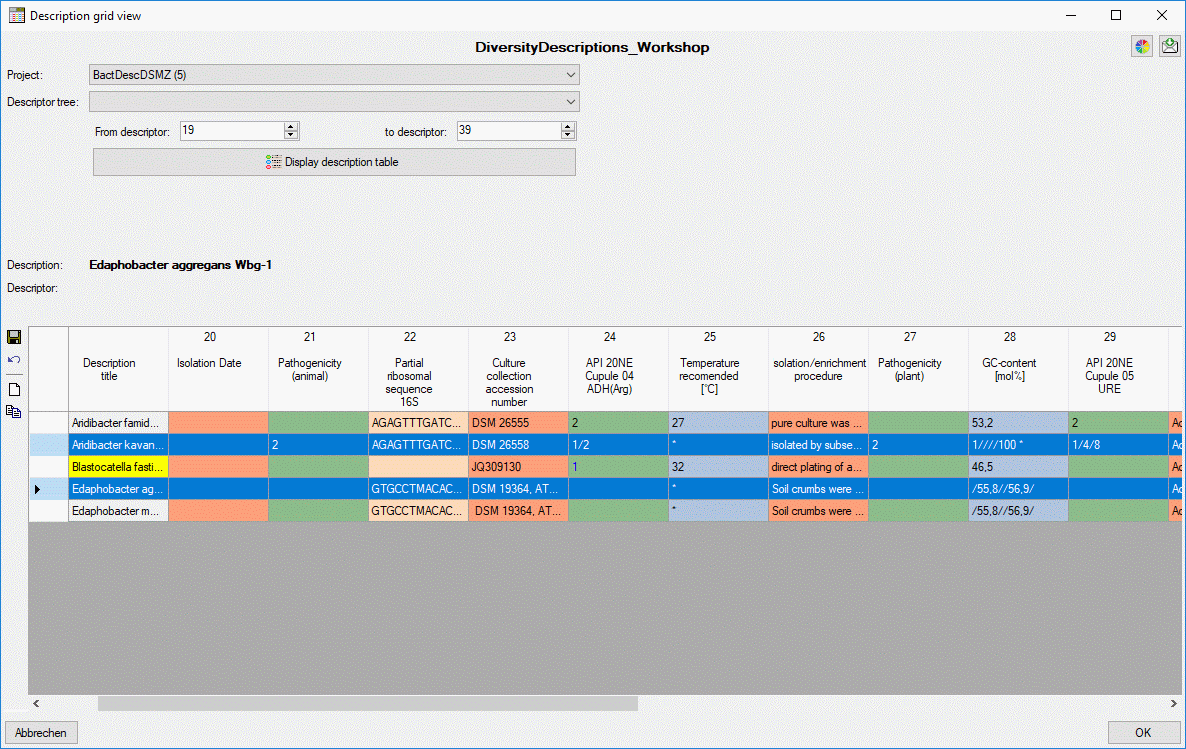
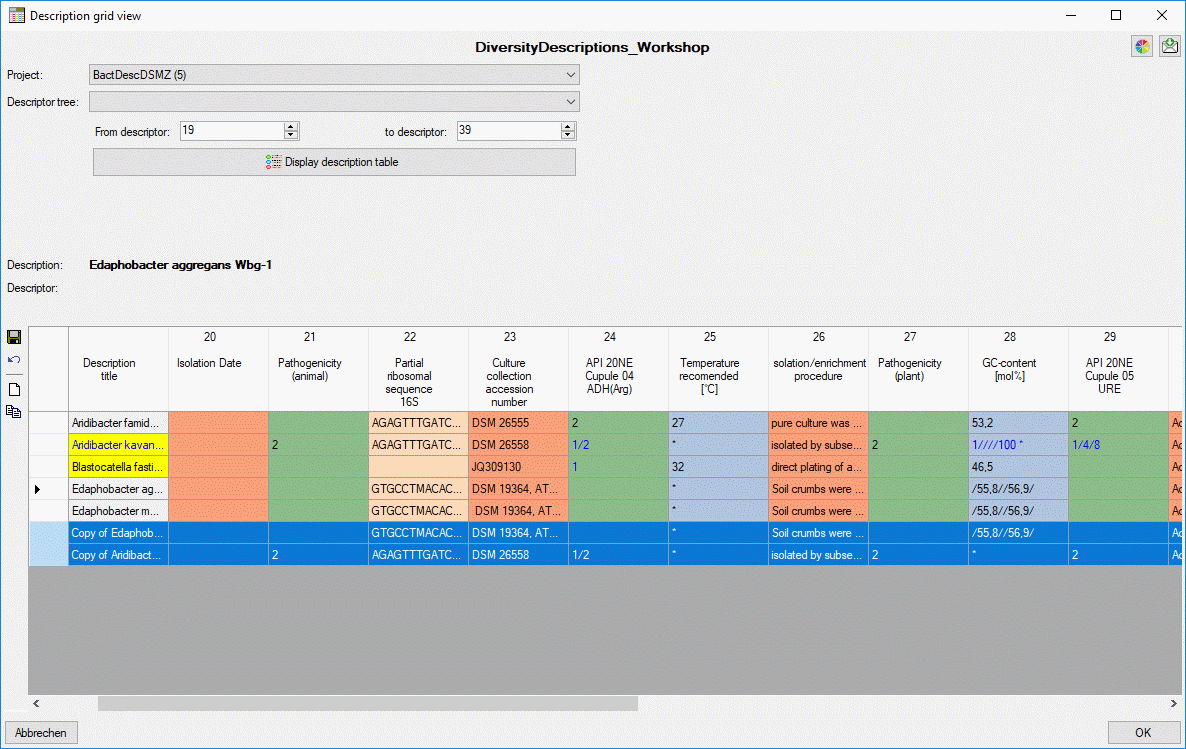
After clicking the  button you may be asked if you
want to copy description resources, too. Be aware that the copy
operation is directly performed within the database. I.e. that local
changes that have been done in the sources desrcriptions will not be
included in the targets unless you save your data before copy (see image
below, second and last line in descriptors 28 and 29).
New description
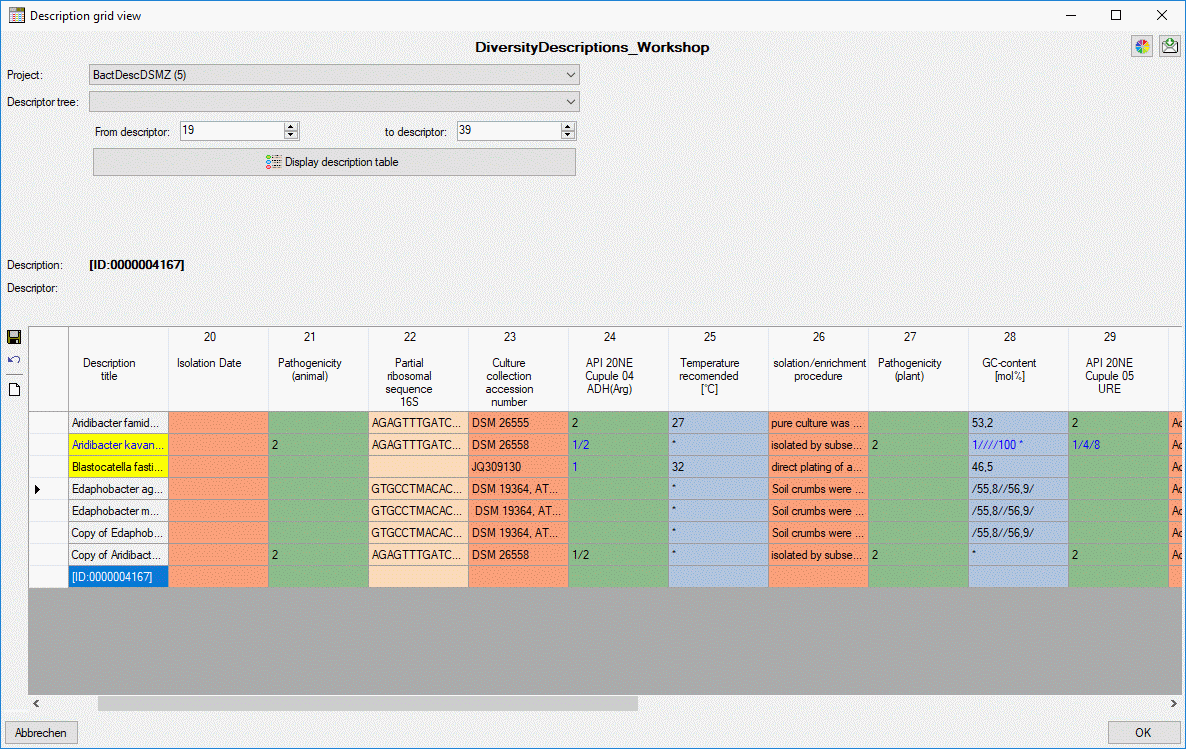
To enter a new description, click on button  and a
new row will be appended (see image below). Same as for copy the new
description is created directly within the database.
Continue with:
Edit Description Grid
Data editing
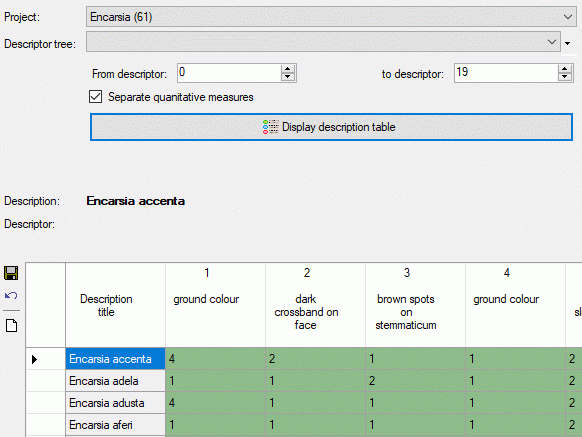
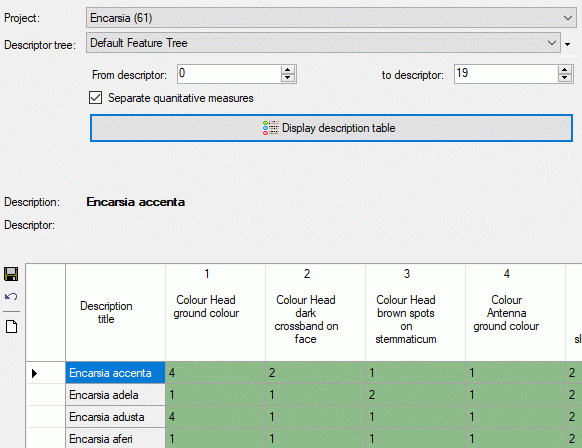
The first column of the description table shows the description titles,
which are fixed. I.e. if you scroll the summary data to the right, the
titles are still visible at the left. The other columns show the summary
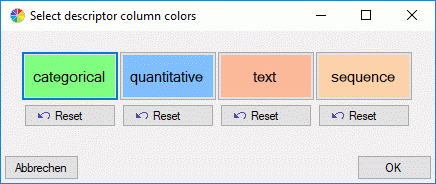
data, where the descriptor type is indicated by the background colour:
categorical, quantitative, text
or sequence. The column titles include the
descriptor name, the mesurement unit in square bracket for quantitative
descriptors and the descriptor’s sequence number (see image below).

When a summary cell in the description table is selected, the field
Description: shows the description title and field Descriptor:
shows the symbols according the descriptor type ( for categorical,
  for quantitative,
 for text and
  for
sequence) and the descriptor title. If for a descriptor resources are
available, this fact is indicated by a coloured symbol background. You
may view them by a double-click on the descriptor title. If for a
description resources are available, the symbol
 is displayed before the title. Double click in
that symbol to view the resources.
For the selected cell the summary data and the descriptor status data
are displayed in the upper right area of the window (see image above).
You may edit the data within these controls as described in
section Editing the description - Descriptor view
tab of this manual. For modified
summary cells the text colour changes to blue and the description titles will be shown
with yellow background in the table.
Changing the description title
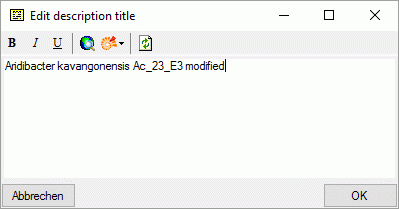
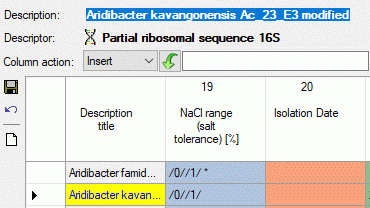
To change the description title, double-click on it in field
Description: to open a separate edit window. After comitting the
changes with “OK” the description will be marked as modified (see images
below).
Changing the summary data in the table
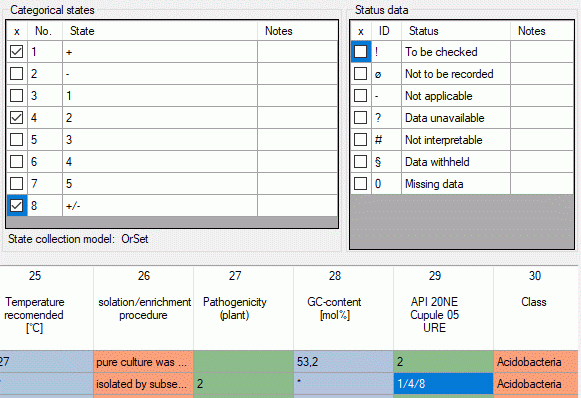
Categorical summary data
Categorical, states are specified by their
sequence number. Multiples are separated by a forward slash ("/", see
image below). Existing “notes” will be removed, if the corresponding
categorical state is not specified in the input.
Quantitative summary data
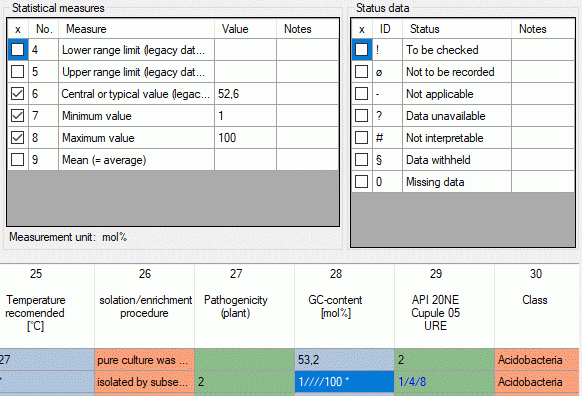
If you did not check the option Separate quantitative measures, for
quantitative summary data only the five
quantitative measures
|
|
| Min |
Minimum value |
| UMethLower |
Lower range limit (legacy data stat. meth. unknown) |
| Mean |
Mean (= average) |
| UMethUpper |
Upper range limit (legacy data stat. meth. unknown) |
| Max |
Maximum value |
can be specified within the summary table. The values must be specified
in theis given order and separated by a forward slash ("/"). E.g. 1////100 means “Min=1, Max = 100”. If only one
value without any slashes is entered, it is assumed than only the “Mean”
value is specified. To indicate that values for other than the five
mentioned statistical measures are present in the data, an asterisk
("*") is appended in the summary table (see image below, cell value
1////100 *).
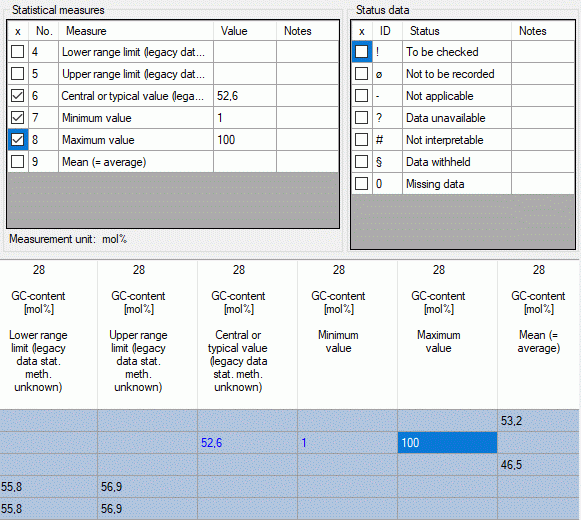
If you checked the option Separate quantitative measures, for each
statistical measure in the quantitative
summary data a separate column will be allocated in the data grid view.
I.e. you can direcly enter your values into the table (see image below).
Text descriptor and Molecular sequence data
For Text and
sequence data the texts may be edited directly within the table.
The corresponding “notes” will not be affected.
Changing values in a table column
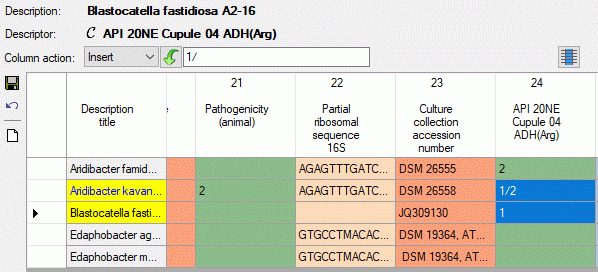
It is possible to modify several values of a single table column.
Therefore select the table entries that shall be edited - by selecting
an entry and clicking the button  in section
Column action you may select the whole table column (see image
below). Then select the required operation: “Insert”, “Append”,
“Replace” or “Clear” and enter the new rsp. new and old value. After
clicking the action button - depending on the selected Column action
this is
  (Insert),
  (Append),
  (Replace) or
  (Clear). Be aware that this feature performs a pure text operation in
the table columns. Especially for quantitative and categorical data
columns the resulting data will be interpreted according to the rules
described above an might lead to unsexpected results, if not designed
ver carefully.
Continue with:
Edit Description Grid
Save or discard changes
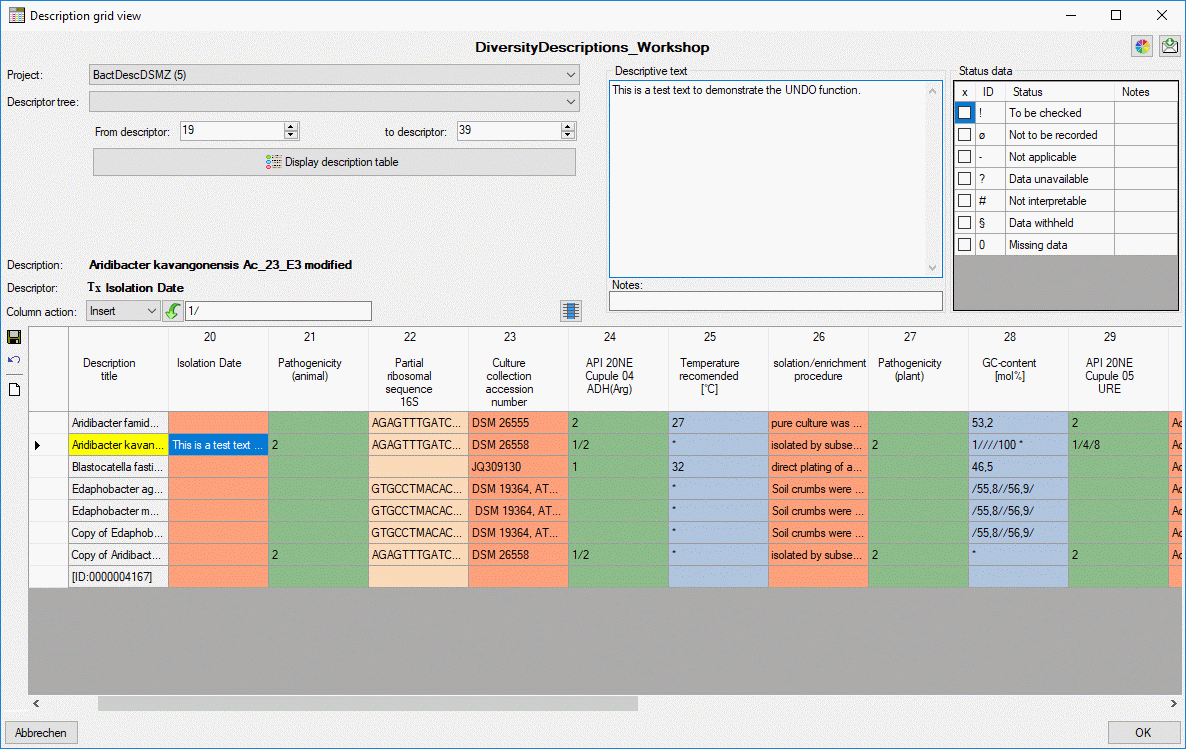
When you click in button “OK” the description grid view is closed and
all changes are automatically saved in the database. If you did some
changes and want to save them without leaving the form, simply click on
 (see image below). If you close the window, e.g. by
clicking the “Cancel” button, and still have unsaved changes, you will
be asked to save or discard the changes.
Undo all changes
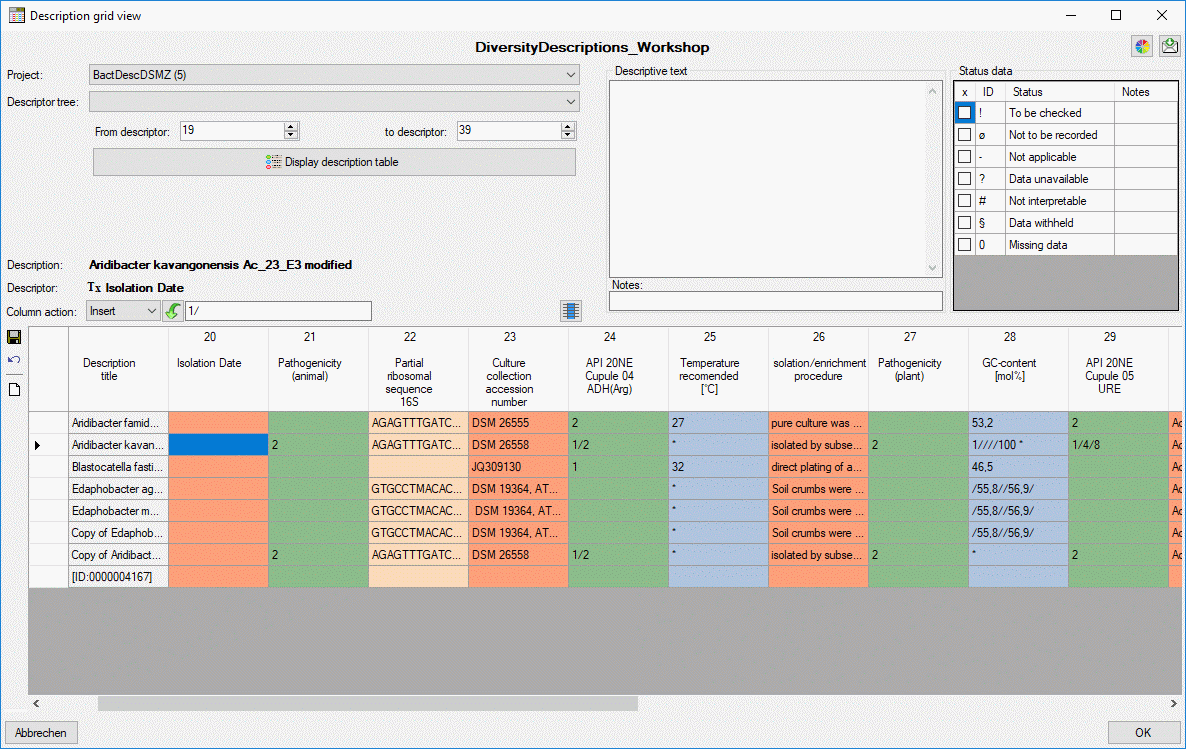
You may discard all unsaved changes without leaving the form by clicking
the  undo button and the data will be reloaded form the
database (see image below).
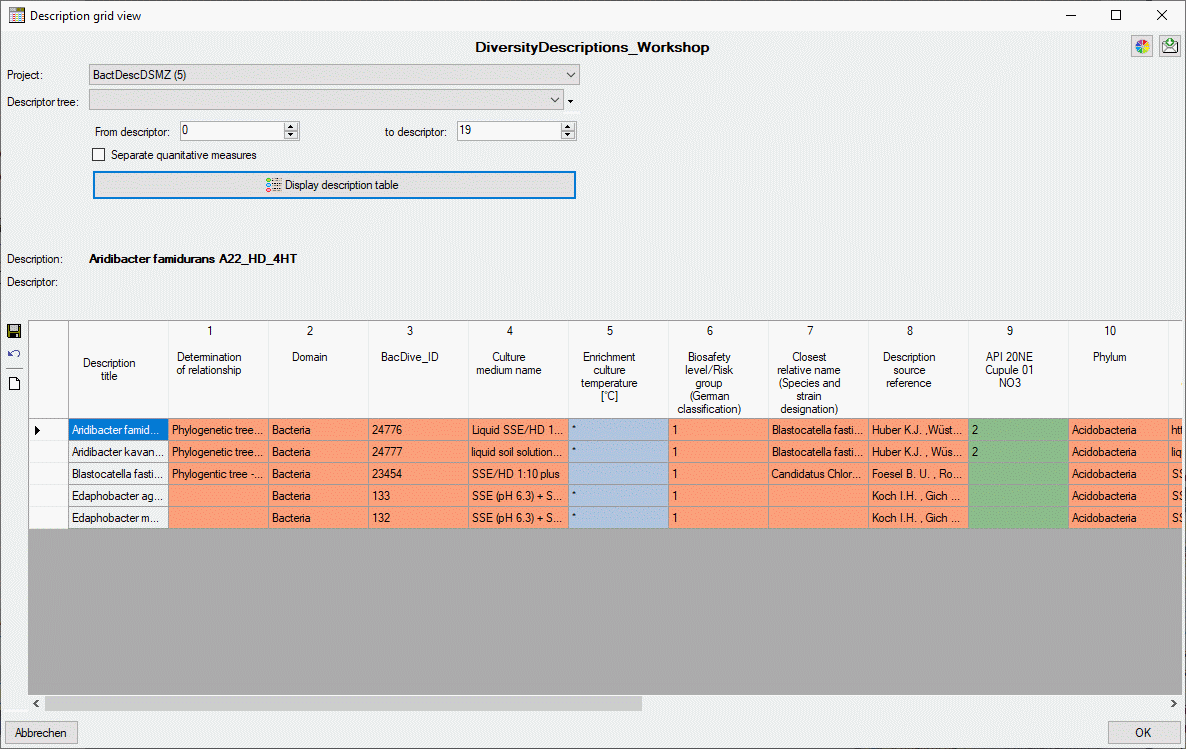
 Grid →
  Description
grid view … from the menu. The query result list is passed to the
description grid view form and a window as shown below opens (click the
button




 and a
new row will be appended (see image below). Same as for copy the new
description is created directly within the database.

 for categorical,
  for quantitative,
 for text and
  for
sequence) and the descriptor title. If for a descriptor resources are
available, this fact is indicated by a coloured symbol background. You
may view them by a double-click on the descriptor title. If for a
description resources are available, the symbol
 is displayed before the title. Double click in
that symbol to view the resources.


 in section
Column action you may select the whole table column (see image
below). Then select the required operation: “Insert”, “Append”,
“Replace” or “Clear” and enter the new rsp. new and old value. After
clicking the action button - depending on the selected Column action
this is
  (Insert),
  (Append),
  (Replace) or
  (Clear). Be aware that this feature performs a pure text operation in
the table columns. Especially for quantitative and categorical data
columns the resulting data will be interpreted according to the rules
described above an might lead to unsexpected results, if not designed
ver carefully.


