Data Editing
Editing the data
The database of DiversityDescriptions consists of three major areas:
- The descriptive data (descriptions) reference
elements of the descriptive terminology and add specific data, e.g.
numeric values.
- The descriptive terminology, consisting of
descriptors, categorical states, statistical measures and modifiers.
- The project data build the administrative frame for
terminology and descriptions. Each description belongs to exactly one
project. By additional entities (descriptor tress) it is possible to
restrict the descriptors, statistical measures and modifier that shall
be used in a certain project.
In almost all forms an Extended text editor can be
opened for single text fields that provides additional editing features.
Corresponding with that three major sections of the data model, the
DiversityDewscriptions application provide three edit modes. The edit
mode is diplayed at the bottom of the main window (see picture below).
After the first start the edit mode is preselected to “Edit
descriptions”. You can switch the edit mode using the menu Edit->
Descriptions, Edit→ Descriptors or Edit->
Projects. Alternatively you may switch the edit mode by click the mode
button in the upper left corner of the header area (item 3 in picture
below) or on the tiny triangle besides the edit mode display in the
status line at the bottom (see item 4 in picture below).
The main window of the DiversityDescriptions client contains two main
areas. At the left you find the query and the results of this query. In
the right part the data of the dataset selected in the result list is
shown.
Basic operations
In each edit mode there are some common functions for storing and
reloading data, to create a new dataset or delete or copy the actual
dataset. On top of the query results (item 1 in image above) there is
button  to store the actual dataset, button
 to delete the actual dataset and button
 to create a new dataset. By pressing button
 the actual dataset is reloaded, i.e. changes that
have been made will be dropped. Finally, button
the actual dataset is reloaded, i.e. changes that
have been made will be dropped. Finally, button  copies the data of the actual dataset to a new one.
Some of those buttons can be found in the tool bar at the right side of
the edit window (item 2), too.
Additionally to explicit saving by pressing the
button, an automatic saving of the dataset is done, if an entry in the
query result list is selected or a new query is performed. If a dataset
has been modified without saving, a message window will appear and ask
if changes shall be saved for several actions, e.g. change of edit mode,
connetion to a database or if the application is closed.
Translations
For many database tables the text columns may be translated into
different languages. To enter, modify or view the translated texts, use
the translations editor. For an overview on
multilingualism in Diversity Descriptions see chapter
translations.
When you have started a query and selected a description, you may open
an HTML form to view and edit the data
(button marked as item 5 in image above). It provides a simplified user
interface for access to a subset of the description data.
Description grid view
An alternate form for editing or viewing the data of several
descriptions in a grid is provided by the description gridview. It provides a simplified user interface
for access to a subset of the description data.
Sample data grid view
An alternate form for editing or viewing the sample data of several
descriptions in a grid is provided by the sample data gridview.
Table editors
For a selected set of database tables a direct data editing in a grid is
provided by the table editors.
Subsections of Editing
Edit Description
Editing the description
After starting a database query and selecting an entry in the result
list the dataset is diplayed in the edit window. In the header area the
dataset name, the default project language and the URI of the current
dataset are show (see picture below). Below the header area the
description name may be edited in a text box. Changes of the description
data, e.g. the name, will be visible in the header after saving the
dataset. To check dataset changes, click on the  button to open the history. By clicking button
 you may open a simplified HTML
form to view and edit the description data.
you may open a simplified HTML
form to view and edit the description data.
The main description data may be accessed in the first Mainattributes tab, which is described below. Click on one of the other tabs in the picture below to go directly to the appropriate manual chapter.
Main attributes tab
The main attributes tab provides in the upper area a field to enter
additional description details and a wording for natural language
support. The optional filed AID may keep an alpha-numeric alternate
ID of the dataset. If used, it should be unambigious within the project,
but this is not checked by the program. Click on  to
get an overview of the used keys.
to
get an overview of the used keys.
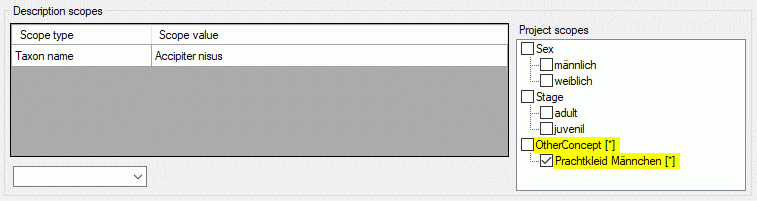
Scopes
The next section Description scopes allows specification of
description scopes. This sections consists of the scope table with scope
type and value and a edit section to modify a seleted scope entry or to
enter e new scope. The scope types Geographic ares, Reference,
Specimen, Observation and Taxon name allow input of a
free-form text or reference to the corresponding DiversityWorkbench
module or a web service. The connection to to a module or web service is
done using the button  . After
selecting the entry in the referenced database the text will be taken
over and the backround colour of the scope value field changes to yellow. A further editing of the text will not be
possible (see below).
. After
selecting the entry in the referenced database the text will be taken
over and the backround colour of the scope value field changes to yellow. A further editing of the text will not be
possible (see below).

Additionally the edit section now shows the buttons
 to view the database link and
to remove the database link. In the latter case
editing of the scope value will be possible again.
to view the database link and
to remove the database link. In the latter case
editing of the scope value will be possible again.
If a scope entry has been selected in the scope table, it can be
modified in the edit section. If you want to enter a new scope value
instead, press the button at the end of the edit
line. The scope entry in the scope table will be deselected and a
selection box for the scope type appears in the edit section (see
below).
You may insert mutiple scope values with links to a DiversityWorkbench
module or a webservice. Therfore enter a new scope value with scope type
Geographic ares, Reference, Specimen, Observation and
Taxon name (or select one, which is not yet linked). Besides the
scope type dropdown box the button  is shown,
which allows insert of multiple scopes (see image below).
is shown,
which allows insert of multiple scopes (see image below).
You may insert mutiple scope values with links to a DiversityWorkbench
module or a webservice. Therfore enter a new scope value with scope type
Geographic ares, Reference, Specimen, Observation and
Taxon name (or select one, which is not yet linked). Besides the
scope type dropdown box the button is shown,
which allows insert of multiple scopes (see image below).
In the remote query panel you find the section Unit list, where you
may add the currently selected query result by clicking the
 button. When you select an entry in the Unit
list, you may remove it by clicking
button. When you select an entry in the Unit
list, you may remove it by clicking  or view the data in a separate window by clicking
  . When you have collected all query results click the OK button and the scopes
are inserted for the description (see below).
. When you have collected all query results click the OK button and the scopes
are inserted for the description (see below).
Project scopes
Besides the already mentioned scope types that allow input of a free
text or reference to a database entry, the scope types Sex,
Stage, Part and Other scope provide pre-defined scope
values. The values can be administrated as described in the Editing theProject chapter. For each project a different
set of values can be selected as “recommended” values. If for the
current description project scope values are defined/assigned, they are
shown in the right part of the description scopes as Project scopes
(see below).
Selecting or deleting of a scope entry can be easily done by selecting
clickin on the check box before the scope value. You may select rsp.
deselect all scope values of a certain scope type (Sex, State, Part or
Other scope) by clicking the check box of the category. If for a scope
value a detailled description text has been stored, you may view it as
bubble help by moving the mous cursor over the values.
If for a description a scope value is selected, that is not assigned to
its project, the value ist show with yellow
background (see below). Such a situation can occur, if the scope value
has been removed for the project or if a description has been moved to a
different project.
Project
The section Project allows the selection of the project the
description is assigned to. This adjustment has influence of the
available values of scope types Sex, Stage and Other scope, the
available descriptors and recommended modifier/frequency values and
statistical measures of the description. Therefore this unambiguous
adjustment might be seen as the “terminology project” of the description
item. The access rights for a certain user to the projects are
controlled with the login settings (see chapter Loginadministration). When you click on a project
name, you may view some additional project data (see image below
middle).
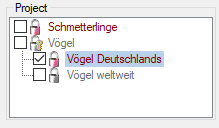
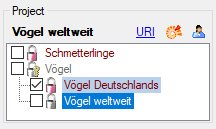
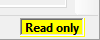
If access to a certain project is restricted to “read only”, it is
displayed with grey colour and symbol
 in the Project section (see pictures
above). A “read only” project cannot be selected for the actual
description. If the selected description has already been assigned to a
“read only” project by another user with appropriate rights, this is
indicated at the right bottom corner of the application window (see
above below right).
in the Project section (see pictures
above). A “read only” project cannot be selected for the actual
description. If the selected description has already been assigned to a
“read only” project by another user with appropriate rights, this is
indicated at the right bottom corner of the application window (see
above below right).
Additional projects
In section Additional projects you may make the description
accessible for additional projects. To assign a description to a project
click on the button. To remove it from a project,
select the project from the list and click on the
button. Additional projects without write access are shown in the upper
part of the window, projects with full access in the lower (or only)
part (see image below). If you do not have any access to a project, it
is shown as red text. Be aware that by
entering additional projects you may grant editing rights for single
descriptions to users that have no write access to the current project!
Be aware that by entering additional projects you may grant editing
rights for dedicated descriptions to users that have no write access to
the current project! If you have write access to the terminologyproject of a description item and granted access to another
project, where you have read-only access, you nevertheless may withdraw
these rights by removing it from the Additional projects.
Continue with:
Subsections of Edit Description
Edit Description
Continuous view
The continuous view tab provides an alternate view on the descriptive
data. In the Summary data only the descriptors are included where
data have been entered. At the right side there is a tool strip. The
displayed buttons will change depending on the selected entry. The
descriptor types  categorical,
  quantitive,
  text and
  sequence are indicated by different colours
and icons as shown in the example at the bottom. By pressing the
sequence are indicated by different colours
and icons as shown in the example at the bottom. By pressing the
 button on the tool strip this example may be
hidden. Descriptors that are marked as mandatory are displayed with
light red text, descriptors that are
inapplicable are greyed out.
Additionally coloured background indicated possible problems, e.g. if an
inapplicability
rule has been ignored or a not allowed descriptor has been used. A
tool tip text shows the error or warning reason when the mouse curser is
moved over the element.
button on the tool strip this example may be
hidden. Descriptors that are marked as mandatory are displayed with
light red text, descriptors that are
inapplicable are greyed out.
Additionally coloured background indicated possible problems, e.g. if an
inapplicability
rule has been ignored or a not allowed descriptor has been used. A
tool tip text shows the error or warning reason when the mouse curser is
moved over the element.
By pressing the  button the tree view may be
expanded to display the contained categorical states, quantitative
measures or texts. By pressing the
button the tree view may be
expanded to display the contained categorical states, quantitative
measures or texts. By pressing the  button the
tree will be collapsed to descriptor level.
button the
tree will be collapsed to descriptor level.
To insert a descriptor press  , to delete a
descriptor select the entry and press . If only a
single value shall be removed, select the entry and use the
button. All these functions can alternatively be
accessed by the context menu by a right-click on the tree node.
, to delete a
descriptor select the entry and press . If only a
single value shall be removed, select the entry and use the
button. All these functions can alternatively be
accessed by the context menu by a right-click on the tree node.
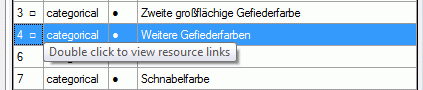
If for a descriptor resources, e.g. pictures, are avaialble, this is
indicated by the background color of the descriptor icon. Categorical
states with resources are marked with icon  (see
first entries in picture above). The resources may be accessed by a
right-click on the tree node and selecting context menu item
(see
first entries in picture above). The resources may be accessed by a
right-click on the tree node and selecting context menu item
 View resources (see picture above).
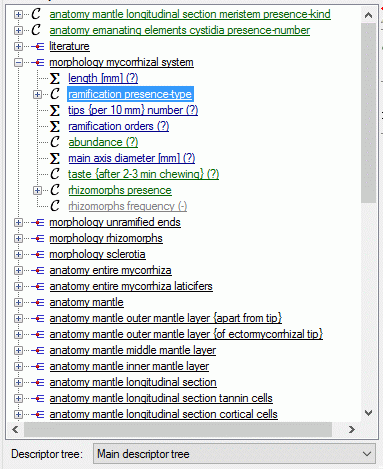
Structured descriptor view
If for the project a structured descriptor tree is defined, i.e. a
descriptor tree that contains at least one descriptor tree node, the
Descriptor tree: drop-down list is shown below the descriptor tree
(see image below left). If a descriptor tree is selected, the descriptor
tree node hierarchy will be included in the output and the descriptors
will be arranged accordingly. The names of the descriptor tree nodes and
the descriptors will be reduced by parts contained in the supriour
hierarchy nodes (see image below right).
If for a descriptor tree node resources are available, this is indicated
by the grey background color of the
descriptor tree icon. The resources may be accessed by a right-click on
the tree node and selecting context menu item
View resources. Additional descriptor tree node information, e.g. an
optional abbreviation or details text can be viewed as bubble help by
placing the mouse cursor over the item.
Editing summary data
A click on  opens an edit window at the right part
of the tab. This window provides the same functions as available in the
descriptor view tab. The picture below shows the resource linked to a
categorical state that can be opened by doule-clicking the state ID in
the Categorical states section.
opens an edit window at the right part
of the tab. This window provides the same functions as available in the
descriptor view tab. The picture below shows the resource linked to a
categorical state that can be opened by doule-clicking the state ID in
the Categorical states section.
Continue with:
Edit Description
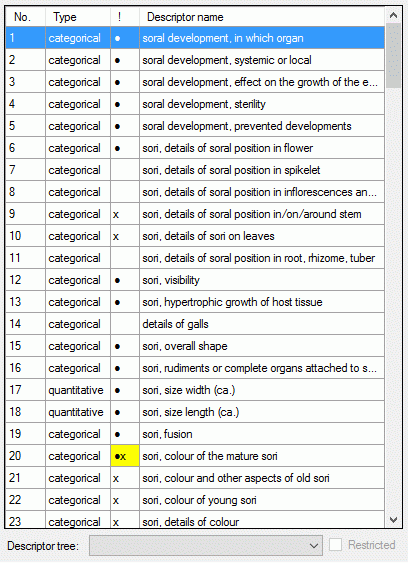
Descriptor view
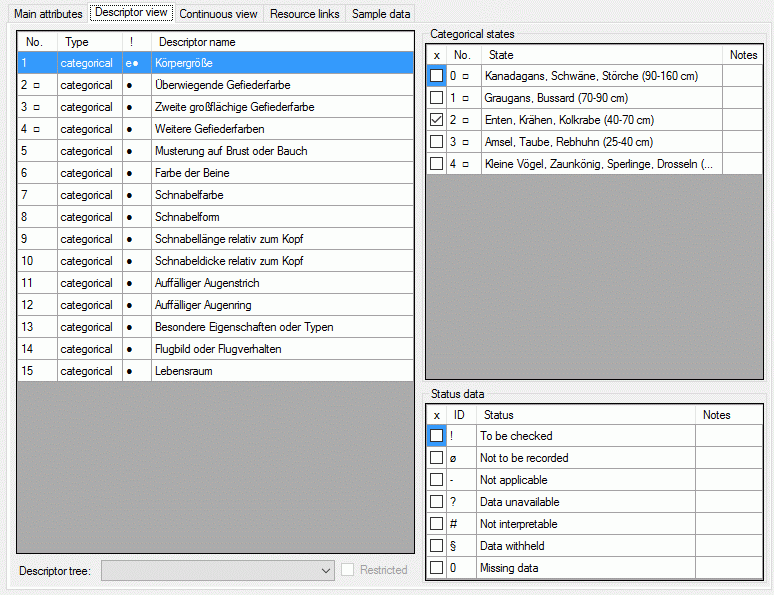
The left part of the descriptor view tab shows all descriptors available
for the description’s project. The entries in column “!” indicate some
additional information about the descriptor:
- Descriptor is referenced in the summary data (●)
- Descriptor is referenced in the status data (○)
- Descriptor is mandatory, values must be specified (!)
- Descriptor is inapplicable because of other specified
descriptors/categorical states (x)
- Descriptor is exclusive, only one categorical states shall be selected
(e)
If resources are linked to a descriptor, the entry is marked by a square
(□) behind its sequency number and a tool tip appears when the mouse
cursor is moved over the “No.” column (see below). By double-clicking
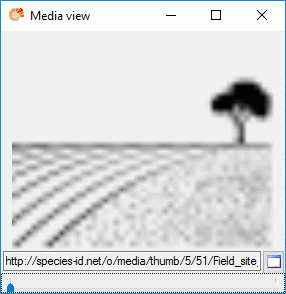
the sequence number a “Media view” window can be opened to view the
resources.
If for the project descriptor trees are defined, the Descriptor
tree: drop-down list and Restricted check box are shown below the
descriptor list (see image below left). If a descriptor tree is
selected, the names of the descriptor tree node hierarchy is included in
the descriptor names (see image below right). This feature is useful, if
several descriptors with ambigious names exist the can now be
distinguished. E.g. two descriptors “colour”, one at descriptor tree
node “Leaf”, the other at descriptor tree node “Blossom” will become
“Leaf colour” and “Blossom colour”. If the descriptor name already
includes the hierarchy, the duplicate parts will be filtered. In the
mentioned example the descriptor names “Leaf colour” and “Blossom
colour” will not be changed, if the descriptor tree is selected.
If additionally the Restricted option is set, only the descriptors
included in the selected descriptor tree are displayed (see image below
right, missing descriptor number 14). So you have the option to create
several descriptor trees that include only special aspects of the
description’s property (e.g. morphology, molecular biology and so on) to
get a clearly arranged descriptor list.

Editing summary data
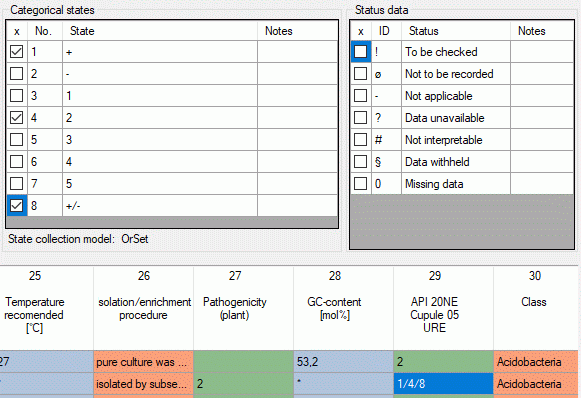
The right part of the descriptor view tab shows at the bottom the
Status data values of the selected descriptor. It is possible to
select several values for each descriptor. In the “Notes” column
additional information concerning the selected data status may be
entered. By a double click on the “Notes” entry a separate edit window
can be opened.
Depending on the descriptor type you can find at the top either
Categorical states (see large picture above), Statistical
measures, Descriptive text or Molecular sequence (see pictures
below). In the “Notes” columns additional information concerning the
specific categorical state rsp. statistical measure may be entered. By a
double click on the “Notes” entry a separate edit window can be opened.
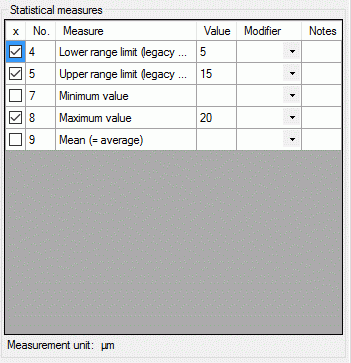
To enter a statistical measure value click in the “Value” field and
enter the value, the check mark in field “x” will be set automatically.
If recommended modifier values are defined (see “Editing the
Descriptor” and “Editing the
Project”), a value may be selected from the drop down
list “Modifier”. If no modifier values are available, the appropriate
table column may be hidden. In the “Notes” field an additional text may
be added. By double-clicking the “Notes” field the Extended texteditor can be opened.
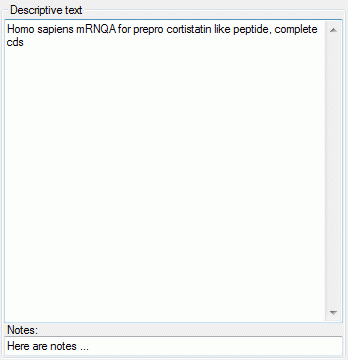
The descriptive text may be edited diretly in the window, which
shows the pure text without any formatting. In the notes field an
additional text may be entered. By double-clicking the text fields the
Extended text editor can be opened.
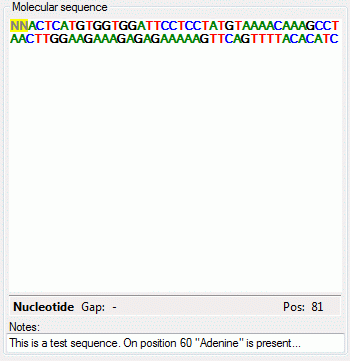
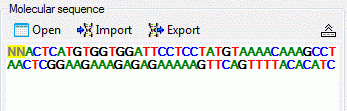
The molecular sequence window displays in the status line below the
edit area the sequence type (“Nucleotide” or “Protein”), the symbol
length (“Len:”) in case of proteine sequences, the gap symbol (“Gap:”)
if defined, the long text of the actual element and the position
(“Pos:”) (see image below). In case of three-letter proteine symbols the
position is the number of the amino acid symbol, not the character
position. By pressing the TAB key the cursor jumps to the next
symbol.

When characters are entered in the edit area that are recognized as
valid symbols, they will automatically
be formatted. One-letter symbols are converted to upper case characters,
three-letter symbols are converted according the “Xxx” schema, e.g.
“Ala” for “Alanine”. The sybols for the nucleotide bases "Adenine", "Cytosine", “Guanine”, "Thymine" and "Uracil" are dispayed with different colors.
Ambiguity symbols and gap symbols are shown in grey color. If the ambiguity symbols have not
been enabled in the descriptor data, they will be displayed with yellow background. Symbols that have not been
recognized are displayed with red
background.
The molecular sequence window offers some additional functions available
in the . It may be
opened by moving the mouse cursor over the control header (“Molecular
sequence”, see window below left) or from the context menu (right-click
on the sequence edit area, see windows below right). With menu item
 Import you may read
the seqeunce data from a file and insert them to the description. With
menu item
Import you may read
the seqeunce data from a file and insert them to the description. With
menu item  Export
you may export the actual sequence data to a file.
Export
you may export the actual sequence data to a file.
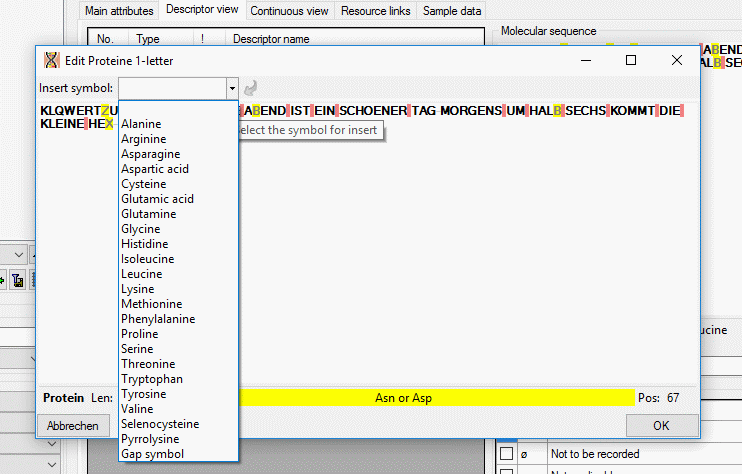
By double-clicking the molecular sequence area or from sequence menu
 Open → Sequence a
separate edit window may be opened (see image below). On the top of the
window there is the drop-down menu Insert symbol: where a value may
be selected from a list. After selecting the value press the [ENTER]
key or click on to insert the selected symbol at
the cursor position.
Open → Sequence a
separate edit window may be opened (see image below). On the top of the
window there is the drop-down menu Insert symbol: where a value may
be selected from a list. After selecting the value press the [ENTER]
key or click on to insert the selected symbol at
the cursor position.
To select a categorical state set a check mark in field “x” with a
mouse click. If recommended modifier or frequency values are defined
(see Editing the Descriptor and Editing the
Project), values may be selected from the drop down
lists “Modifier” rsp. “Frequency”. If no modifier or frequency values
are available, the appropriate table column may be hidden. In the
“Notes” field an additional text may be added. By double-clicking the
“Notes” field the Extended text editor can be
opened.
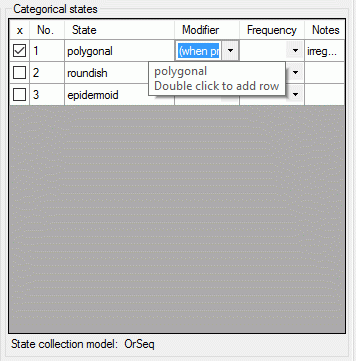
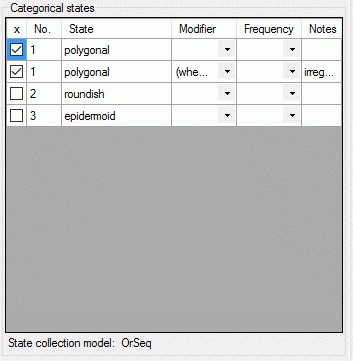
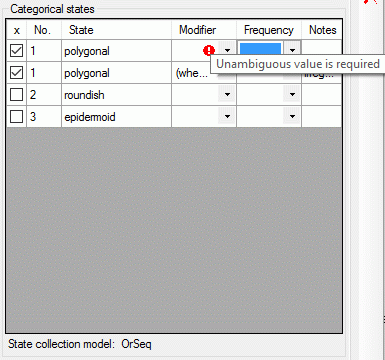
If a “Modifier” or “Frequency” value is selected, the multiple
specification of a dedicated categorical state is possible. A tool tip
offers to add a row by doouble-click, if mouse cursor is moved over the
“State” field (left picture below, picture in the midddle after double
click). Multiple specifications of one categorical state are only
allowed if they have been assigned different modifier and frequency
values. Inputs offending these restrictions will be ignored an a cell
error will indicate the problem (right picture below).
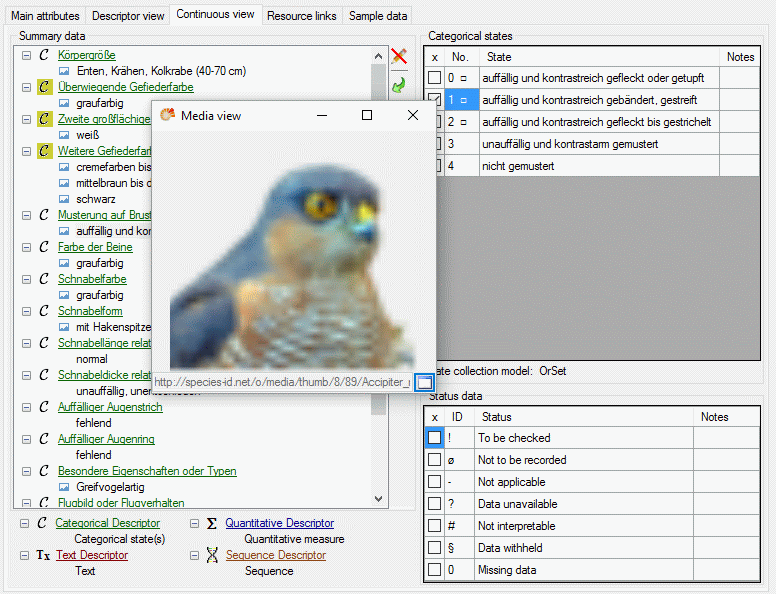
If resources are linked to a categorical state a tool tip appears when
the mouse cursor is moved over the ID (left picture below). By
double-clicking the ID a “Media view” window can be opened to view the
resources (right picture below).
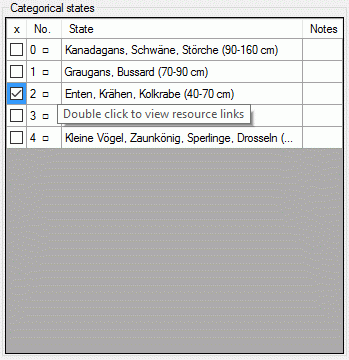
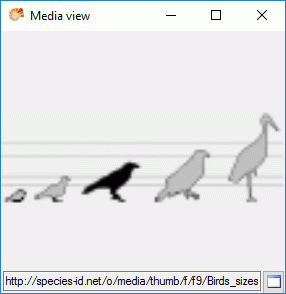
If more than one resources have been assigned to one entry, a slider
will be visible at the bottom of the “Media view” window. To switch
through the available resources the slider can be moved using the mouse
or the right and left arrow keys (see below).
Continue with:
Edit Description
Export sequence
With this form you can export data from the database to a file. Choose
Export from the sequence
menu to open the window
for the export. Format specifies the file format, currently
FASTA and FASTQ are supported.
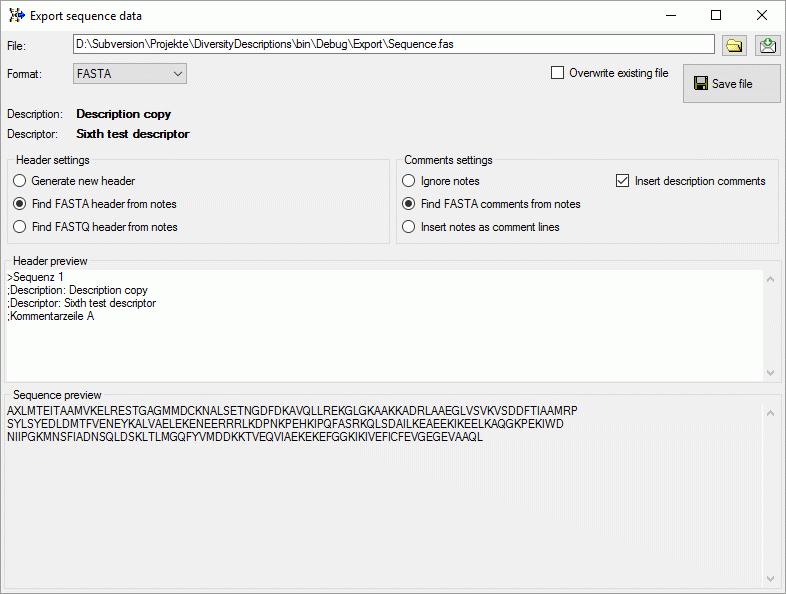
In the Header settings you may specify if a new header shall be
generated or if the notes shall be searched for a FASTA rsp. FASTQ
header. In case of FASTA export you may specify in the Comments
settings section if FASTA comment lines from the notes (starting with
“;”) shall be inserted after the header, the whole notes shall be
inserted as FASTA comments or if the notes shall be ignored. If Insert
description comments is checked, two comment linsed wit the
description and descriptor title will be generated.
In the Header preview section you may check and edit the resulting
header, in the Sequence preview section the converted sequence in
one-letter notation is displayed.
In case of FASTQ export the Comments settings are irrelevant. If the
notes include a QUALITY STRING sections, it is inserted in the FASTQ
output (see image below). If no quality string can be found or the
Find FASTQ quality from notes has been unchecked, the lowest
quaality value “!” is inserted.
Click on the  button to
select the file where the data shall be exported. By default the data
are appended at the end of the selected file, check the Overwrite
existing file option to overwrite it. Finally click the
Save file button to write the data.
button to
select the file where the data shall be exported. By default the data
are appended at the end of the selected file, check the Overwrite
existing file option to overwrite it. Finally click the
Save file button to write the data.
Continue with:
Edit Description
HTML
With this form you can easily edit the description data in an HTML form.
After starting a description query and selecting an entry choose Edit
-> Edit as HTML form … from the
menu or click on the button at the
right side of the main Diversity Descriptions window. A window as shown
below will be opened.
When you move the mouse cursor over embedded
pictures, they are slightly magnified, by clicking on the resource, you
may show it in full size (see below). Use
button  Home to return to the HTML form.
With drop down button  Options you may
insert some additional input fields in the form, e.g. item details or
notes. With drop down button
Options you may
insert some additional input fields in the form, e.g. item details or
notes. With drop down button  Scope you may
insert input fields for the vasiour scope types and drop down button
Scope you may
insert input fields for the vasiour scope types and drop down button
 Color lets you select the background color.
All that changes come into affect, when you reopen the form or redraw
the HTML form using the
Color lets you select the background color.
All that changes come into affect, when you reopen the form or redraw
the HTML form using the  Reload button.
After clicking the Reload button you will be
asked if you want to discard all changes. By selecting No the HTML
form data will be written into the local data store, otherwise all
inputs will be reset. To exit the form and save all changes in the local
data store, click the OK button. To ignore your changes, click the
Cancel button and you will be asked if you want to discard all
changes. The HTML form utility works completely on the local data store.
I.e. if you edited the description data in the main form of Diversity
Descriptions and start the HTLM form editor without saving the data, all
changes are only present in the application dataset. To store the data
in the database, click the save button of the main
form!
Edit Description
Molecular sequence
The editor for sequence data recognizes predefined symbols for
nucleotide and protein sequences according the
IUPAC definitions.
Nucleic acid symbols
|
|
| Symbol |
Name |
| A |
Adenine |
| C |
Cytosine |
| G |
Guanine |
| T |
Thymine |
| U |
Uracile |
| W |
Weak (A or T) |
| S |
Strong (G or C) |
| M |
aMino (A or C) |
| K |
Keto (G or T) |
| R |
puRine (G or A) |
| Y |
pYrimidine (C or T) |
| B |
not A (B comes after A) |
| D |
not C (D comes after C) |
| H |
not G (H comes after G) |
| V |
not T (V comes after T and U) |
| N |
No idea (not a gap) |
The symbols with grey background are
ambiguity symbols. The difference between “N” and a gap symbol (usually
“-”, but any other symbol may be defined in the descriptor) is that a
gap symbol represents an unspecified number of unknown symbols but “N”
stands for exatly one nucleic acid.
Amino acid symbols
|
|
|
| Name |
1-letter sybmol |
3-letter sybmol |
| Alanine |
A |
Ala |
| Arginine |
R |
Arg |
| Asparagine |
N |
Asn |
| Aspartic acid |
S |
Asp |
| Cysteine |
C |
Cys |
| Glutamic acid |
E |
Glu |
| Glutamine |
Q |
Gln |
| Glycine |
G |
Gly |
| Histidine |
H |
His |
| Isoleucine |
I |
Ile |
| Leucine |
L |
Leu |
| Lysine |
K |
Lys |
| Methionine |
M |
Met |
| Phenylalanine |
F |
Phe |
| Proline |
P |
Pro |
| Serine |
S |
Ser |
| Threonine |
T |
Thr |
| Tryptophan |
W |
Trp |
| Tyrosine |
Y |
Tyr |
| Valine |
V |
Val |
| Selenocysteine |
U |
Sec |
| Pyrrolysine |
O |
Pyl |
| Asparagine or aspartic acid |
B |
Asx |
| Glutamine or glutamic acid |
Z |
Glx |
| Leucine or Isoleucine |
J |
Xle |
| Unspecified or unknown amino acid |
X |
Xaa |
The symbols with grey background are
ambiguity symbols. The difference between “X” rsp. “Xaa” and a gap
symbol (e.g. “—”, but any other symbol may be defined in the
descriptor) is that a gap symbol represents an unspecified number of
unknown symbols but “X” rsp. “Xaa” stand for exatly one amino acid. The
amino acids “Selenocysteine” and Pyrrolysine" are non-standard amino
acids that only occur in certain species.
Continue with:
Edit Description
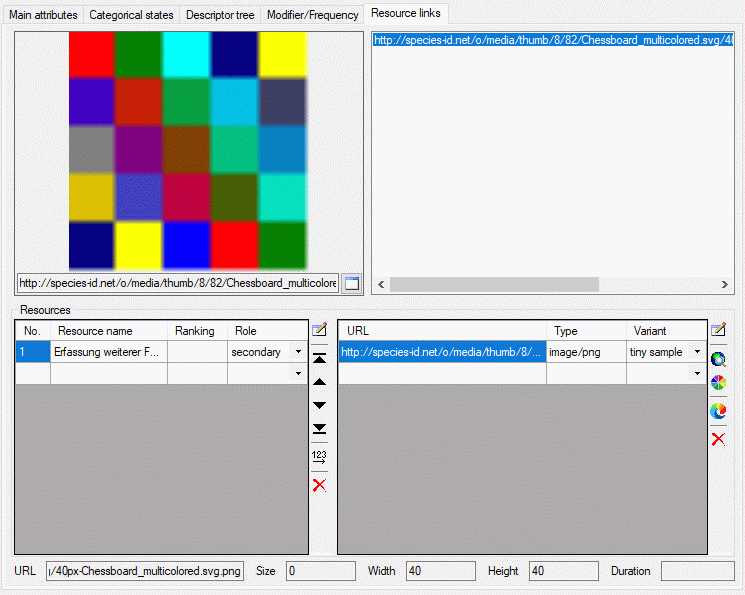
Resource links
The resouce links tab allows assigment and inspection of resource links
for the description. In the lower Resources part of the tab there
are two tables. Ar the left the “Resource” table specifies the single
resources, at the right the “Resource variant” table contains the
associated URLs to images, video or sound resources.
To enter a new resource select the empty line at the end of the
“Resource” table and click on the “Resource name” field. After entering
the “Resource name” (leave the cell by pressing the TAB key)
automatically a new value for the sequence number (“No.”) is
initialized. The sequence number determines the display order in tables
and may be changed manually. You may order the resource entries by
clicking on the column header or by using the arrow buttons in the left
tool strip ( and
and  for up and down,
 and
and  to shift the
selected entry to top or bottom). After ordering the resources click
button
to shift the
selected entry to top or bottom). After ordering the resources click
button  to renumber the entries starting with “1”
and make the changes effective. In field “Ranking” you may enter a
numeric value in range 0 … 10 expressing the suitability of the
resource. In field “Role” you may select one of the offered values.
to renumber the entries starting with “1”
and make the changes effective. In field “Ranking” you may enter a
numeric value in range 0 … 10 expressing the suitability of the
resource. In field “Role” you may select one of the offered values.
If you want to delete a resource, you have three choices:
- Select the resource and press the delete button in
the left tool strip.
- Select the resource and press the Delete key on the keyboard.
- Enter the sequence number column (“No.”) and remove the value. After
leaving the cell the entry will be deleted.
In any case you will be asked if you want to delete the data row, if
resource links are present.
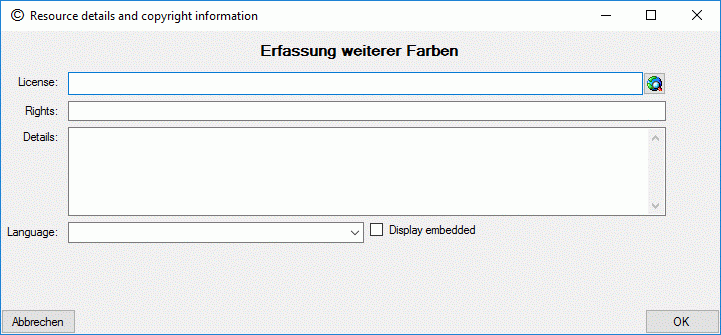
To view or edit the additional resource data and copyright information
press on the button  besides the resource
table. In field License: and a link to the license text in the web
may be entered, in field Rights: you may enter a copyright text. By
pressing the
besides the resource
table. In field License: and a link to the license text in the web
may be entered, in field Rights: you may enter a copyright text. By
pressing the  button a browser window can be
opened to navigate to the license page in the web. Furthermore you may
enter a detailled text (field Details:), the resource language
(field Language:) and set the Display embedded flag (see picture
below). If any additional resource data have been entered, this will be
indicated by a square (□) behind the resource name’s sequence number
(see picture above).
button a browser window can be
opened to navigate to the license page in the web. Furthermore you may
enter a detailled text (field Details:), the resource language
(field Language:) and set the Display embedded flag (see picture
below). If any additional resource data have been entered, this will be
indicated by a square (□) behind the resource name’s sequence number
(see picture above).
To enter a resource link, first select the entry in the “Resource”
table, then select the empty line at the end of the “Resource variant
table”. By clicking on the “URL” field a web address may be entered. By
double-clicking the “URL” field a browser window opens to navigate to
the resource. For each resource several URLs to resource variants with
different quality levels, e.g. different resolution, may be inserted.
For each entry in the URL table a different value of “Variant” must be
selected.
As an alternative to a resource URL a colour may be spcified in the
format “color://#rrggbb” where “rrggbb” specifies a hexadecimal colour
code. The colour can simply be seleced by clicking the button
besides the resource variant table.
To remove a resource variant, select the entry and press the
button in the right tool strip or the Delete key on the keyboard. Alternatively you
may delete the “URL” entry in the resource variant table.
The button  besides the resource variant table
allows you to view a resource URL in the system browser.
besides the resource variant table
allows you to view a resource URL in the system browser.
The upper part of the resource links tab consists of a preview window on
the left side and the complete list of resource links. By selecting one
of the links the preview is shown on the preview window. If you press
button  in the preview window, the resource is
opened in a separate viewer window.
in the preview window, the resource is
opened in a separate viewer window.
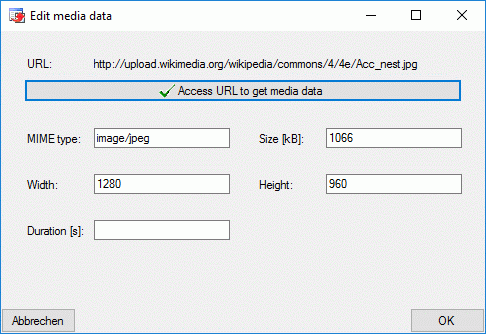
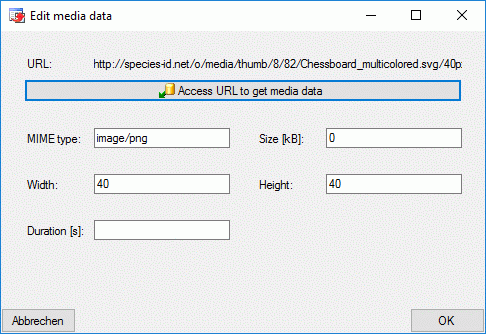
At the bottom of the resource links tab the media data of a selected URL
are displayed. These data can be edited by double-clicking the “Type”
entry in the resource variant table, by clicking at one of the media
data value fields or the button. The edit
dialog provides the possibility to access the URL to get available data.
Additionally the values may be edited manually.
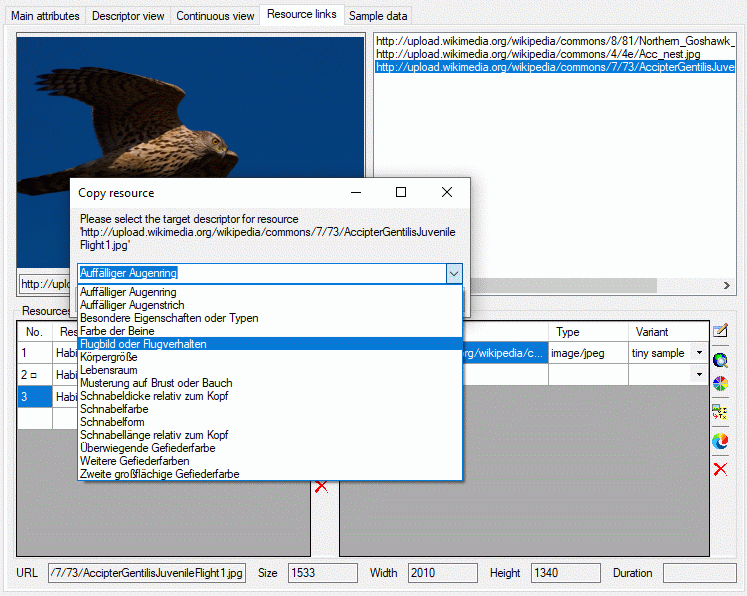
Copy description resources to a descriptor
If you have write access to descriptors of the currently selected
description’s project, you may copy a selected resource URL to a
descriptor. After clicking the  button a window
will open to select one of the accessible descriptors (see image
below). Remark: To see the copied resources in the Descriptorview or the Continuous
view, you will have to reconnect to
the database.
button a window
will open to select one of the accessible descriptors (see image
below). Remark: To see the copied resources in the Descriptorview or the Continuous
view, you will have to reconnect to
the database.
Continue with::
Edit Description
Sample data
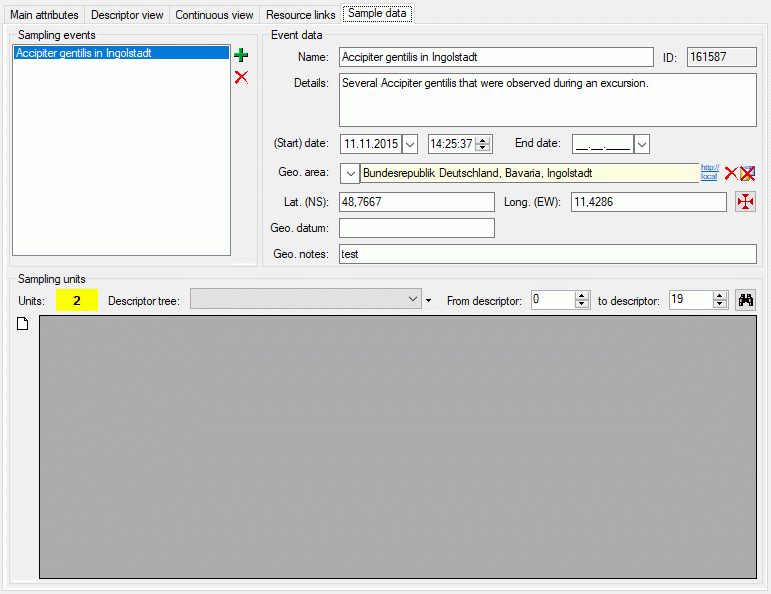
The sample data tab allows assigment and inspection of sampling events
and associated sampling units for the description. In the upper left
Sampling events part of the tab there is a list of the sampling
events stored for the description. By selecting a sampling event entry
the Event data are shown in the upper right part of the tab. Here
you may edit the event name, a detailled description, the date and time
rsp. a date and time span and geographic data. To insert a new sampling
event click on the add button in the Sampling events
section, to delete the selected sampling event and all stored sampling
unit data press the button (see image above).
The geographic area may be linked to an entry of a DiversityGazetteers
database (see section Module related entry).
If latitiude and longituede have not yet been entered, the coordinates
of the selected DiversityGazetteers entry will be inserted. By pressing
the  button a window to select the
coordinates by Google maps will be opened. Field Geo. datum allows
entering short text concerning the geodetic datum. If coordinates are
entered using Google maps a remark that WGS84 coordinates are used will
be inserted.
button a window to select the
coordinates by Google maps will be opened. Field Geo. datum allows
entering short text concerning the geodetic datum. If coordinates are
entered using Google maps a remark that WGS84 coordinates are used will
be inserted.
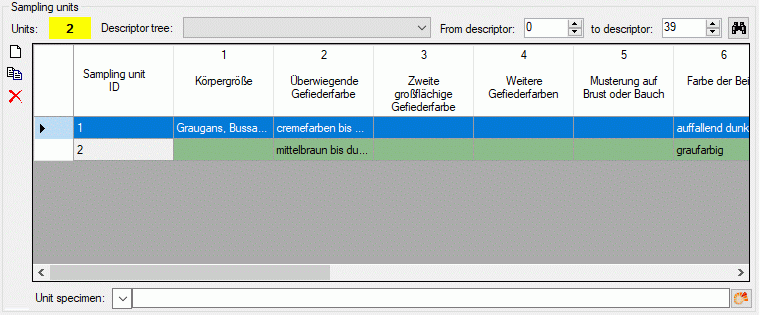
Editing sampling unit data
For each sampling events one or several Sampling units may be
entered. A sampling unit represents a tuple of values that belong
together, e.g. because they represent a single specimen. For each
descriptor, which is represented by the table column, a value may be
entered in a sampling unit, which builds a single table line. The
background colour of each table column indicates the type of sample
data: categorical,
quantitative, text or sequence . If the number of sampling units is
displayed in field Units of the Sampling units section in the
lower part of the tab. If sampling units are present, the number is
displayed with yellow background (see
image below).
To view the unit data, select a Descriptor tree and choose the
descriptor sequence range (From descriptor … to descriptor) to
restrict the number of columns displayed in the unit table. Finally
press button  and the sampling untis will be
displayed (see image below). If you prefer to display the present
sampling units automatically whenever you select a sampling event, click
on the number behind Units. The background changes from yellow to red to indicate this mode. When you
select a cell and resources are available for the selected descriptor
column, the button will be shown. You may click it
to view the descriptor resources.
and the sampling untis will be
displayed (see image below). If you prefer to display the present
sampling units automatically whenever you select a sampling event, click
on the number behind Units. The background changes from yellow to red to indicate this mode. When you
select a cell and resources are available for the selected descriptor
column, the button will be shown. You may click it
to view the descriptor resources.
To insert a new sampling unit press button . By
clicking on the free space at the beginning of a table line you mark the
whole sampling unit (see picture below). Now you have the additional
options to delete the unit by pressing button or
to copy the data to a new sampling unit by pressing the
button. Keep in mind that all unit data will be
copied, even if you do not see all descriptor columns due to the display
restrictions.
When you select the Sampling unit ID cell you may enter a collection
specimen in the Unit specimen control below the units table. By
clicking the DWB button (see section
Module related entry) you can link it to an
entry in a DiversityCollection database. If the sampling unit is linked
to a database entry in DiversityCollection, the text of the Unit
specimen: control is shown with light
yellow background. You may view the linked data by clicking the
button or double clicking the
Sampling unit ID cell.
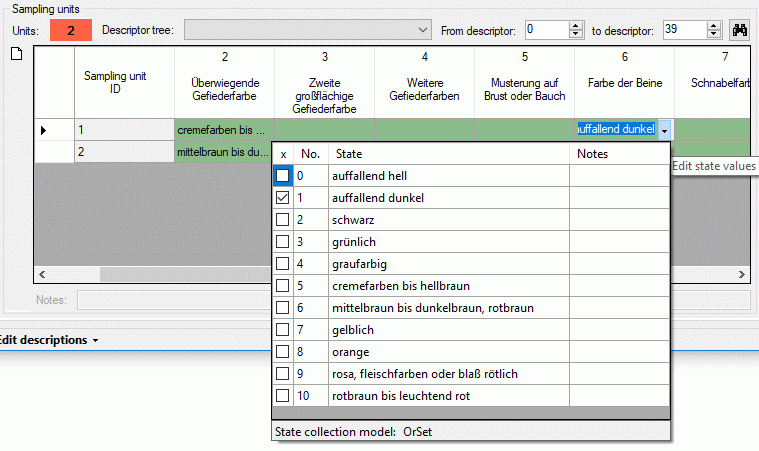
To modify categorical sampling data enter the table cell and press the
 button within the cell. A control will be
opened where you can select the categorical states and enter notes or
modifier values (if defined) for each single state (see image below).
button within the cell. A control will be
opened where you can select the categorical states and enter notes or
modifier values (if defined) for each single state (see image below).
For all other sampling data the value can be entered directly in the
table cell. Notes for the selected table cell are entered in the
Notes: text box directly below the units table. For categorical,
text and molecular sequence sample data a separate edit window can be
opened by double-clicking the table cell. For molecular sequence data
the tool strip buttons (import) and
(export) allow import and export from rsp. to
dedicated file formats as described in sections Import sequencedata and Export sequence
data.
Continue with:
Edit Description
Grid view
After starting a database query for descriptions select
 Grid →
  Description
grid view … from the menu. The query result list is passed to the
description grid view form and a window as shown below opens (click the
button
Description
grid view … from the menu. The query result list is passed to the
description grid view form and a window as shown below opens (click the
button  Display description table to build the
table output). In the first line the database name is displayed. If you
move the mouse cursor over the database name, a tooltip shows the actual
connection paramter.
Display description table to build the
table output). In the first line the database name is displayed. If you
move the mouse cursor over the database name, a tooltip shows the actual
connection paramter.
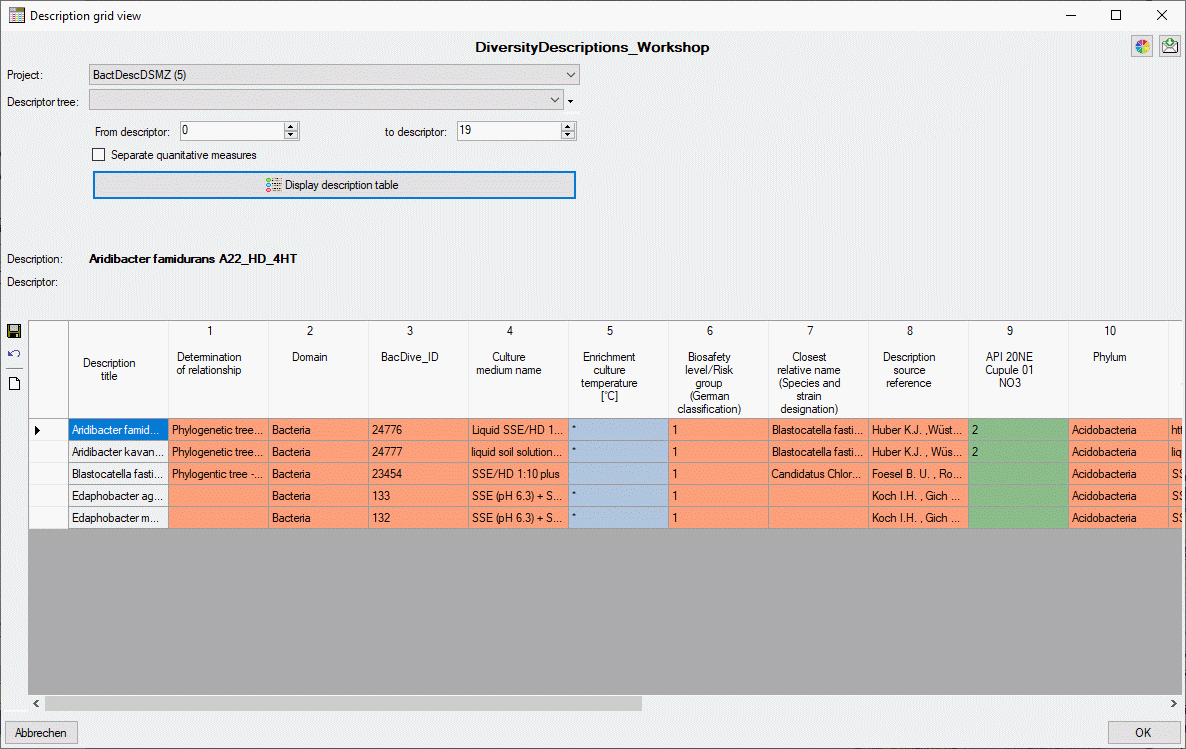
The table in the lower part of the window shows the description titles
in the first column and the summary data in the other columns. Each
summary column holds the data of a certain descriptor. If a cell with
summary data is selected, the summary details and the descriptor status
data are displayed in the upper right part of the window. The upper left
part of the window shows the selection parameters that are used for
building the description table. You may change the table colors by
clicking the button . A form as shown below will be
opened.
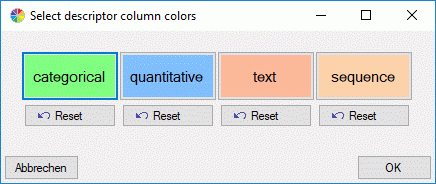
Click on buttons categorical, quanitative, text or
sequence to select the corresponding table colors. By clicking the
Reset button below the color, the corresponding
default value will be selected. After changing the table colors by a
click on the OK button, you must re-draw the table.
Selection parameters
In the upper left part of the parameters for the description table can
be adjusted. If in the query list passed to the form descriptions of
different projects are present, the displayed project can be selected
with the Project: drop-down box. The entries in the drow-down list
include the project name, followed by the number of descriptions for
that project in brackets and an asterisk (*) if the user has only
read access for that project.
The Descriptor tree drop-down box restricts the descriptor columns
to the descriptors contained in the selected tree. Furthermore the tree
hierarchy is included in the descriptor names if a structured descriptor
tree is selected (see images below).
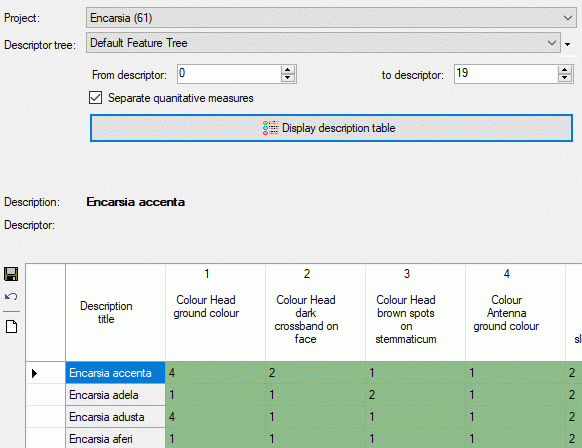
The values From descriptor and to descriptor limit the range of
descriptor sequence numbers that is included in the discription tabe. Be
aware that this restiction is additionally effective to a selected
desriptor tree! If you want to de-activate this restriction, select
“from” value 0 “to” value 999999 by a double-click on the labels From
descriptor rsp. to descriptor. The limitation of the number of
descriptor columns makes speeds up the description table generation,
especally if many descriptor (e.g. some hundrets) are present.
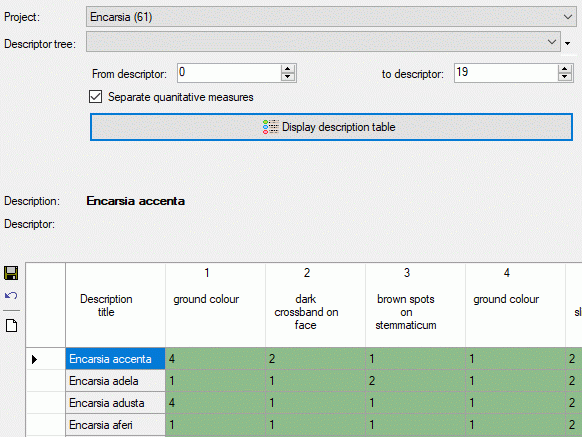
If you select option Separate statistical measures, separate columns
will be insterted in the data grid for each quantitative descriptor and
its recommended statistical measures. This option may be useful for
editing quantitative summary data that use other statistical measures
than Min, UMethLower, Mean, UMethUpper and Max (see
section Data editing for details.
Finally click the button Display description
table to build a new description table according to your settings.
During output of the description table the icon of the button changes to
 and you may abort processing by clicking the
button.
and you may abort processing by clicking the
button.
Continue with:
Subsections of Edit Description Grid
Edit Description Grid
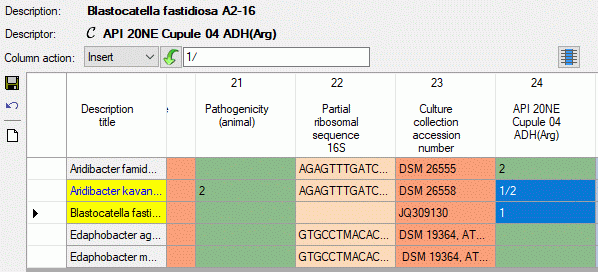
Copy or create descriptions
To copy one or more descriptions select the whole data rows by clicking
in the area left from the “Description title” column. In the tool strip
the copy button appears (see image below).
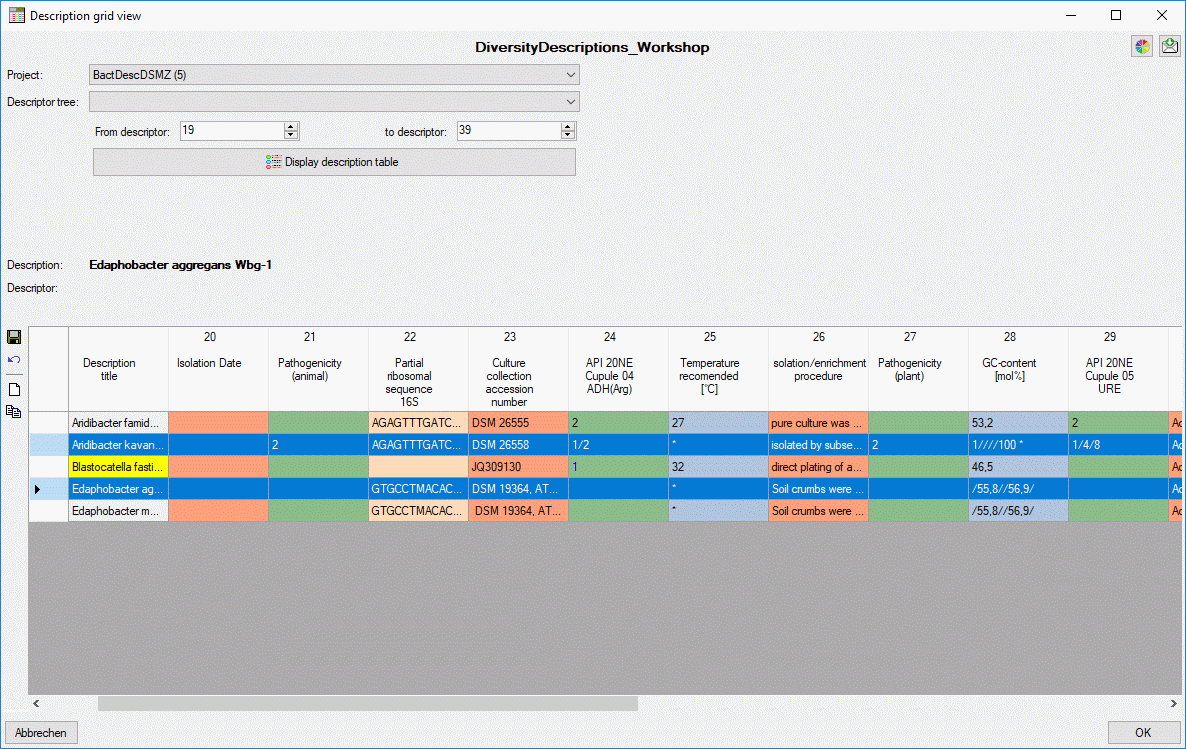
After clicking the button you may be asked if you
want to copy description resources, too. Be aware that the copy
operation is directly performed within the database. I.e. that local
changes that have been done in the sources desrcriptions will not be
included in the targets unless you save your data before copy (see image
below, second and last line in descriptors 28 and 29).
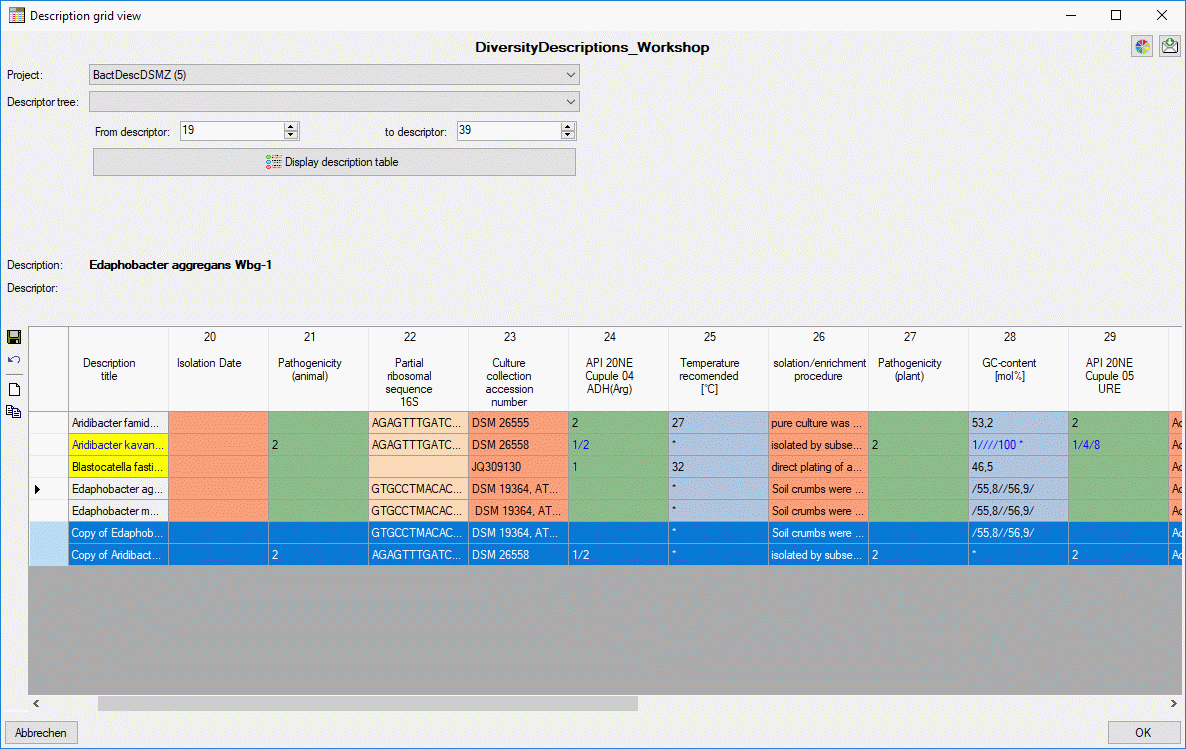
New description
To enter a new description, click on button and a
new row will be appended (see image below). Same as for copy the new
description is created directly within the database.
Continue with:
Edit Description Grid
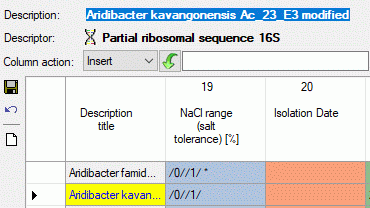
Data editing
The first column of the description table shows the description titles,
which are fixed. I.e. if you scroll the summary data to the right, the
titles are still visible at the left. The other columns show the summary
data, where the descriptor type is indicated by the background colour:
categorical, quantitative, text
or sequence. The column titles include the
descriptor name, the mesurement unit in square bracket for quantitative
descriptors and the descriptor’s sequence number (see image below).

When a summary cell in the description table is selected, the field
Description: shows the description title and field Descriptor:
shows the symbols according the descriptor type (
for categorical, for quantitative,
for text and for
sequence) and the descriptor title. If for a descriptor resources are
available, this fact is indicated by a coloured symbol background. You
may view them by a double-click on the descriptor title. If for a
description resources are available, the symbol
is displayed before the title. Double click in
that symbol to view the resources.
For the selected cell the summary data and the descriptor status data
are displayed in the upper right area of the window (see image above).
You may edit the data within these controls as described in
section Editing the description - Descriptor view
tab of this manual. For modified
summary cells the text colour changes to blue and the description titles will be shown
with yellow background in the table.
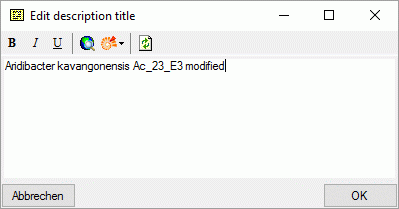
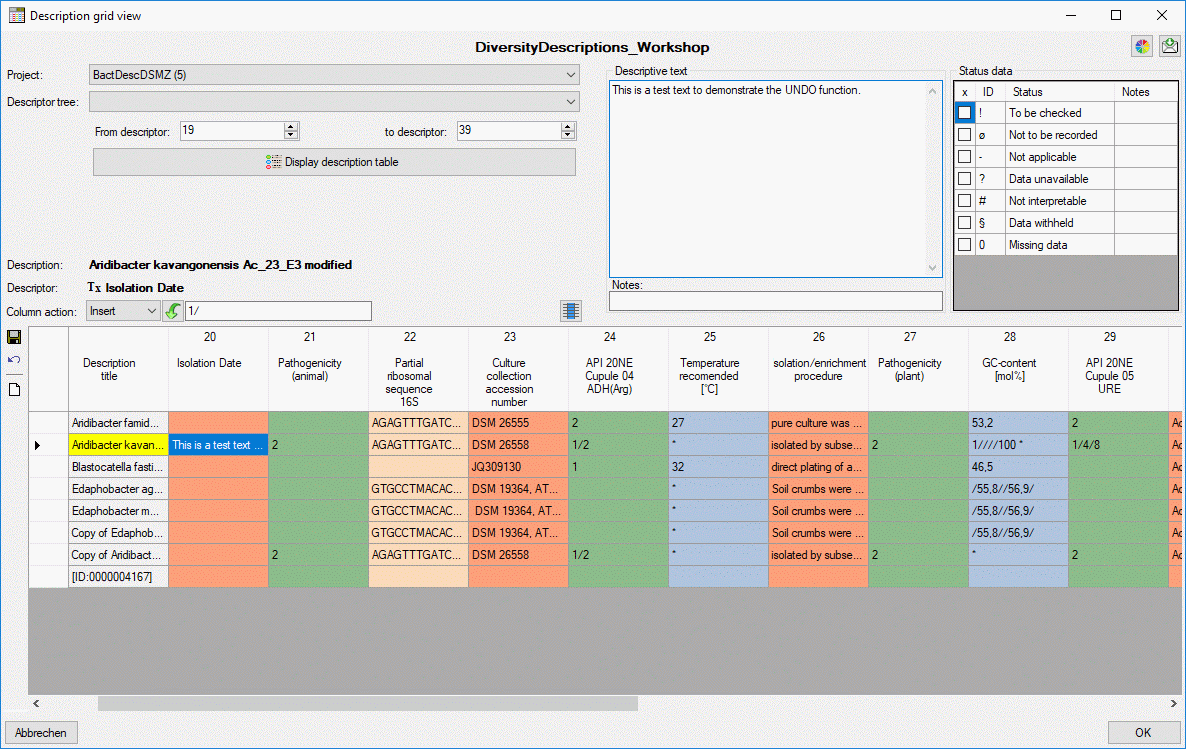
Changing the description title
To change the description title, double-click on it in field
Description: to open a separate edit window. After comitting the
changes with “OK” the description will be marked as modified (see images
below).
Changing the summary data in the table
Categorical summary data
Categorical, states are specified by their
sequence number. Multiples are separated by a forward slash ("/", see
image below). Existing “notes” will be removed, if the corresponding
categorical state is not specified in the input.
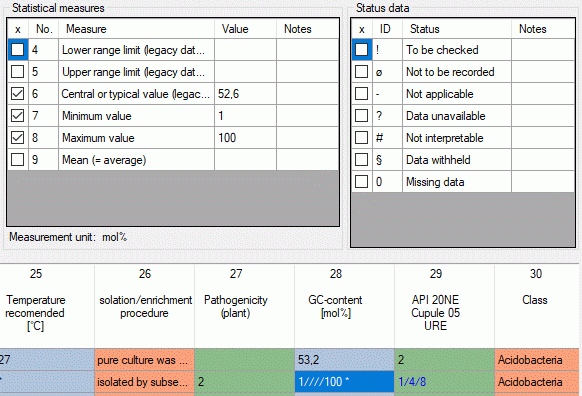
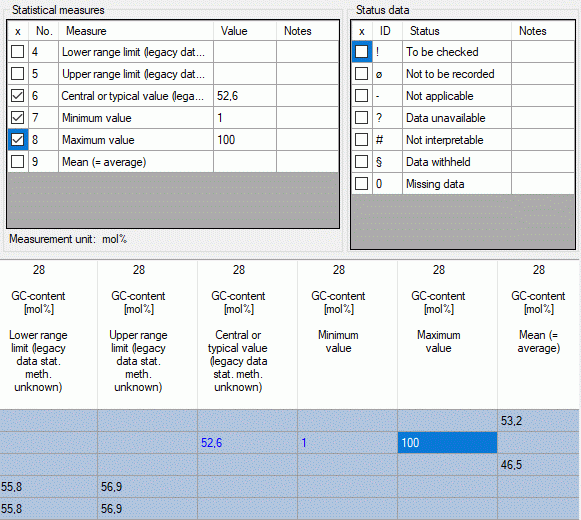
Quantitative summary data
If you did not check the option Separate quantitative measures, for
quantitative summary data only the five
quantitative measures
|
|
| Min |
Minimum value |
| UMethLower |
Lower range limit (legacy data stat. meth. unknown) |
| Mean |
Mean (= average) |
| UMethUpper |
Upper range limit (legacy data stat. meth. unknown) |
| Max |
Maximum value |
can be specified within the summary table. The values must be specified
in theis given order and separated by a forward slash ("/"). E.g. 1////100 means “Min=1, Max = 100”. If only one
value without any slashes is entered, it is assumed than only the “Mean”
value is specified. To indicate that values for other than the five
mentioned statistical measures are present in the data, an asterisk
("*") is appended in the summary table (see image below, cell value
1////100 *).
If you checked the option Separate quantitative measures, for each
statistical measure in the quantitative
summary data a separate column will be allocated in the data grid view.
I.e. you can direcly enter your values into the table (see image below).
Text descriptor and Molecular sequence data
For Text and
sequence data the texts may be edited directly within the table.
The corresponding “notes” will not be affected.
Changing values in a table column
It is possible to modify several values of a single table column.
Therefore select the table entries that shall be edited - by selecting
an entry and clicking the button  in section
Column action you may select the whole table column (see image
below). Then select the required operation: “Insert”, “Append”,
“Replace” or “Clear” and enter the new rsp. new and old value. After
clicking the action button - depending on the selected Column action
this is
in section
Column action you may select the whole table column (see image
below). Then select the required operation: “Insert”, “Append”,
“Replace” or “Clear” and enter the new rsp. new and old value. After
clicking the action button - depending on the selected Column action
this is  (Insert),
(Append),
(Insert),
(Append),  (Replace) or
  (Clear). Be aware that this feature performs a pure text operation in
the table columns. Especially for quantitative and categorical data
columns the resulting data will be interpreted according to the rules
described above an might lead to unsexpected results, if not designed
ver carefully.
(Clear). Be aware that this feature performs a pure text operation in
the table columns. Especially for quantitative and categorical data
columns the resulting data will be interpreted according to the rules
described above an might lead to unsexpected results, if not designed
ver carefully.
Continue with:
Edit Description Grid
Save or discard changes
When you click in button “OK” the description grid view is closed and
all changes are automatically saved in the database. If you did some
changes and want to save them without leaving the form, simply click on
(see image below). If you close the window, e.g. by
clicking the “Cancel” button, and still have unsaved changes, you will
be asked to save or discard the changes.
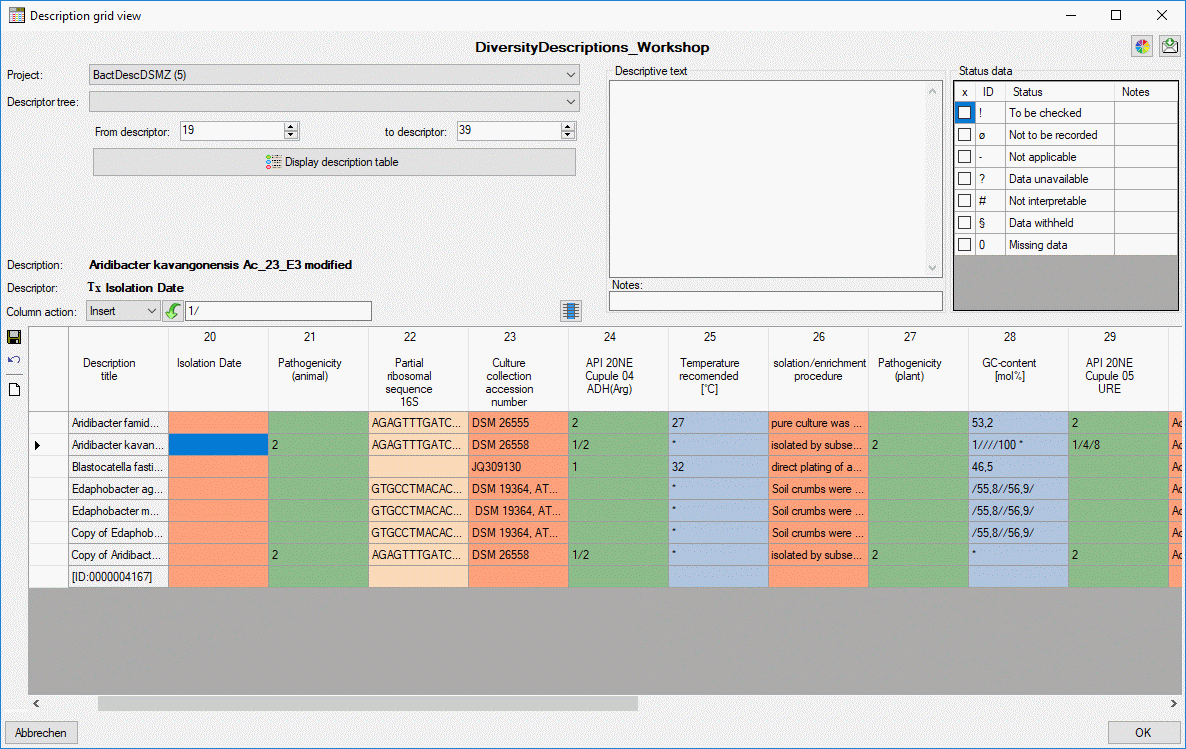
Undo all changes
You may discard all unsaved changes without leaving the form by clicking
the undo button and the data will be reloaded form the
database (see image below).
Edit Descriptor
Editing the descriptor
After starting a database query and selecting an entry in the result
list the dataset is diplayed in the edit window. In the header area the
dataset name is shown (see picture below). Below the header area the
descriptor name may be edited in a text box and the sequence number
(No.) can be set, which determines the display order in descriptor
lists. Changes of the descriptor name will be visible in the header
after saving the dataset. To check dataset changes, click on the
button to open the history.
The main descriptor data may be accessed in the first Main attributes tab, which is described below. Click on one of the other tabs
in the picture below to go directly to the appropriate manual chapter.

Main attributes tab
The main attributes tab provides access to an abbreviation, a detailled
descriptor text, notes and wording information for natural laguage
descriptions. In the bottom area the Descriptor type, Descriptor
settings, Measurement data (only for quantitative descriptors)
and Molecular sequence data (only for sequence descriptors) can be
adjusted. The descriptor type can only be modified, if the descriptor is
not referenced by any description. If the descriptor type “Categorical”
is changed, already entered categoricalstates will be deleted.
The check box Exclusive (only for categorical descriptors) indicates
that only one state shall be specified in a description. Check box
Mandatory indicates that for this descriptor always data shall be
specified. Statistical measurement scale specifies for categorical
descriptors, if the states are unordered (e.g. red/green/blue) of
ordered (e.g. bad/medium/good). For quantitative descriptors it
specifies if intervals or ratios are measured. Repeatability and
Availability specify how reliable (different measurements or
scorings by different observers) and accessible the descriptor is, e.g.
for identification.
For quantitative descriptors the Unit of the measurement values my
be specified either by directly entering the string or alternatively by
selecting a Prefix (e.g. “k” for “kilo” = 1000) and the Base
unit (e.g. “g” for “gramm”). Unit is prefix indicates that the
measurement unit preceeds the measurement value. Minimum and
Maximum specify the absolute range limits expected for the
measurement values. If in a description specific values, e.g. “Mean”,
exceed these limits, a warning will be shown. Values are integer
indicates that dedicated values, e.g. “Min” or “Max”, are expected to be
integer values. Take care that statisical measures like “Mean” certainly
may be real numbers. If this condition is violated in the description
data, a warning will be displayed.
For sequence descriptors the sequence type Nucleodide sequence or
Proteine sequence must be selected. Enable ambiguity symbols
determines if in the sequence data ambiguity symbols like “S” for “C or
G” in nucleotide sequences, are allowed. In case of protein sequences
the Symbol length may be chosen from one letter sybols (e.g. “A” for
“Alanine”) and three letter symbols (e.g. “Ala” for “Alanine). The Gap
symbol is a symbol that indicates gaps of unspecified length and must
meet the selected symbol length.
Project assignement
Descriptors are not directly assigned to a project, instead descriptortrees are used. One descriptor may be included
in several descriptor trees and therefore belong to several projects or
it might be unassigned. In both cases dedicated hints will be displayed
at the bottom of the application window (see pictures above and below).

You can easily find descriptors that are not included in any descriptor
tree by setting “Descriptor tree” → “Assignment” to “Ø” in the search
criteria. By opening the Descriptor treetab these descriptors may be easily inserted
into a tree by selecting the tree (node) and clicking
.
If the actually selected descriptor is referenced by more than ony
project and not all of the projects can be modified by the actual user,
the descriptor data cannot be changed, which will be indicated at the
lower right corner of the application window (see above).
Continue with:
Subsections of Edit Descriptor
Edit Descriptor
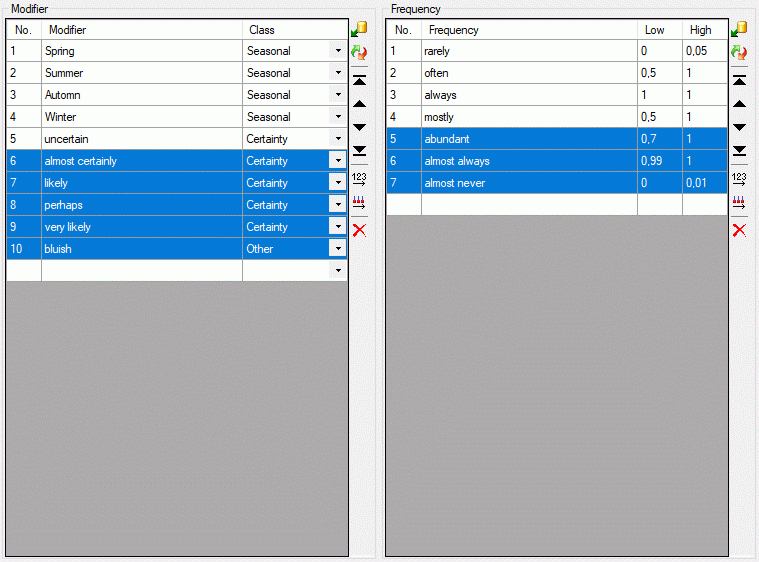
Modifier / Frequency
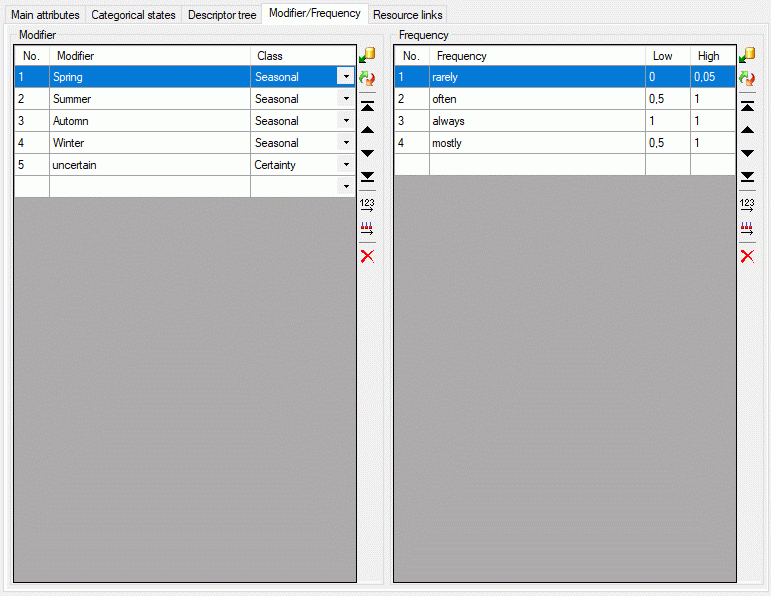
The Modifier/Frequency tab allows definition of modifier and
frequency values. The sequence number column (“No.”) determines the
display sequence in selection lists. You may order the entries by
clicking on a column header. With the arrow buttons (
) you can move the selected entries up or down
within the table, clicking button or
shifts the selected entries to the top
respective bottom of the table. After ordering the entries click button
to renumber the table entries (starting with “1”
for the first table entry) and make the changes effective. After
pressing button  column “Use” shows the number
of references in the database for each modifier rsp. frequency value.
column “Use” shows the number
of references in the database for each modifier rsp. frequency value.
To enter a new modifier or frequency value, select the empty line on the
end of the table and click on the “Modifier” rsp. “Frequency” field to
enter the new values. After entering the new entry name automatically a
new value for “No.” is initialized. To delete an entry, select the entry
and press the tool strip button, the Delete key or remove the value in the sequence
number column (“No.”).
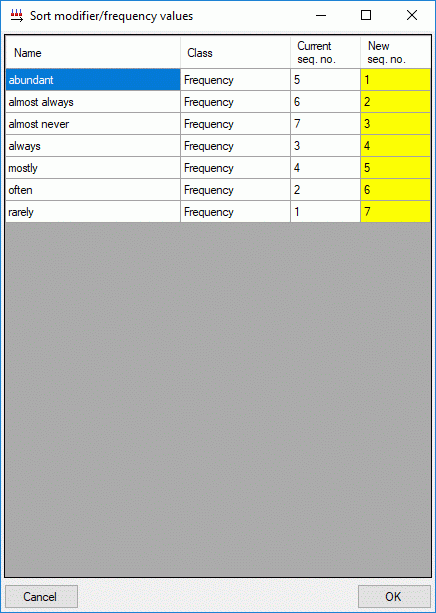
There is a number of predefined modifier and frequency values commonly
used. These values can be accessed by pressing
the button, which opens one of the windows shown
below.
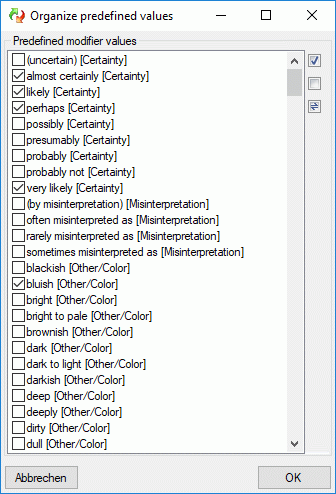
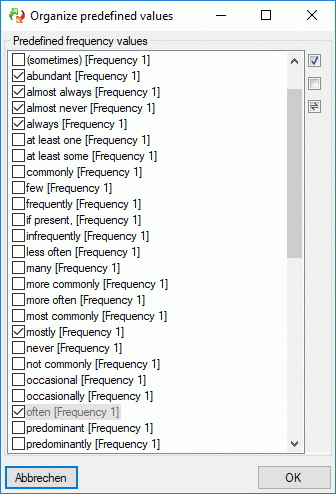
By checking of uncecking the values, they can easily be inserted or
deleted from the modifier rsp. frequency list. Values that are already
used in the database are marked by a grey
text colour. When these values are marked to be removed from the list,
you will be asked for each single value if it really shall be deleted
after pressing OK. New values are inserted at the end of the list
(see below).
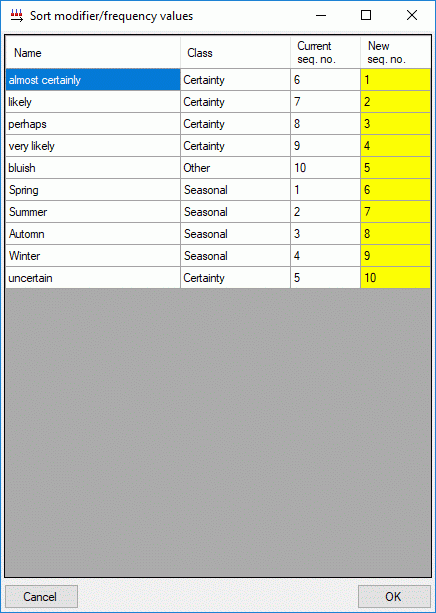
You may order the modifier and frequency values according the sequence
of the predefined values by pressing the  button, which opens one of the windows shown below. Values that are not
in the predefined lists will be shifted to the end of the list.
button, which opens one of the windows shown below. Values that are not
in the predefined lists will be shifted to the end of the list.
Continue with:
Edit Descriptor
Resource links
The resouce links tab allows assigment and inspection of resource links
for the descriptor. In the lower Resources part of the tab there are
two tables. Ar the left the “Resource” table specifies the single
resources, at the right the “Resource variant” table contains the
associated URLs to images, video or sound resources.
To enter a new resource select the empty line at the end of the
“Resource” table and click on the “Resource name” field. After entering
the “Resource name” (leave the cell by pressing the TAB key)
automatically a new value for the sequence number (“No.”) is
initialized. The sequence number determines the display order in tables
and may be changed manually. You may order the resource entries by
clicking on the column header or by using the arrow buttons in the left
tool strip ( and for up and down,
and to shift the
selected entry to top or bottom). After ordering the resources click
button to renumber the entries starting with “1”
and make the changes effective. In field “Ranking” you may enter a
numeric value in range 0 … 10 expressing the suitability of the
resource. In field “Role” you may select one of the offered values.
If you want to delete a resource, you have three choices:
- Select the resource and press the delete button in
the left tool strip.
- Select the resource and press the Delete key on the keyboard.
- Enter the sequence number column (“No.”) and remove the value. After
leaving the cell the entry will be deleted.
In any case you will be asked if you want to delete the data row, if
resource links are present.
To view or edit the additional resource data and copyright information
press on the button besides the resource
table. In field License: and a link to the license text in the web
may be entered, in field Rights: you may enter a copyright text. By
pressing the button a browser window can be
opened to navigate to the license page in the web. Furthermore you may
enter a detailled text (field Details:), the resource language
(field Language:) and set the Display embedded flag (see picture
below). If any additional resource data have been entered, this will be
indicated by a square (□) behind the resource name’s sequence number.
To enter a resource link, first select the entry in the “Resource”
table, then select the empty line at the end of the “Resource variant
table”. By clicking on the “URL” field a web address may be entered. By
double-clicking the “URL” field a browser window opens to navigate to
the resource. For each resource several URLs to resource variants with
different quality levels, e.g. different resolution, may be inserted.
For each entry in the URL table a different value of “Variant” must be
selected.
As an alternative to a resource URL a colour may be spcified in the
format “color://#rrggbb” where “rrggbb” specifies a hexadecimal colour
code. The colour can simply be seleced by clicking the button
besides the resource variant table.
To remove a resource variant, select the entry and press the
button in the right tool strip or the Delete key on the keyboard. Alternatively you
may delete the “URL” entry in the resource variant table.
The button besides the resource variant table
allows you to view a resource URL in the system browser.
The upper part of the resource links tab consists of a preview window on
the left side and the complete list of resource links. By selecting one
of the links the preview is shown on the preview window. If you press
button in the preview window, the resource is
opened in a separate viewer window.
At the bottom of the resource links tab the media data of a selected URL
are displayed. These data can be edited by double-clicking the “Type”
entry in the resource variant table, by clicking at one of the media
data value fields or the button. The edit
dialog provides the possibility to access the URL to get available data.
Alternatively the values may be edited manually.
Continue with:
Edit Descriptor
Categorical states
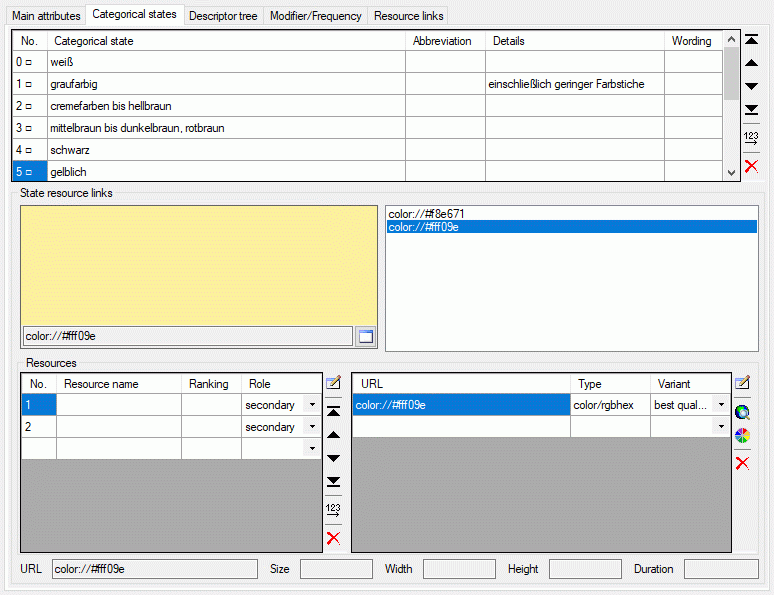
The Categorical states tab is only enabled, if the descriptor type
has been set to “Categorical”. The upper part of the state tab shows the
table of categorical states. To enter a new state select the empty line
at the end of the table and click on the “Categorical state” field.
After entering the “Categorical state” name (leave the cell by pressing
the TAB key) automatically a new value for the sequence number
(“No.”) is initialized. The sequence number determines the display order
in tables and may be changed manually. You may order the state entries
by clicking on the column header or by using the arrow buttons in the
tool strip right besides the states ( and
for up and down, and
to shift the selected entry to top or
bottom). After ordering the states click button to
renumber the entries starting with “1” and make the changes effective.
If you want to delete a categorical state, you have three choices:
- Select the state and press the delete button in the
tool strip right besides the states.
- Select the state and press the Delete key on the keyboard.
- Enter the sequence number column (“No.”) and remove the value. After
leaving the cell the entry will be deleted.
In any case you will be asked if you want to delete the data row. If the
categorical state is already used in any description items, the number
of affected entries will be shown and you have the option to abort the
action.
If for a state at least one assigned resource is present, the state is
marked by a square (□) behind its sequence number (see image above).
After selecting the categorical state its assigned resources ar
displayed in the lower part of the state tab, the State resource
links. It allows management of resources linked to a categorical state
marked in the upper table. For a detailled description take a look at
the Resource links tab section.
Continue with:
Edit Descriptor
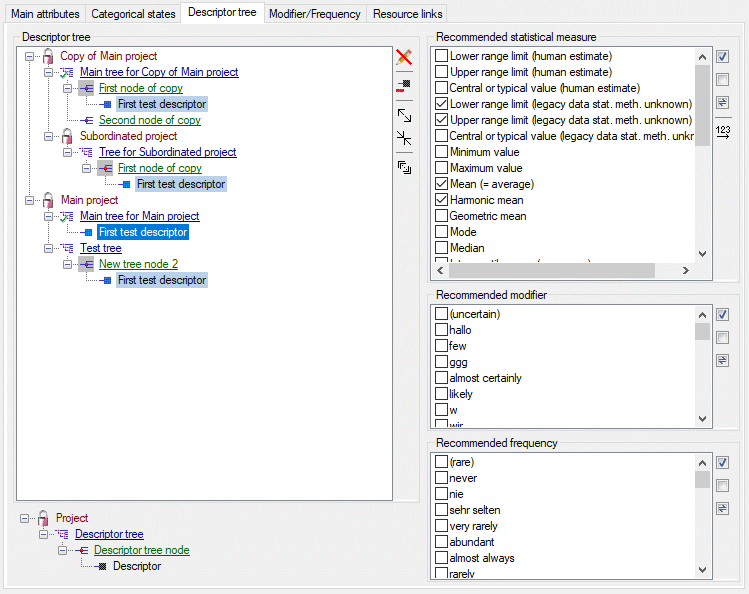
Descriptor tree
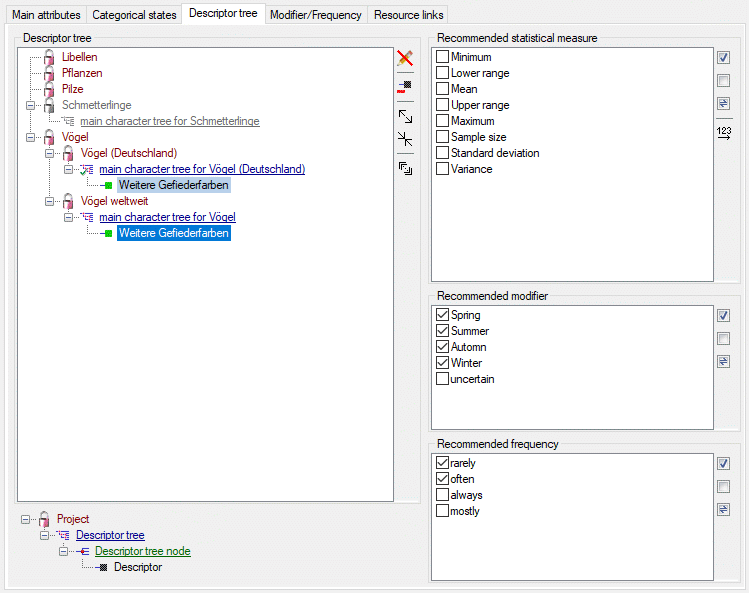
The Descriptor tree tab provides the possibility for a structured
assignment of the descriptors to the projects. The Descriptor tree
consists of three node types, which show the administered projects, descriptor
trees, descriptor tree nodes
and descriptors. The tree parts’ colours are shown in the example at
the bottom. By pressing the button on the tool
strip at the right side the example may be hidden. The buttons displayed
on the too strip will change depending on the selected entry.
The descriptor trees support three main functions:
- Assignment of descriptors to a certain project
- Selection of recommended Frequency/Modifier values and
Statistical measures for a certain descriptor
- Structured arragement of the descriptors, e.g. for hierarchical
selection lists and definition of descriptor subsets for description
editing and export
Descriptor trees are the root of a tree
and may only be appended at a project. To insert a new descriptor tree
select a project and press  . Descriptor tree nodes may be appended at a
descriptor tree or another descriptor tree node. To insert a new
descriptor tree node, select the parent and press
. Descriptor tree nodes may be appended at a
descriptor tree or another descriptor tree node. To insert a new
descriptor tree node, select the parent and press
 . Descriptors may be appended to a descriptor
tree or a descriptor tree node. To append a descriptor select the parent
and press
. Descriptors may be appended to a descriptor
tree or a descriptor tree node. To append a descriptor select the parent
and press  , to remove it select the descriptor
and press
, to remove it select the descriptor
and press  . All these functions can
alternatively be accessed by the context menu by a right click on the
entry. The descriptor type is indicated by different icons. Categorical
descriptors are marked as
. All these functions can
alternatively be accessed by the context menu by a right click on the
entry. The descriptor type is indicated by different icons. Categorical
descriptors are marked as  , quantitative
descriptors as
, quantitative
descriptors as  , text descriptors as
 and sequence descriptors as
 .
.
You may change the name of a Descriptor
tree or a Descriptor tree node
in three different ways:
- Select the tree element (single click) and then click once on it.
- Select the tree element (single click) and click on button
 in the tool bar on the right.
- Right-click the tree element and select item
Edit name from the context menu.
You may edit the name of the selected node within the tree. The Descriptor tree must be globally unique. The
Descriptor tree node names must be
unique with respect to their tree position, i.e. all nodes with the same
parent within a descriptor tree must have distinguished names.
If a Descriptor tree or a Descriptor tree node does not contain any
other element, it may be deleted by pressing  (delete descriptor tree) rsp.
  (delete
descriptor tree node). Please be aware that in edit mode “Descriptor”
the descriptor tree shows only the descriptor that as actually selected
in the query panel! To get a complete overview of all descriptors
assigned to a certain descriptor tree and to delete trees or nodes with
all included objects, select edit mode “Project” (see Editprojects).
(delete
descriptor tree node). Please be aware that in edit mode “Descriptor”
the descriptor tree shows only the descriptor that as actually selected
in the query panel! To get a complete overview of all descriptors
assigned to a certain descriptor tree and to delete trees or nodes with
all included objects, select edit mode “Project” (see Editprojects).
If projects and their associated descriptor trees cannot be changed,
because the project has been set to “read-only” state, these parts are
displayed with grey text color (see
project “Schmetterlinge” in picture above).
Descriptor trees can be marked as “tree complete”, to indicate that they
should contain all descriptors of the project. In this case the symbol
of the descriptor tree changes from  to
to
 . Setting and resetting the “tree
complete” flag is described in the Edit projects
section, where additional edit options are availabe.
. Setting and resetting the “tree
complete” flag is described in the Edit projects
section, where additional edit options are availabe.
When a new descriptor tree or descriptor tree node is inserted it gets a
numeric name, which may be changed by clicking on the node or selecting
 from the context menu. Take care that the
names of the discriptor trees must be unambiguous within the whole
database! The names of the descriptor tree nodes must only be
unambiguous within one parent.
from the context menu. Take care that the
names of the discriptor trees must be unambiguous within the whole
database! The names of the descriptor tree nodes must only be
unambiguous within one parent.
If no descriptor tree is installed for a certain project, all
descriptors, modifier/frequency values and statistical measures will be
usable in the project’s descriptions. Anyway, if you export data or
generate documents an do not have an appropriate descriptor tree, you
might have missing data! If a project contains several descriptor trees,
the available descriptors are the superset of the descriptors assigned
to all contained trees.
Sorting of descriptor tree elements
By pressing the button you can expand the tree
view to display all elements, by pressing the
tree will be collapsed to descriptor tree level. With the arrow buttons
( rsp.
) you can move descriptor tree nodes up or
down rsp. to the top or the bottom. An additional ordering option is to
select the descriptor tree node you want to move and click the
 button. The button’s back color changes to red and you may now select the new position in the
tree.
button. The button’s back color changes to red and you may now select the new position in the
tree.
In operation mode Edit projects you may take
over the descriptor order from a descriptor tree to the descriptor
sequence numbers of all project’s descriptors. This will affect the
descriptor presentation for description data editing or document
generation.
Descriptor tree node details
For Descriptor tree nodes you may enter
an abbreviation a details text and assign resource data. Select the
Descriptor tree node (single click) and
click on button in the tool bar on the right.
Alternatively you may right-click the Descriptor
tree node and select Edit
details from the context menu. An edit window as shown below will be
opened.
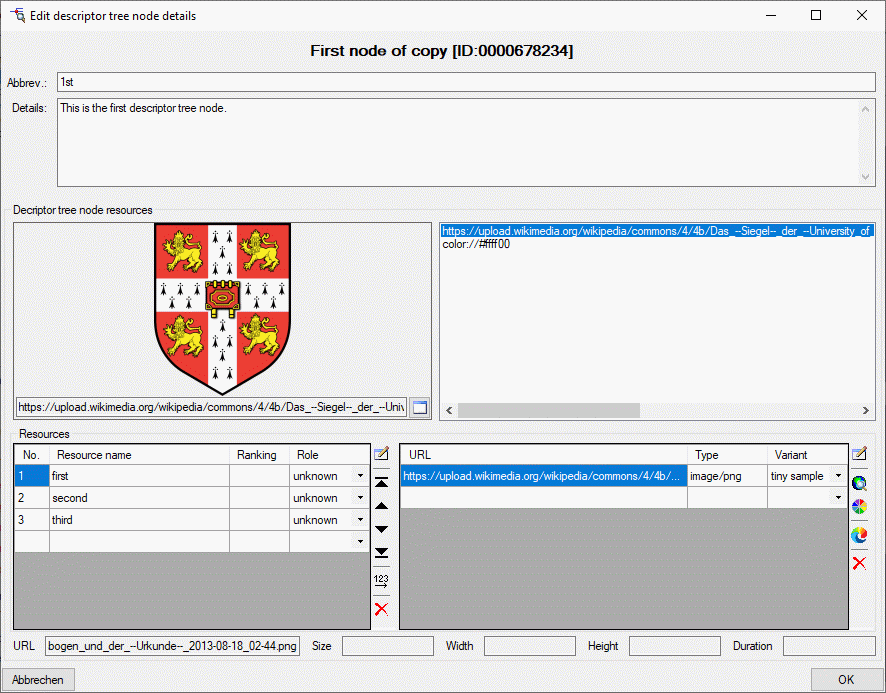
If resources are assigned to a Descriptor tree
node, its symbol is shown with grey
background in the descriptor tree. You may view the resources by
right-clicking it and selecting View resources
from the context menu.
Recommended statistical measures, modifiers and frequency values
Click on  in the tool bar to close the edit window
in the right part of the tab or on to reopen it.
In the edit window you can select recommended modifier/frequency values
and statistical measures. The recommended values can be administered for
a selected descriptor or for a selected descriptor tree node. In the
latter case selected values are inherited by all subordinate nodes,
which will be indicated by the background
colour if a subordinate node is selected in the descriptor tree.
in the tool bar to close the edit window
in the right part of the tab or on to reopen it.
In the edit window you can select recommended modifier/frequency values
and statistical measures. The recommended values can be administered for
a selected descriptor or for a selected descriptor tree node. In the
latter case selected values are inherited by all subordinate nodes,
which will be indicated by the background
colour if a subordinate node is selected in the descriptor tree.
To define the available modifier and frequency values and their display
sequence, please refer to the
Modifier/Frequency tab. The statistical
measure values are predefined, nevertheless their display sequence may
be modified using the button (see image above). A
form as shown below will appear. With the arrow buttons
( ) you can move the selected
entries up or down within the table, clicking button
or shifts the
selected entries to the top respective bottom of the table. After
ordering the entries click button to renumber the
table entries (starting with “1” for the first table entry) and make the
changes effective.
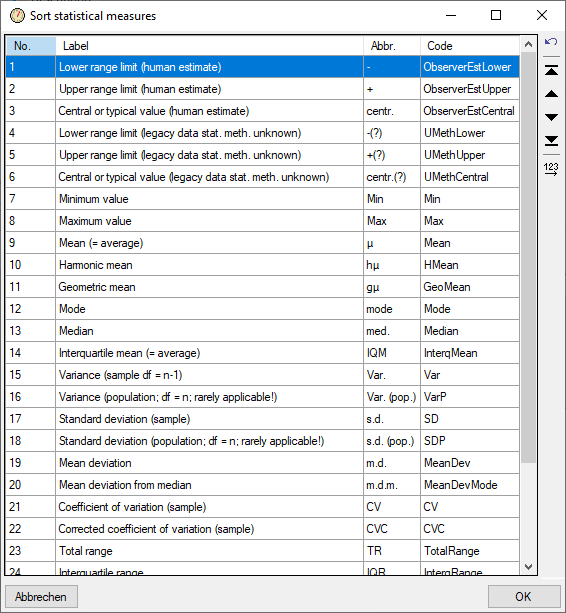
The picture below shows an example for a descriptor where the
recommended statistical measures Minimum value, Maximum value
and Mean are inherited by the superior node.
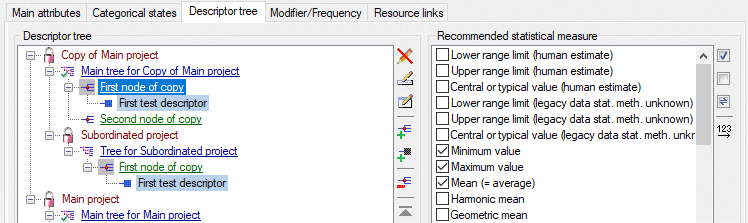
For the contained descriptor only additional values may be selected, but
the inherited values cannot be de-selected.
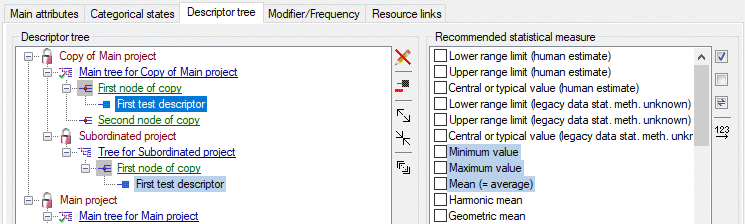
Continue with:
Edit Project
After starting a database query and selecting an entry in the result
list the dataset is diplayed in the edit window. In the header area the
dataset name and the project language are shown (see picture below). To
check dataset changes, click on the history button to
open the history.
The main project data may be accessed in the first Main attributestab, which is described below. Click on one of the other tabs
in the picture below to go directly to the appropriate manual chapter.
 button behind the project name (see image
below). By clicking the
button behind the project name (see image
below). By clicking the  button you may view the
login names that have access to the project.
button you may view the
login names that have access to the project.

If a project is linked with DiversityProjects, the name is fixed to
the value set in DiversityProjects. If the name is modified in
DiversityProjects, it will change in DiversityDescriptions, too, when
the project data are downloaded. The linking of a local
project to DiversityProjects is described below in the Cachedprojects section.

For a linked project some additional buttons are available (see
above): With URI you may view the symbolic
address of the referred DiversityProjects entry and with
you may view the data in
DiversityProjects. By clicking the button you may
view the login names that have access to the
project. With the  button you may release the
connection to DiversityProjects. I.e. the current project will become a
local project.
button you may release the
connection to DiversityProjects. I.e. the current project will become a
local project.
Main attributes tab
The main attributes tab provides access to a license URI, a short rights
text and a detailled project text. The project language can be selected
from a list. In field Rights you may enter a copyright text, in
field License and a link to the license text in the web may be
entered. By pressing the button a browser window
can be opened to navigate in the web.
In the Wording field you may enter an alternative project name,
which is used for the cache database. When a
project has been published in a cache database and it is renamed, this
field offers the opportunity to keep the published name. If a project
published in the cache database and is renamed, the original project
name will be automatically be inserted in the Wording field, if it
is empty. Therefore publishing with the old project name will still be
possible. To modify the published project name, too, update or remove
the Wording entry and re-create the project in the cache database.
With combo box Language you can select the project’s default
language. You man change the display and sorting of the entries in the
Language combo box from “<code> - <description>” to
“<description> - <code>” (and back) by clicking the button
 . If you need language codes that are not included
in the list, click the edit button. For more details
see Edit language codes.
. If you need language codes that are not included
in the list, click the edit button. For more details
see Edit language codes.
Parent project
In the bottom area at the left side the Parent project can be
adjusted. If the project has no parent, select “Root” (symbol
 ). The Parent
project adjustment has an influence on the available descriptors,
recommended modifier and frequency values and recommended statistical
measures, because these adjustments are inherited by the subordinate
project. If for a project in the Parent project tree no write access
is possible, this is indicated by grey text
colour and symbol . The missing write rights
for a parent project has no influence on accessability of the actually
selected project, except that the parent project adjustment cannot be
changed.
). The Parent
project adjustment has an influence on the available descriptors,
recommended modifier and frequency values and recommended statistical
measures, because these adjustments are inherited by the subordinate
project. If for a project in the Parent project tree no write access
is possible, this is indicated by grey text
colour and symbol . The missing write rights
for a parent project has no influence on accessability of the actually
selected project, except that the parent project adjustment cannot be
changed.
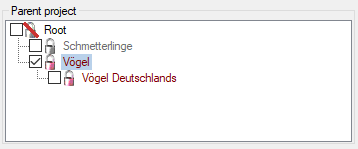
Cached projects
The Cached projects section shows entries that are downloaded fromDiversityProjects and not yet used within
DiversityDescriptions (see image below, left). Accessible projects are
shown with symbol  , read-only projects as
and projects wihout any access rights as
, read-only projects as
and projects wihout any access rights as
 . When you click on the project name,
additional buttons are displayed (see image below, right). You may view
the database link by clicking on URI or view
the data stored in DiversityProjects by clicking on symbol
. By clicking the
button you may view the login names that have
access to the project. With button
. When you click on the project name,
additional buttons are displayed (see image below, right). You may view
the database link by clicking on URI or view
the data stored in DiversityProjects by clicking on symbol
. By clicking the
button you may view the login names that have
access to the project. With button
 you may link the current project to the
selected DiversityProjects entry.
you may link the current project to the
selected DiversityProjects entry.
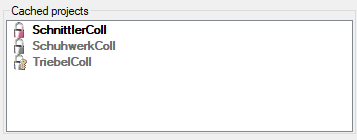
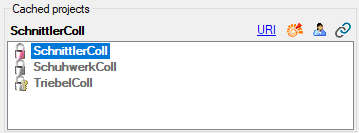
Scope values
In the Scope values section at the right the values for scope types
“Sex”, “Stage” and “Other scope” may defined. When you mark one of the
entries, a tool strip with the available operations is shown at the
right border of the control. To insert a new value, select the scope
type and press button . In case of “Sex” one of the
predefined “sex status” values derived from the SDD standard has to be
selected. In all other cases a new value with a numeric key is appended,
that can be renamed by pressing the edit button and
selecting  Edit scope name or by clicking
at the name.
Edit scope name or by clicking
at the name.
In case of “Sex” scope the “Edit” menu offers the additional menu items
Reset scope name, which appears if the name
differs from the original “sex status”. Further the “sex status” value
may be changed with menu item  Set sex status.
For the other scope types you may enter a details text by pressing the
button and selecting
Edit scope details.
Set sex status.
For the other scope types you may enter a details text by pressing the
button and selecting
Edit scope details.
To remove a scope value, select it and press the
button. To make a value available for the project, the check box must be
checked. If the selected project has a parent and a value has already
been checked in the parent project, this is indicated by the background colour (see image below).
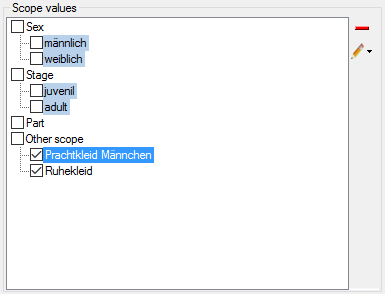
Continue with:
Subsections of Edit Project
Edit Project
Dependencies
Descriptor applicability
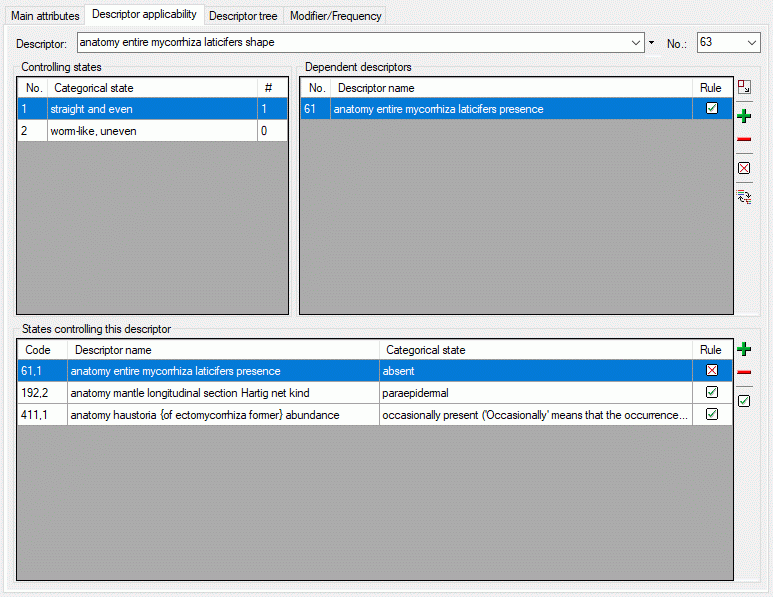
The Descriptor applicability tab serves the administration of
dependencies between categorical states and dependent descriptors. First
a descriptor has to be selected either by its name in the alphabetically
ordered drop down list or its sequence number (“No.”) in the first line
of the descriptor dependencies tab. If for the selected project a
descriptor tree is present, the button allows
selecting the descriptor form the descriptor tree (see picture below).
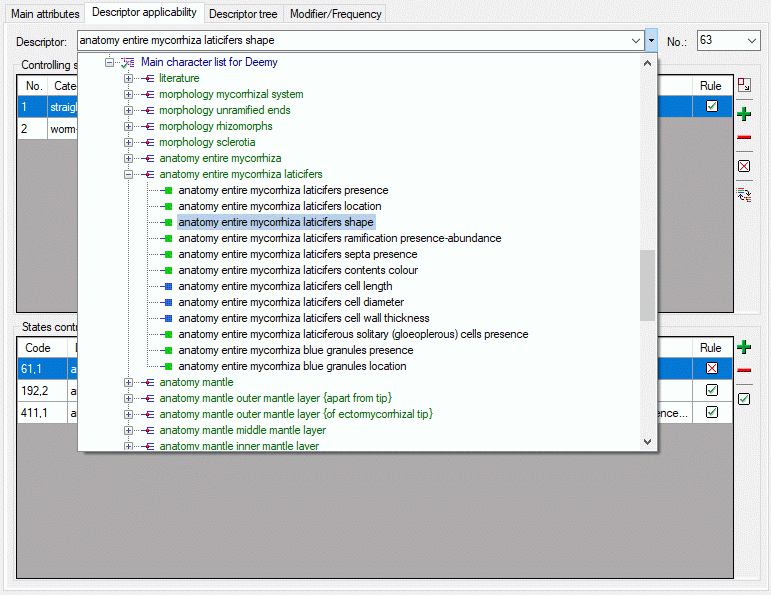
The table Controlling states in the upper left part of the tab shows
the categorical states if a categorical descriptor has been selected.
When you have adusted the restrichted descriptor view, visible by the
button  in the toolbar of the Dependent
descriptor section, only the actually set dependent descriptors are
displayed here. You can switch to an alternate Full descriptorview as described below. For each categorical state
Dependent descriptors can be inserted by pressing the
button. A dialog window opens to select the
descriptor either by its name, sequence number or using the descriptor
tree (see picture below).
in the toolbar of the Dependent
descriptor section, only the actually set dependent descriptors are
displayed here. You can switch to an alternate Full descriptorview as described below. For each categorical state
Dependent descriptors can be inserted by pressing the
button. A dialog window opens to select the
descriptor either by its name, sequence number or using the descriptor
tree (see picture below).
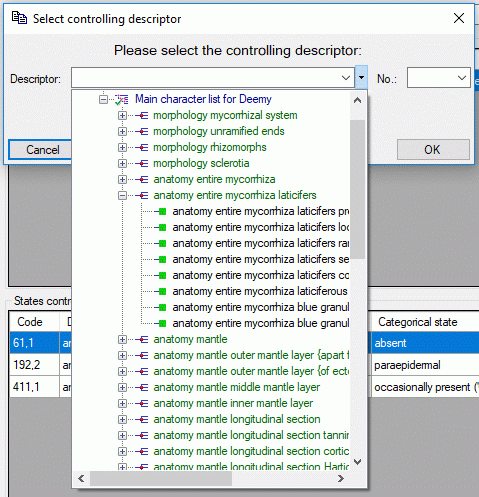
In column “Rule” the symbol  indicates that the
dependent descriptor is inapplicable if the controlling state is present
in a description. The symbol
indicates that the
dependent descriptor is inapplicable if the controlling state is present
in a description. The symbol  indicates that the
controlling state must be present in a description if the controlled
descriptor shall be applicable. The rule can be toggled by clicking the
symbol in the table or by pressing the corresponding button
( rsp. ) at the right. To
remove a dependent descriptor select it and press the
button.
indicates that the
controlling state must be present in a description if the controlled
descriptor shall be applicable. The rule can be toggled by clicking the
symbol in the table or by pressing the corresponding button
( rsp. ) at the right. To
remove a dependent descriptor select it and press the
button.
In the lower part of the tab you find the States controlling this
descriptor. You may double-click on the item to select navigate to it
for editing. Alternatively you may edit the controlling descriptor
states using the control buttons of the tool strip at the right. By
double-clicking an entry in Dependent descriptors or in States
controlling this descriptor you may navigate forwards and backwards in
the chain of dependent descriptors.
If you want to get an overview of all the project’s descriptor
dependencies or want to delete all dependencies, take a look at the
Applicability tree section below.
Calculation of the descriptor applicability
To decide if a descriptor is applicable in a description, the following
conditions are evaluated:
- Inapplicable-if rule: If only controlling states are present in a
description, these make the controlled descriptor inapplicable. The
character remains applicable if either no state at all, or any
non-controlling states are present.
- Applicable-if rule: If any controlling state is present in a
description, these make the controlled descriptor applicable. It is
inapplicable if only non-controlling states are present.
- Special condition 1: If the controlling descriptor is inapplicable
(through another applicability rule, or through an explicit “Not
applicable” data status value), the controlled descriptor is always
inapplicable as well.
- Special condition 2: If no data for the controlling descriptor are
present in a description (data completely missing or only status is
“Missing data” or “Not to be recorded”), the controlled descriptor
always remains applicable.
Full descriptor view
By clicking the button in the toolbar of the
Dependent descriptor section, you can chenge to the full descriptor
view (see image below). In section Dependent descriptors all
available project descriptors are shown. You may set a dependency by
selecting the descriptor and clicking the button
rsp. . To remove the dependency, click on button
 . Alternatively you may click on they symbol in
the table column “Rule” to change the values in the sequence
→ ->
.
. Alternatively you may click on they symbol in
the table column “Rule” to change the values in the sequence
→ ->
.
If you select a values for the Descriptor tree, the descriptor list
is restricted to the values included in that descriptor tree. Please be
aware that existing dependencies might be hidden by such a selection!
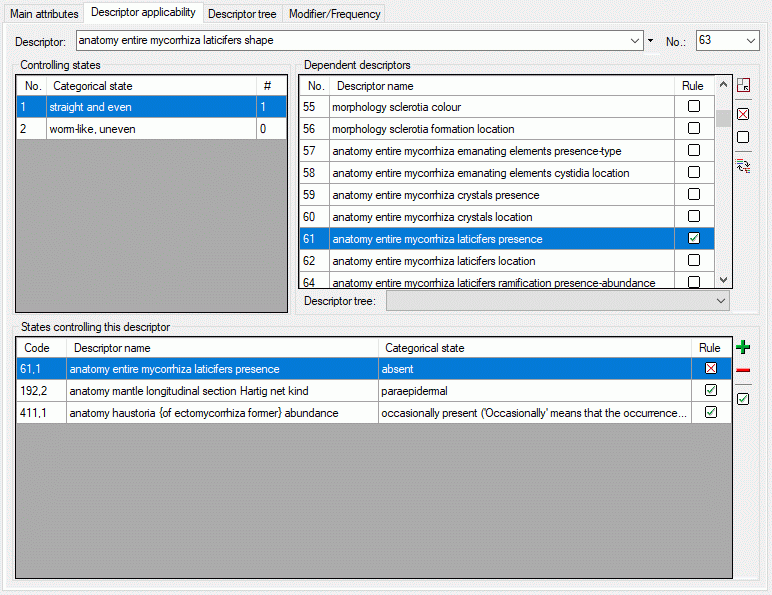
You can return to the restricted descriptor view by clicking on button
 .
.
Applicability tree
Instead of the States controlling this descriptor you may display a
complete overview of the descriptor applicability rules by pressing the
 button in the Dependent descriptors
section (see image below). By double-clicking an item in the
Applicability tree you can open it for editing.
button in the Dependent descriptors
section (see image below). By double-clicking an item in the
Applicability tree you can open it for editing.
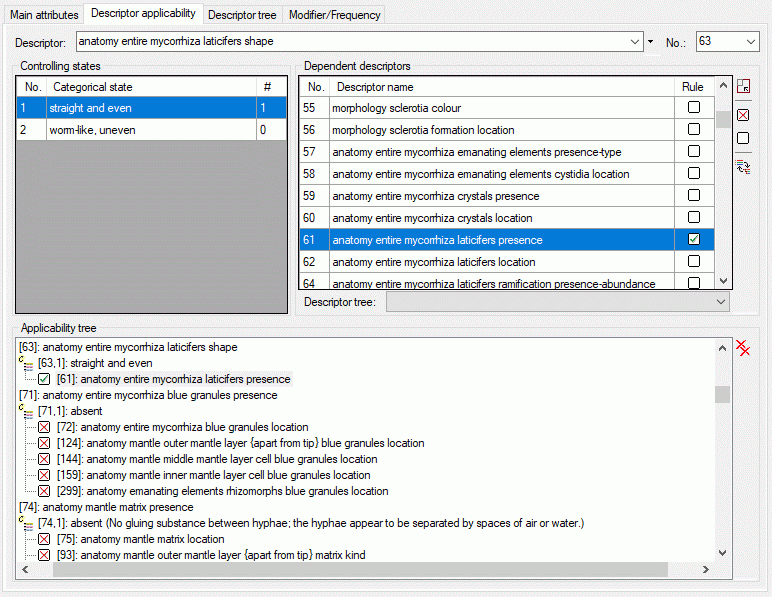
By pressing the  button in the Applicability
tree section you can delete all dependencies shown in the tree.
button in the Applicability
tree section you can delete all dependencies shown in the tree.
Continue with::
Edit Project
Modifier / Frequency
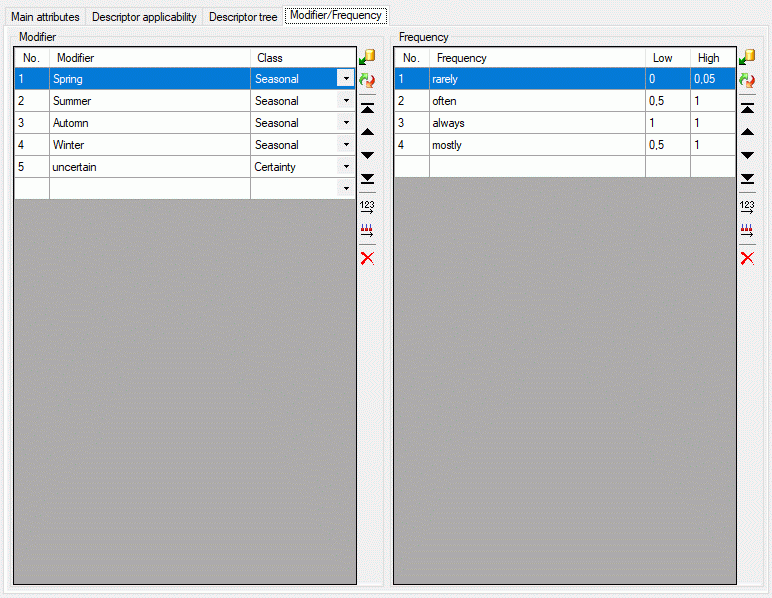
The Modifier/Frequency tab allows definition of modifier and
frequency values. The sequence number column (“No.”) determines the
display sequence in selection lists. You may order the entries by
clicking on a column header. With the arrow buttons (
) you can move the selected entries up or down
within the table, clicking button or
shifts the selected entries to the top
respective bottom of the table. After ordering the entries click button
to renumber the table entries (starting with “1”
for the first table entry) and make the changes effective. After
pressing button column “Use” shows the number
of references in the database for each modifier rsp. frequency value.
To enter a new modifier or frequency value, select the empty line on the
end of the table and click on the “Modifier” rsp. “Frequency” field to
enter the new values. After entering the new entry name automatically a
new value for “No.” is initialized. To delete an entry, select the entry
and press the tool strip button, the Delete key or remove the value in the sequence
number column (“No.”).
There is a number of predefined modifier and frequency values commonly
used. These values can be accessed by pressing
the button, which opens one of the windows shown
below.
By checking of uncecking the values, they can easily be inserted or
deleted from the modifier rsp. frequency list. Values that are already
used in the database are marked by a grey
text colour. When these values are marked to be removed from the list,
you will be asked for each single value if it really shall be deleted
after pressing OK. New values are inserted at the end of the list
(see below).
You may order the modifier and frequency values according the sequence
of the predefined values by pressing the
button, which opens one of the windows shown below. Values that are not
in the predefined lists will be shifted to the end of the list.
Continue with:
Edit Project
Move or copy descriptor trees
Using the context menue, you may move or copy parts of a descriptor tree
to other branches. Please note that for the move and copy operations the
selected project, marked by its background
colour in the descriptor tree, is assumed as the target project.
You may copy descriptor trees or parts of projects with read-only access
to your selected project. The move operation is certainly not possible
in those cases. Note that by the copy operations only the tree
structures will be copied, associated recommended statistical measures,
modifiers and frequencies will not be copied! The move operations
preserve those adjustments.
Remark: If you want to move or copy element from an other than the
selected project, activate the “Show all projects” option by clicking
the button in the tool strip. The icon
background will be changed to red color to
indicate that this option is active.
1. Move or copy a descriptor tree
Right click on the descriptor tree you want to move/copy. A context menu
opens, that offers the options  Copy ‘<tree
name>’ to ‘<project name>’ rsp.
Copy ‘<tree
name>’ to ‘<project name>’ rsp.  Move
‘<tree name>’ to ‘project name’ (see picture below left). If you
selected “Move”, the descriptor tree is removed from the original
project and appended to your selected project. If you selected “Copy”, a
copy of the tree will be appended to the selected project. In this case
numeric IDs are appended to generate unique tree and tree node names
(see picture below right). The copy function can be used to generate a
clone of a descriptor tree in the selected project.
Move
‘<tree name>’ to ‘project name’ (see picture below left). If you
selected “Move”, the descriptor tree is removed from the original
project and appended to your selected project. If you selected “Copy”, a
copy of the tree will be appended to the selected project. In this case
numeric IDs are appended to generate unique tree and tree node names
(see picture below right). The copy function can be used to generate a
clone of a descriptor tree in the selected project.
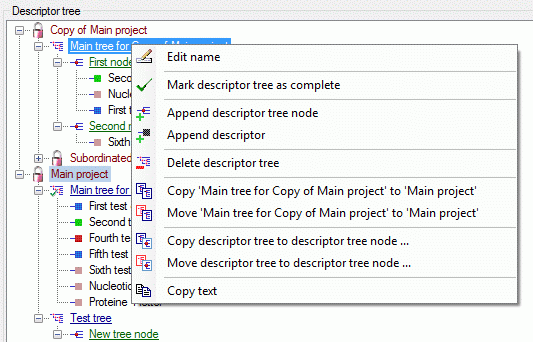
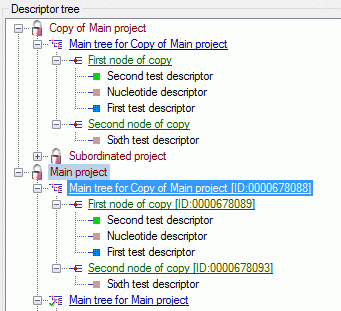
Additionally you may copy the contents of a descriptor tree to a
descriptor tree node by clicking selecting the option
 Copy descriptor tree to descriptor tree
node … rsp.
Copy descriptor tree to descriptor tree
node … rsp.  Move descriptor tree to
descriptor tree node … (see picture above left). A separate window
opens to select the target node (see picture below left). Find the move
result in the right picture below. Since the tree has been moved, the
tree node names have not been changed. One duplicate descriptor has not
been moved to the target node.
Move descriptor tree to
descriptor tree node … (see picture above left). A separate window
opens to select the target node (see picture below left). Find the move
result in the right picture below. Since the tree has been moved, the
tree node names have not been changed. One duplicate descriptor has not
been moved to the target node.
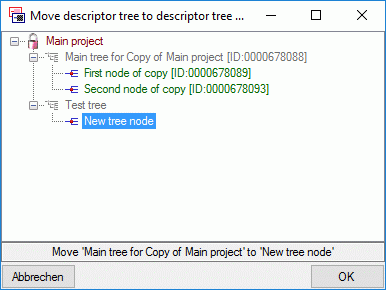
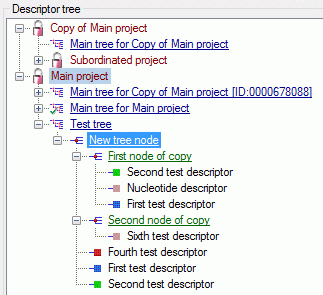
2. Move or copy a descriptor tree node
Right click on the descriptor tree node you want to move/copy. A context
menu opens, that offers the options  Copy
descriptor tree node … rsp.
Copy
descriptor tree node … rsp.  Move
descriptor tree node … (see picture below left). After selecting one
of there items a dialog windows opens where you may select the target
descriptor tree or descriptor tree node (see picture below right).
Move
descriptor tree node … (see picture below left). After selecting one
of there items a dialog windows opens where you may select the target
descriptor tree or descriptor tree node (see picture below right).
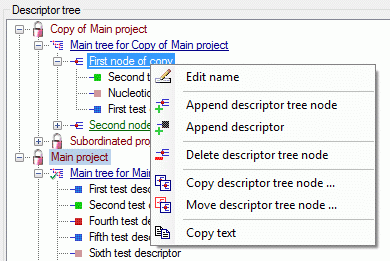
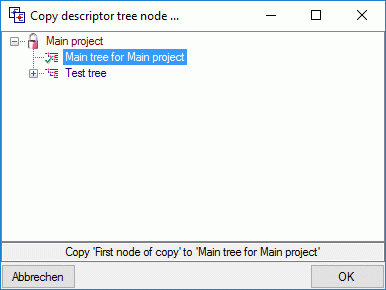
If you selected “Move”, the descriptor tree node is removed from the
original position and appended to the selected tree position. If you
selected “Copy”, a copy of the tree node will be appended to the
selected tree position. In this case numeric IDs are appended to
generate unique tree node names (see picture below). The copy function
can also be used to generate a clone of a descriptor tree node in the
selected project.
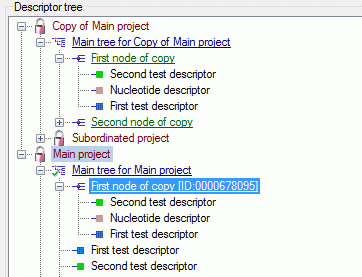
3. Move or copy a descriptor
Right click on the descriptor you want to move/copy. A context menu
opens, that offers the options  Copy
descriptor … rsp.
Copy
descriptor … rsp.  Move descriptor
… (see picture below left). After selecting one of there items a
dialog windows opens where you may select the target descriptor tree or
descriptor tree node (see picture below right).
Move descriptor
… (see picture below left). After selecting one of there items a
dialog windows opens where you may select the target descriptor tree or
descriptor tree node (see picture below right).
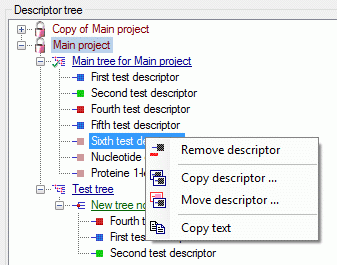
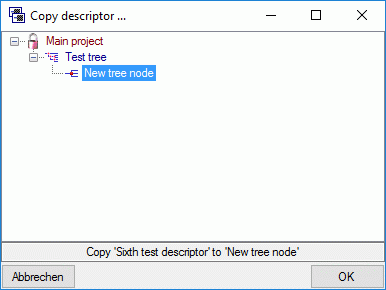
If you selected “Move”, the descriptor is removed from the original
position and appended to the selected tree position. If you selected
“Copy”, a new descriptor node will be appended to the selected tree
position (see picture below).
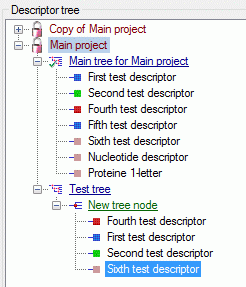
Continue with:
Edit Project
Descriptor tree
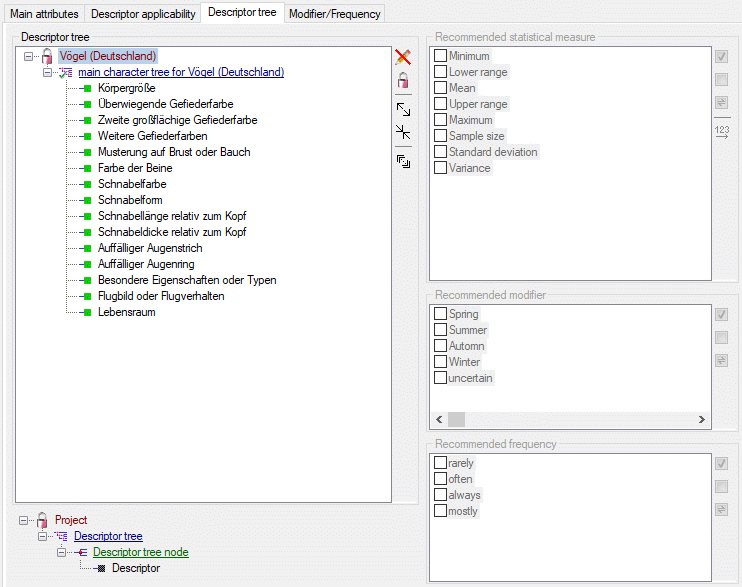
The Descriptor tree tab provides the possibility for a structured
assignment of the descriptors to the projects. The Descriptor tree
consists of three node types, which show the administered projects, descriptor
trees, descriptor tree nodes
and descriptors. The tree parts’ colours are shown in the example at
the bottom. By pressing the button on the tool
strip at the right side the example may be hidden. The buttons displayed
on the too strip will change depending on the selected entry.
By default only the selected project. its subordinated projects and
their descriptor trees are displayed. You may select the “Show all
projects” option by clicking the button in the
tool strip to show alle projects. To indicate that this option is
active, the icon background will be changed to red color (see images below). Be aware that this
option might slow down data loading.
The descriptor trees support three main functions:
- Assignment of descriptors to a certain project
- Selection of recommended Frequency/Modifier values and
Statistical measures for a certain descriptor
- Structured arragement of the descriptors, e.g. for hierarchical
selection lists and definition of descriptor subsets for description
editing and export
Descriptor trees are the root of a tree
and may only be appended at a project. To insert a new descriptor tree
select a project and press , to delete it select
the descriptor tree and press . Descriptor tree
nodes may be appended at a descriptor tree or another
descriptor tree node. To insert a new descriptor tree node, select the
parent and press , to remove it select the
descriptor tree node and press .
Descriptors may be appended to a descriptor tree or a descriptor
tree node. To append a descriptor select the parent and press
, to remove it select the descriptor and press
. All these functions can alternatively be
accessed by the context menu by a right click on the entry. The
descriptor type is indicated by different icons. Categorical descriptors
are marked as , quantitative descriptors as
, text descriptors as
and sequence descriptors as .
You may change the name of a Descriptor
tree or a Descriptor tree node
in three different ways:
- Select the tree element (single click) and then click once on it.
- Select the tree element (single click) and click on button
in the tool bar on the right.
- Right-click the tree element and select item
Edit name from the context menu.
You may edit the name of the selected node within the tree. The Descriptor tree must be globally unique. The
Descriptor tree node names must be
unique with respect to their tree position, i.e. all nodes with the same
parent within a descriptor tree must have distinguished names.
If projects and their associated descriptor trees cannot be changed,
because the project has been set to “read-only” state, these parts are
displayed with grey text color (see
project “Schmetterlinge” in picture above).
When a new descriptor tree or descriptor tree node is inserted it gets a
numeric name, which may be changed by clicking on the node or selecting
from the context menu. Take care that the names
of the discriptor trees must be unambiguous within the whole database!
The names of the descriptor tree nodes must only be unambiguous within
one parent.
If no descriptor tree is installed for a certain project, all
descriptors, modifier/frequency values and statistical measures will be
usable in the project’s descriptions. Anyway, if you export data or
generate documents an do not have an appropriate descriptor tree, you
might have missing data! If a project contains several descriptor trees,
the available descriptors are the superset of the descriptors assigned
to all contained trees.
Editing the project descriptor assignemnts for a tree node
When you use button to append a descriptor to a
tree node, you will be offered all accessible descriptors in the
database. In many cases, when you have already assigned all required
descriptors to the project, you may wish to build some additional
structured descriptor trees. If you select a descriptor tree or a
descriptor tree node, the button  is shown
(see image below left). After clicking this button you will get a
selection list with all descriptors assigned to the project. Descriptors
that are included in the tree node are selected in the list (see image
below right). You may easily change the selection and click “OK” to make
the changes effective.
is shown
(see image below left). After clicking this button you will get a
selection list with all descriptors assigned to the project. Descriptors
that are included in the tree node are selected in the list (see image
below right). You may easily change the selection and click “OK” to make
the changes effective.
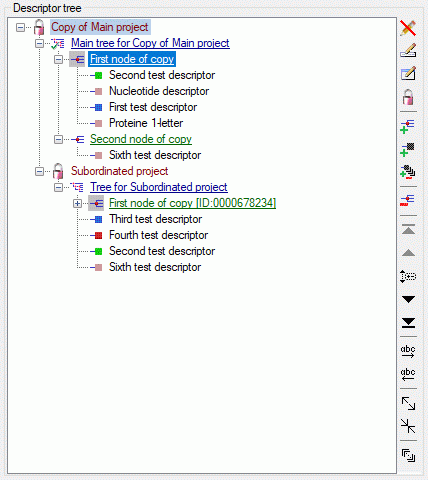
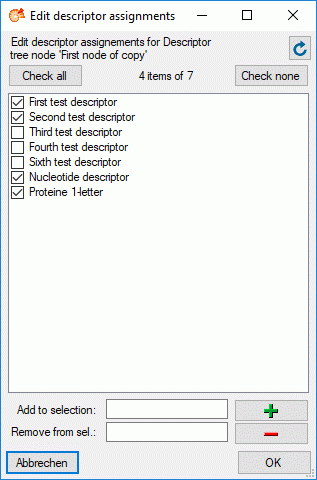
Sorting of descriptor tree elements
By pressing the button you can expand the tree
view to display all elements, by pressing the
tree will be collapsed to descriptor tree level. With the arrow buttons
( rsp.
) you can move descriptors or descriptor tree
nodes up or down rsp. to the top or the bottom. An additional ordering
option is to select the descriptor tree node you want to move and click
the button. The button’s back color changes to
red and you may now select the new position
in the tree. If you select a descriptor tree or a descriptor tree node,
you may arrange the contained descriptors in alphabedical order by
clicking the buttons  (ascending) or
 (descending).
A descriptor tree may be marked as “tree complete” to indicate that this
tree shall contain all descriptors for the project. This is done by
selecting the descriptor tree node and clicking the button
 . To indicate that the tree is marked as complete the
tree icon changes to (see picture
below).
. To indicate that the tree is marked as complete the
tree icon changes to (see picture
below).
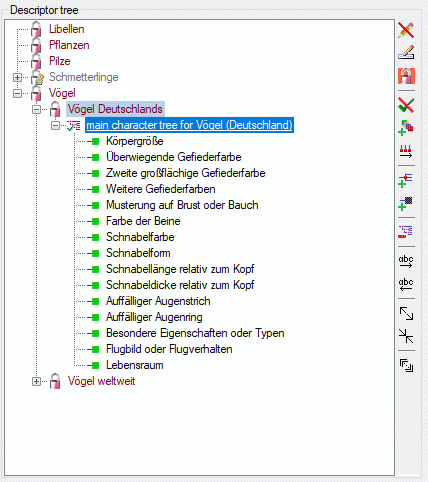
The “tree complete” flag may be removed by clicking the button
 and the tree icon will be changed back to
(see picture below).
and the tree icon will be changed back to
(see picture below).
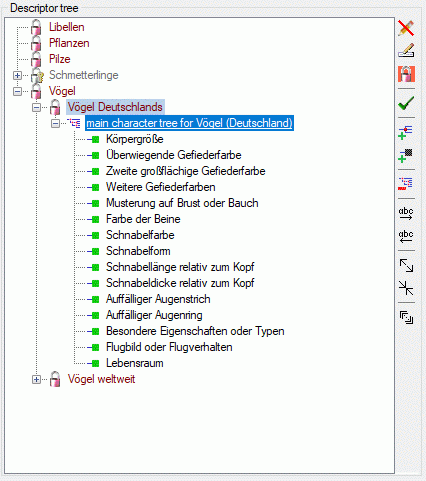
If a descriptor tree is marked as “tree complete”, it can be used to
take over the sorting of the descriptor nodes to the sequence number of
the descriptors. But you must be aware that the descriptor’s sequence
number (field “No.” in “Edit descriptor” main panel) is not project or
tree dependent, i.e. that this operations will have influence on the
dispolay sequence of all descriptions using these descriptors. Click on
button (see picture above) to open the
descriptor sorting window below.
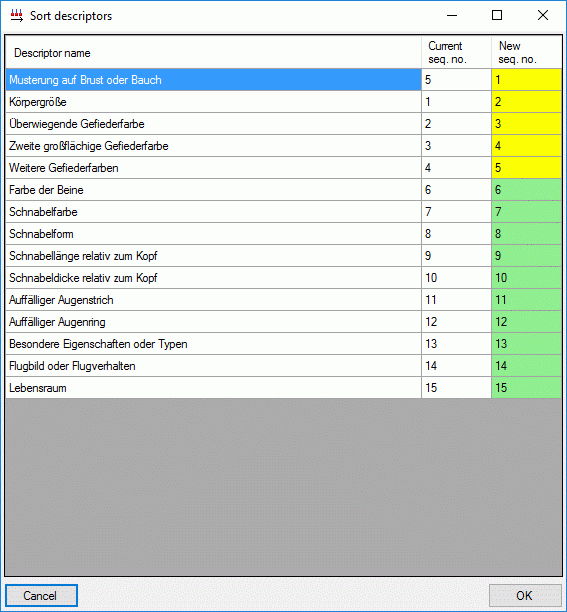
The first column shows the descriptor names as sorted in the descriptor
tree, the second column shows the current sequence number int the
database and the last column shows the new sequence number. If the
sequence number stays unchanged, the new sequence number is displayed
with green background, otherewise with yellow background. You may click on a new sequence
number and change its value manually. By clicking on the table headers,
you may sort the table display according descriptor names, old or new
sequence numbers. If a descriptor may not be changed, because it is
assigned to a project where the user has no write access, the whole line
is displayed with grey backgound and cannot
be changed. Finally click on OK to accept or Cancel to reject
the changes.
An additional option available for complete trees is to copy missing
descriptors with button . The descriptors available for a certain
project include all descriptors assigned to all descriptor trees of the
project and its sub-projects. In our example a new descriptor tree has
been assigned to the upmost project (see image below left). After
clicking the  button all valid descriptors are
inserted to the descriptor tree (see image below right).
button all valid descriptors are
inserted to the descriptor tree (see image below right).
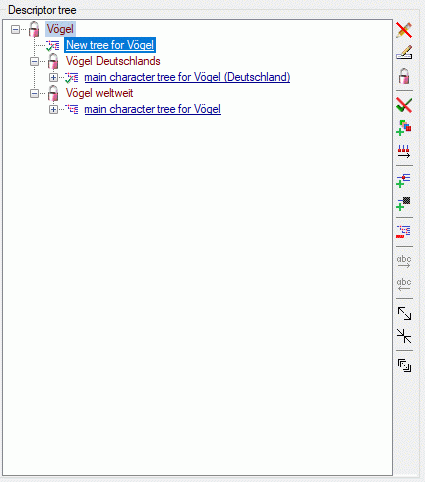
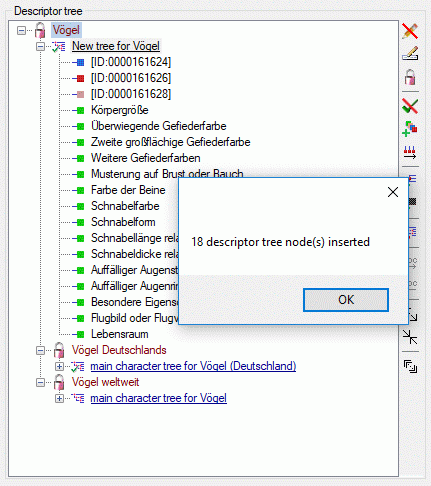
Descriptor tree node details
For Descriptor tree nodes you may enter
an abbreviation a details text and assign resource data. Select the
Descriptor tree node (single click) and
click on button in the tool bar on the right.
Alternatively you may right-click the Descriptor
tree node and select Edit
details from the context menu. An edit window as shown below will be
opened.
If resources are assigned to a Descriptor tree
node, its symbol is shown with grey background in the descriptor tree. You may
view the resources by right-clicking it and selecting
View resources from the context menu.
Recommended statistical measures, modifiers and frequency values
Click on in the tool bar to close the edit window
in the right part of the tab or on to reopen it.
In the edit window you can select recommended modifier/frequency values
and statistical measures. The recommended values can be administered for
a selected descriptor or for a selected descriptor tree node. In the
latter case selected values are inherited by all subordinate nodes,
which will be indicated by the background
colour if a subordinate node is selected in the descriptor tree.
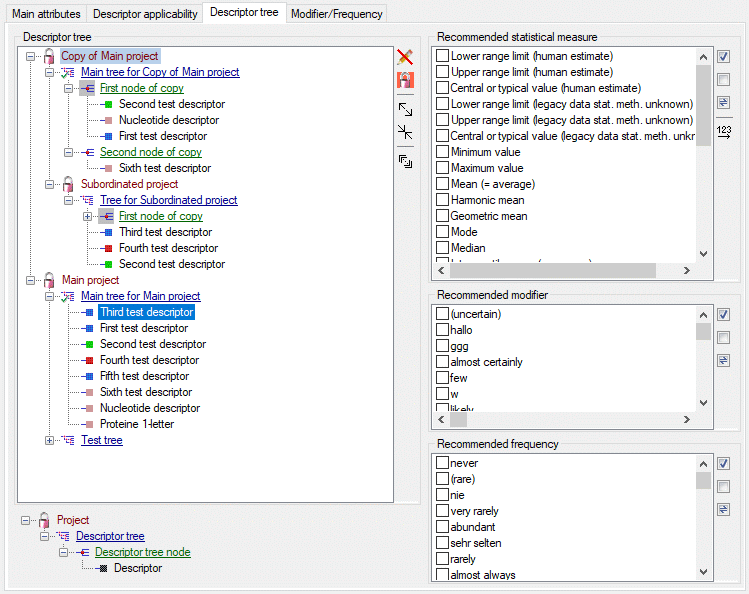
To define the available modifier and frequency values and their display
sequence, refer to the Modifier/Frequency
tab. The statistical measure values are predefined, nevertheless their
display sequence may be modified using the button
(see image above). A form as shown below will appear. With the arrow
buttons ( ) you can move the
selected entries up or down within the table, clicking button
or shifts the
selected entries to the top respective bottom of the table. After
ordering the entries click button to renumber the
table entries (starting with “1” for the first table entry) and make the
changes effective.
The picture below shows an example for a descriptor where the
recommended statistical measures Mini mum value, Maximum value
and Mean are inherited by the superior node.
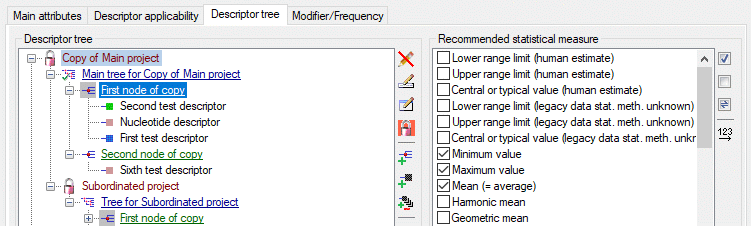
For the contained descriptor only additional values may be selected, but
the inherited values cannot be de-selected.
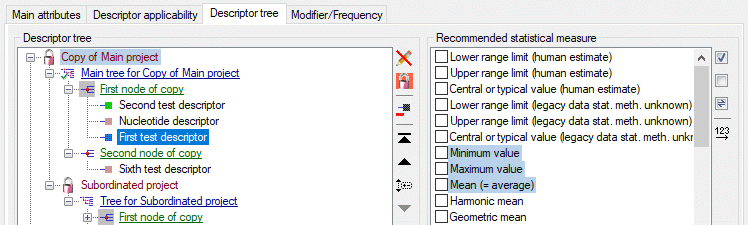
Continue with:
Edit Sample Data Grid
Sample data grid view
After starting a database query for descriptions select
Grid →  Sample
data grid view … from the menu. The query result list is passed to
the description grid view form and a window as shown below opens. In the
first line the database name is displayed. If you move the mouse cursor
over the database name, a tooltip shows the actual connection paramter.
Sample
data grid view … from the menu. The query result list is passed to
the description grid view form and a window as shown below opens. In the
first line the database name is displayed. If you move the mouse cursor
over the database name, a tooltip shows the actual connection paramter.
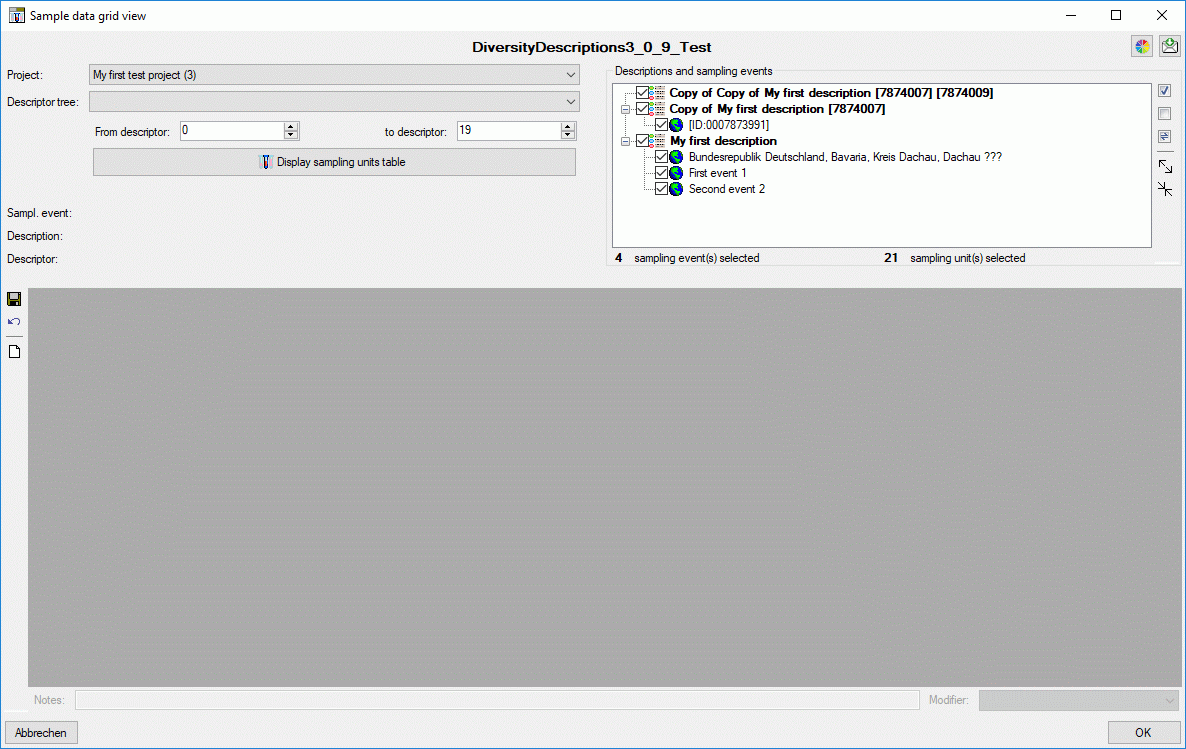
The table in the lower parThe table in the lower part of the window
shows the sampling unit IDs in the first column and the sample data in
the other columns. Each sample column holds the data of a certain
descriptor. The upper part of the window shows the selection parameters
that are used for building the sampling unit table. You may change the
table colors by clicking the button . A form as
shown below will be opened.
Click on buttons categorical, quanitative, text or
sequence to select the corresponding table colors. By clicking the
Reset button below the color, the corresponding
default value will be selected. After changing the table colors by a
click on the OK button, you must re-draw the table.
Selection parameters
In the upper left part of the parameters for the samping unit table can
be adjusted. If in the query list passed to the form descriptions of
different projects are present, the displayed project can be selected
with the Project drop-down box. The entries in the drow-down list
include the project name, followed by the number of descriptions for
that project in brackets and an asterisk (*) if the user has only
read access for that project.
After selecing a project in section Descriptions and sampling events
(right upper part of the window) the descriptions and their sampling
events are listed. Here you may select the descriptions and sampling
events that shall be used for building the sampling unit table. The
buttons  all,
all,  none and
  swap can be used to change
the selection of all tree elements. By pressing the
button the tree view may be expanded to display
the contained sampling events, by pressing the
button only the descriptions will be shown. In the bottom of the section
the currently selected number of sampling events and sampling units is
displayed.
swap can be used to change
the selection of all tree elements. By pressing the
button the tree view may be expanded to display
the contained sampling events, by pressing the
button only the descriptions will be shown. In the bottom of the section
the currently selected number of sampling events and sampling units is
displayed.
When you click on a single sampling event and more than one description
is in the list, the button appears in the tool
strip. By clicking this button you can open a description selection
window and thus shift the sampling event to a different parent
description.
The Descriptor tree drop-down box restricts the descriptor columns
to the descriptors contained in the selected tree. Furthermore the tree
hierarchy is included in the descriptor names if a structured descriptor
tree is selected (see images below).
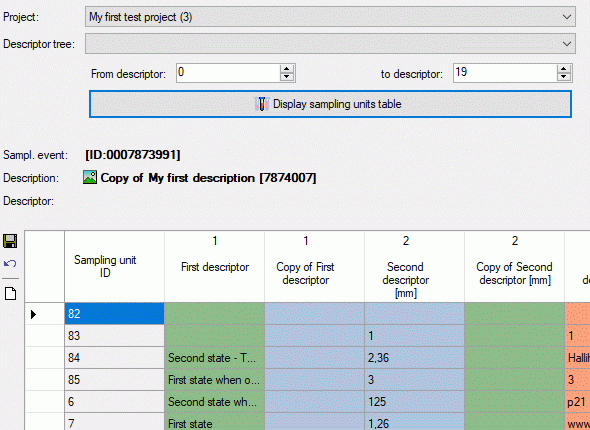
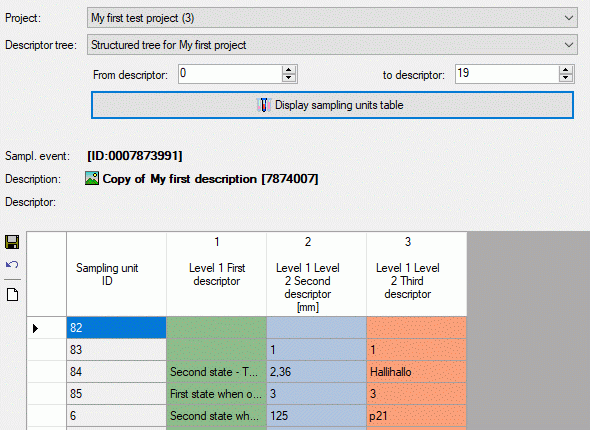
The values From descriptor and to descriptor limit the range of
descriptor sequence numbers that is included in the discription tabe. Be
aware that this restiction is additionally effective to a selected
desriptor tree! If you want to de-activate this restriction, select
“from” value 0 “to” value 999999 by a double-click on the labels From
descriptor rsp. to descriptor. The limitation of the number of
descriptor columns makes speeds up the description table generation,
especally if many descriptor (e.g. some hundrets) are present.
Finally click the button  Display sampling units
table to build a new sampling unit table according to your settings.
During output of the sampling unit table the icon of the button changes
to and you may abort processing by clicking the
button.
Display sampling units
table to build a new sampling unit table according to your settings.
During output of the sampling unit table the icon of the button changes
to and you may abort processing by clicking the
button.
Continue with:
Subsections of Edit Sample Data Grid
Edit Sample Grid
Data editing
The first column of the sampling unit table shows the sampling unit IDs
titles, which are fixed. I.e. if you scroll the sample data to the
right, the IDs are still visible at the left. The other columns show the
sample data, where the descriptor type is indicated by the background
colour: categorical, quantitative, text
or sequence. The column titles include the
descriptor name, the mesurement unit in square bracket for quantitative
descriptors and the descriptor’s sequence number (see image below).

When a sample cell in the sampling unit table is selected, the field
Sampl. event: shows the sampling event titles, field
Description: shows the description title and field Descriptor:
shows the symbols according the descriptor type (
for categorical, for quantitative,
for text and for
sequence) and the descriptor title. If for a descriptor resources are
available, this fact is indicated by a coloured symbol background. You
may view them by a double-click on the descriptor title. If for a
description resources are available, the symbol
is displayed before the title. Double click in
that symbol to view the resources.
For the selected cell the sample data may be edited as described in
section Editing the description - Sample data
tab of this manual. For modified sample
cells the text colour changes to blue and
the sample unit IDs will be shown with yellow background in the table.
Changing the sampling event
To shift samling units to a different sampling event, select the whole
data rows by clicking in the area left from the “Sampling unit ID”
column. In the tool strip the set event button  appears. After clicking the button a window for selecting the new parent
sampling event will be opened (see image below).
appears. After clicking the button a window for selecting the new parent
sampling event will be opened (see image below).
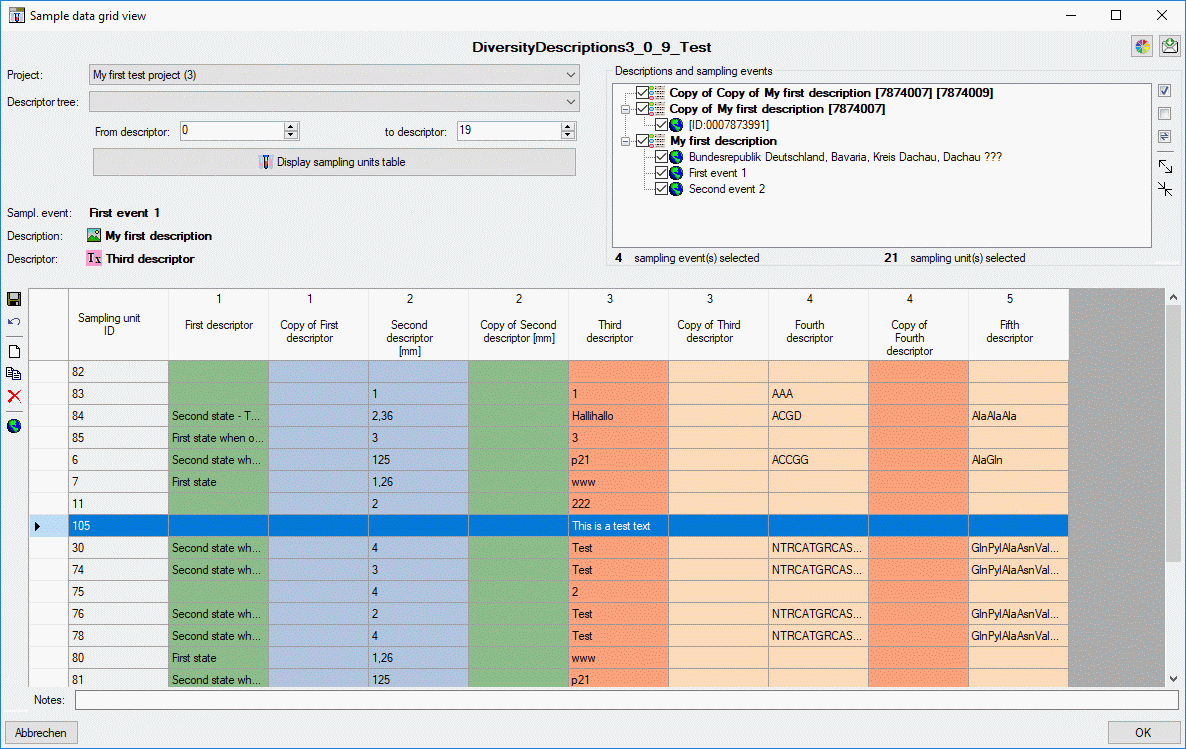
Copy sampling units
To copy one or more sampling units select the whole data rows by
clicking in the area left from the “Sampling unit ID” column. In the
tool strip the copy button appears (see image
below).
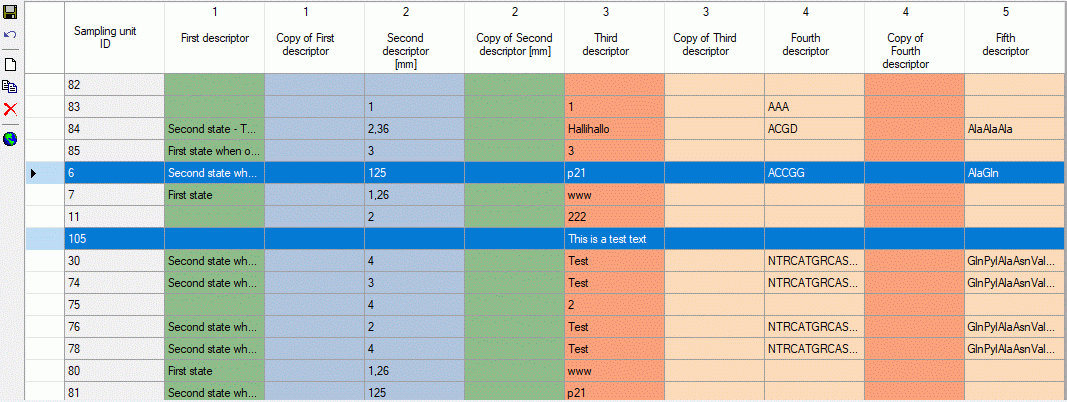
After clicking the button the copied line are
inserte at the end of the tabel (see image below).
Delete sampling units
To delete one or more sampling units select the whole data rows by
clicking in the area left from the “Sampling unit ID” column. In the
tool strip the copy button appears.
New sampling unit
To enter a new sampling, click on button and a new
row will be appended. After clicking the button a window for selecting
the sampling event will be opened.
Continue with:
Edit Sample Data Grid
Save or discard changes
When you click in button “OK” the sample data grig view is closed and
all changes are automatically saved in the database. If you did some
changes and want to save them without leaving the form, simply click on
(see image below). If you close the window, e.g. by
clicking the “Cancel” button, and still have unsaved changes, you will
be asked to save or discard the changes.
Undo all changes
You may discard all unsaved changes without leaving the form by clicking
the undo button and the data will be reloaded form the
database (see image below).
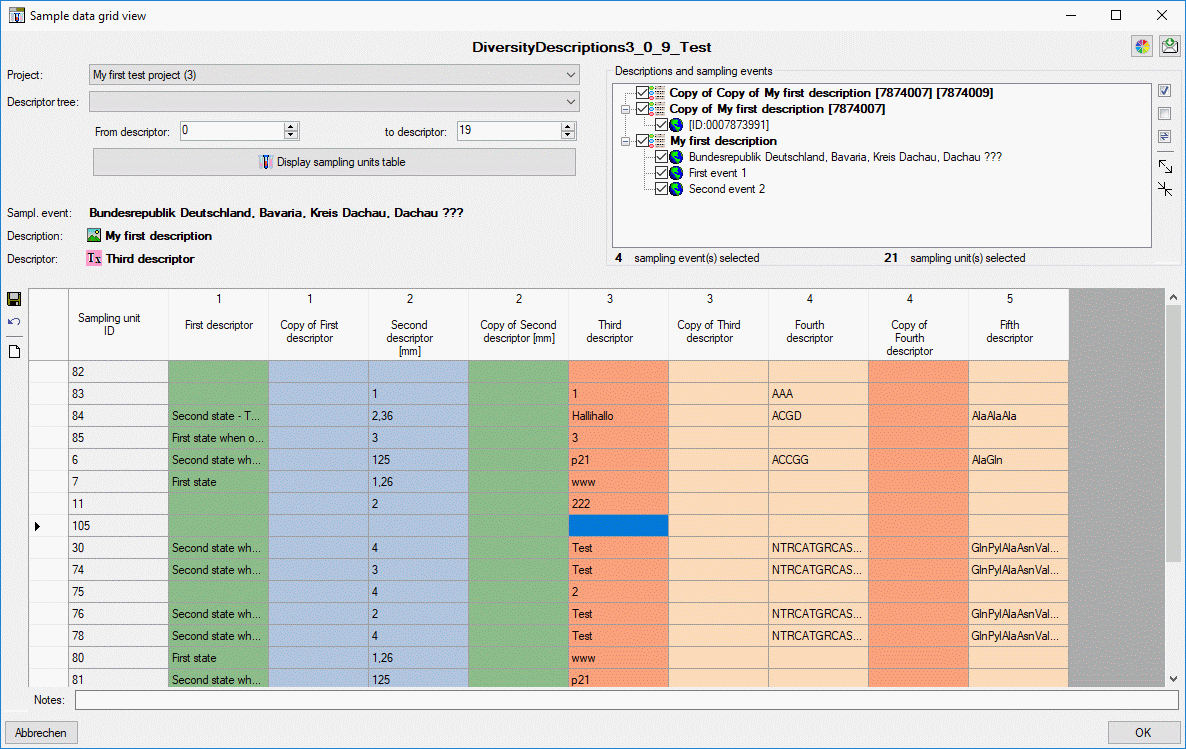
Table Editors
Table editors
For the data selected in the main window the table editors offer a
direct access to the tables of the database. Underneath the menu
Grid select one of the
 Table editors. A window with the content of
the table will open. Columns with a gray background can not be edited
here. Columns with a light gray background are linked to the contents of
lookup tables where you can change according to the contents of these
tables. The following tables are included for direct access:
Table editors. A window with the content of
the table will open. Columns with a gray background can not be edited
here. Columns with a light gray background are linked to the contents of
lookup tables where you can change according to the contents of these
tables. The following tables are included for direct access:
Depending on the edit mode the following options are available in the
Table editors menue:
- Edit descriptions
 Sampling events
to edit the sampling events of the descriptions in the query result
list
Sampling events
to edit the sampling events of the descriptions in the query result
list- Descriptions to edit the descriptions in
the query result list
 Description resources to edit the
resource entries for the descriptions in the query result list
Description resources to edit the
resource entries for the descriptions in the query result list Resource variants to edit the
resource variant entries for the descriptions in the query result
list
Resource variants to edit the
resource variant entries for the descriptions in the query result
list Translations to edit the translation
entries for the descriptions in the query result list
Translations to edit the translation
entries for the descriptions in the query result list
- Edit descriptors:
 Descriptors to edit the descriptors in the
query result list
Descriptors to edit the descriptors in the
query result list Descriptor resources to edit the
resource entries for the descriptors in the query result list
Descriptor resources to edit the
resource entries for the descriptors in the query result list Categorical states to edit the
categorical states of the descriptors in the query result list
Categorical states to edit the
categorical states of the descriptors in the query result list Categorical state resources to edit the
resource entries for the categorical states of the descriptors in
the query result list
Categorical state resources to edit the
resource entries for the categorical states of the descriptors in
the query result list- Resource variants to edit the
resource variant entries for the descriptors and categorical states
in the query result list
- Translations to edit the translation
entries for the descriptors and categorical states in the query
result list
- Edit projects
 Project to edit
the projects in the query result list
Project to edit
the projects in the query result list Descriptor tree node
resources to edit the resource entries for the descriptor tree
nodes of the projects in the query result list
Descriptor tree node
resources to edit the resource entries for the descriptor tree
nodes of the projects in the query result list- Resource variants to edit the
resource variant entries for the descriptor tree nodes of the
projects in the query result list
- Translations to edit the translation
entries for the projects in the query result list
As an example see below the table editor window for projects.
Read-only
If for parts of the query result no write access exists, the table
editor will be opened in read-only mode. Especially for descriptors you
should keep in mind that they may belong to more than one project.
Therefore the table editors for descriptors, categorical states and
their resources or resource variants may be opened for read-only, if you
have not write permissions for all projects in the database.
Editing
You can either edit the contents of the table directly or perform
changes to any number of marked fields. To mark a whole column use
the button. Once you have selected the
contents to change, select one of the modes of change that appear in the
upper left corner. The modes of change are:
- Insert: Insert the given value at the beginning
of the content
- Append: Append the given value at the end of
the content
- Replace: Replace a string in the content with
the given value
- Clear: Remove the content
After selecting the change mode, enter the text in the field where
necessary and click on the corresponding button to perform the changes.
If you want to delete a line in the database, select it by clicking in
the space before the line and press the delete button.
Take care that an undo of that action is not possible.
Filtering
To filter the content of the table, click in the column that should be
used for filtering. Then choose the mode of comparision:
- = : The content must be exactly like the given value
- ~ : The content must contain the given value
- ≠ : The content must be different to the given value
If you want the filtering to be case sensitive, choose the
 a<>A option. After all parameters are set,
click on the
a<>A option. After all parameters are set,
click on the  filter button. To undo the filtering, click
on the
filter button. To undo the filtering, click
on the  button. This will reset the data to the
last saved version. If you want your changes to be saved, click the
button before you reset the filtering. If you close
the window all changes so far will be saved automatically. If you do not
want to save your changes, click on the
button. This will reset the data to the
last saved version. If you want your changes to be saved, click the
button before you reset the filtering. If you close
the window all changes so far will be saved automatically. If you do not
want to save your changes, click on the  button to
close the window without saving.
button to
close the window without saving.
Export
To export the data as a tab separated text file, click on the
 button. The file will be automatically saved in
the client-folder.
button. The file will be automatically saved in
the client-folder.
Text Editing
Extended text editor
In the most text fields you can open an extended text editor by
double-clicking the text field, which provides the following features:
- Perform basic text formatting
- Show and convert RTF-like text formatting
- Insert and view links to HTML pages or Diversity Workbench database
entries
Text formatting
In the text fields you may use some HTML mark-ups <b>bold</b>
<i>italic</i> and <u>underline</u> for text formatting (see
image below left). Additionally the tags <br>, <br/> or <br /> may
be inserted to indicate a new text line, but the most common way is to
press the ENTER key instead. The format tags will have an effect if
documents are generated from the database.
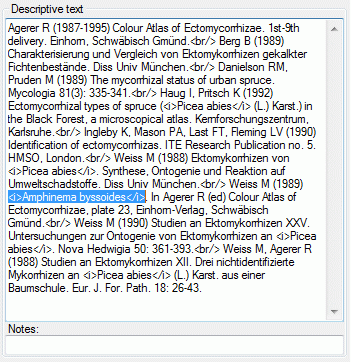
By double-clicking the text field you can open a separate edit window
that shows the text formatting (see image above right). You can easily
change the formatting by selecting a text and clicking the buttons
B, I or U.
To reload the original text into the edit window click the
button. By clicking OK the changes are taken
over to the text field, to ignore the changes, click the cancel button.
RTF-like text formatting
In some projects RTF-like mark-ups are used to indicate text formatting,
e.g. \iitalics\i0{} for italics. If you double-click on the text field
you can open the separate edit window and button  indicates that RTF-like format mark-ups have been detected (see image
below).
indicates that RTF-like format mark-ups have been detected (see image
below).
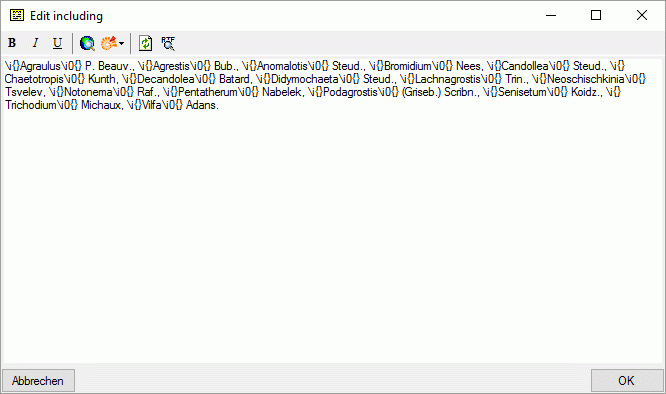 <
<
By clicking the button the edit window will show
you the formatted text (see image below left). After clicking OK the
text will be stored using the HTML mark-ups, which is the standard for
DiversityDescriptions (see image below right).
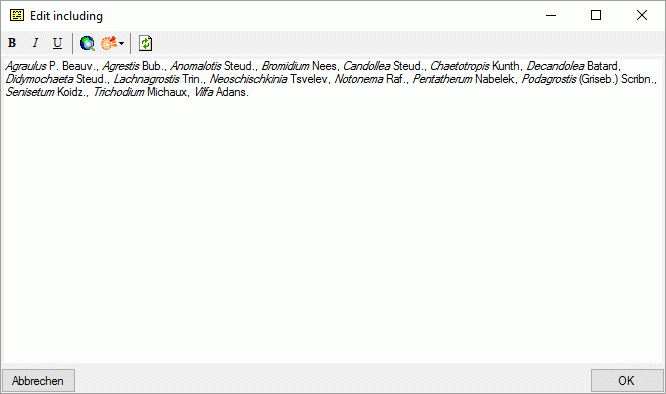
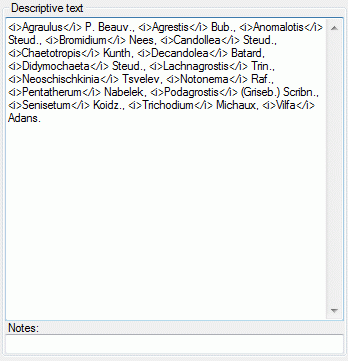
Inserting links into text
You may open an internet browser by clicking the button
. After navigating to your target page, click
OK to insert the link at the current cursor position. By clicking
the drop-down button you can select a
Diversity Workbench database and search for a certain database entry
(see image below).
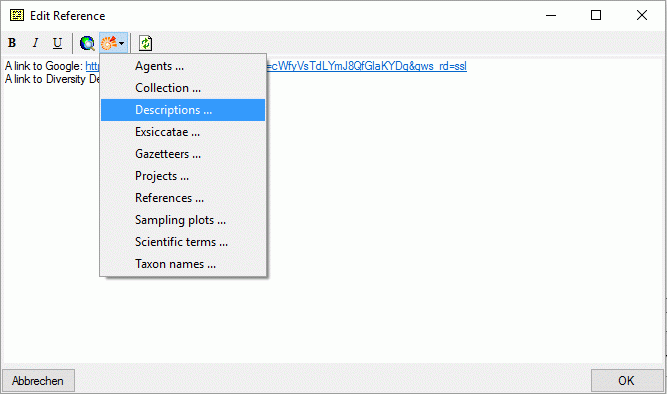
After selecting a found entry and clicking OK the database link is
inserted at the current cursor position (see image below).
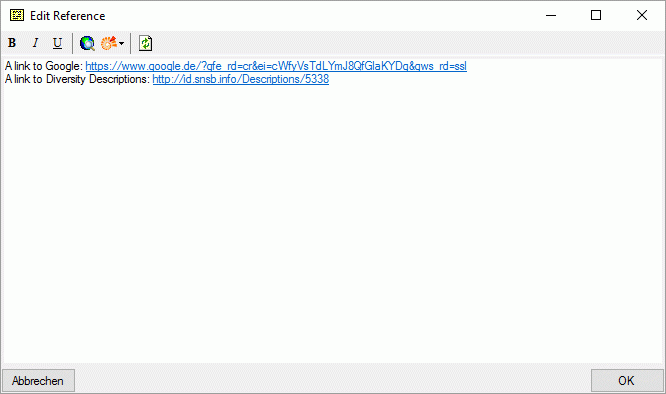
When the link is clicked either the web browser opens (for regular HTML
links) or the Diversity Workbench application to display the databease
entry (see image below).