Tutorial Edit Plots

Tutorial - create or change plots
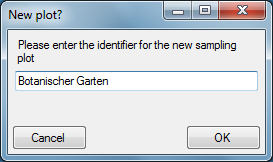
To create a new sampling plot click at the  icon of
the tool bar. A Window will pop up and ask you to enter the identifier
of the new plot.
icon of
the tool bar. A Window will pop up and ask you to enter the identifier
of the new plot.
The new plot will be created and shown on the screen.
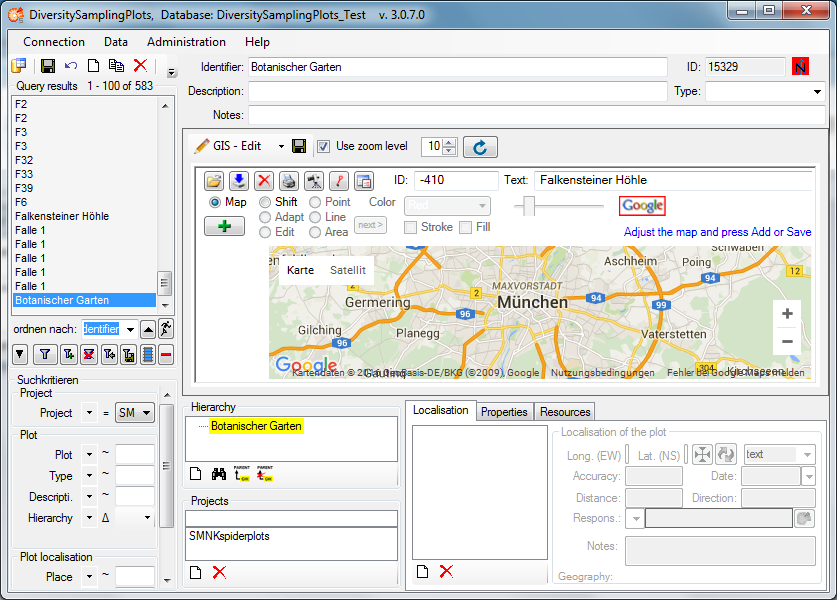
Now you may edit the parameters and either add a geography of any kind using the GIS-Editor window or a certain point with WGS84 coordinates using the Localisation control.
For the usage of the GIS-Editor please see the
Description in the second part
of the help file. You may select an appropriate map style, navigate to
your region of interrest by shiftig and zooming the map and create it as
a background map by clicking the  button. Then select
Point, Line or Area mode and draw your geography on the background map.
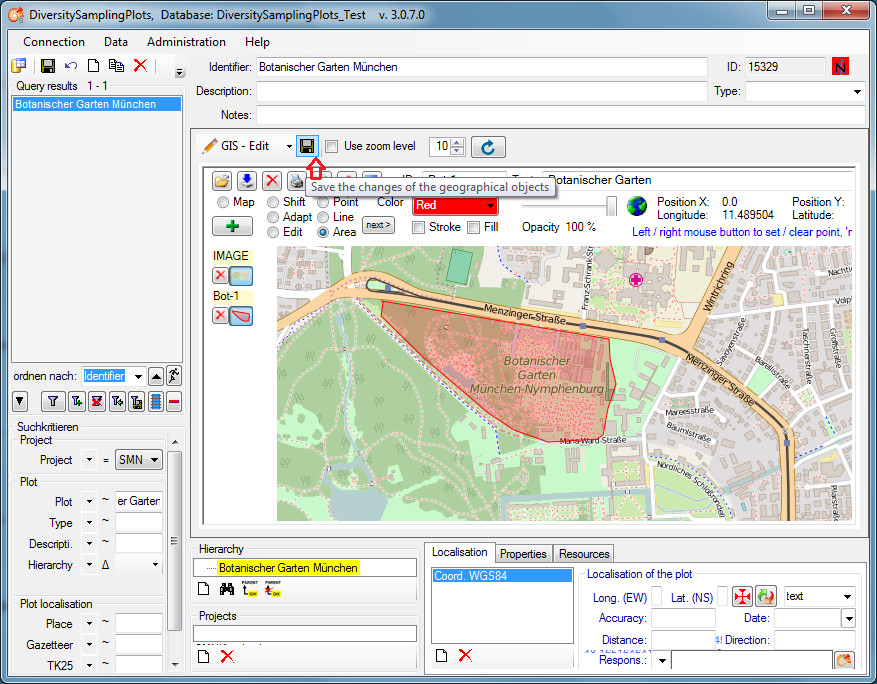
Add one or more geographies using the button. The
geographies may be changed later on using the Editmode of the GIS-Editor. Finally
save the geography to the database by clicking on the
button. Then select
Point, Line or Area mode and draw your geography on the background map.
Add one or more geographies using the button. The
geographies may be changed later on using the Editmode of the GIS-Editor. Finally
save the geography to the database by clicking on the
 button of the GIS-Edit window ( not that of
the Query toolbar!). A WGS84 localisation will be created
automatically.
button of the GIS-Edit window ( not that of
the Query toolbar!). A WGS84 localisation will be created
automatically.
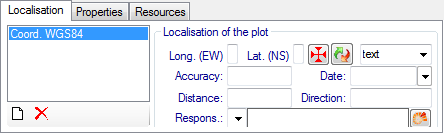
Alternatively you may create a WGS84 localisation using the
button in the Localisation tab below the GIS-Edit
window. A dialog will pop up.
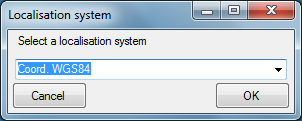
Select “Coord. WGS84” from the drop down list and then press the OK butten. The new localisation will be shown in the list of the Localisation tab.
Select the localisation in the list and click at the  button. The coordinates window as known
from other DiversityWorkbench modules will be shown.
button. The coordinates window as known
from other DiversityWorkbench modules will be shown.
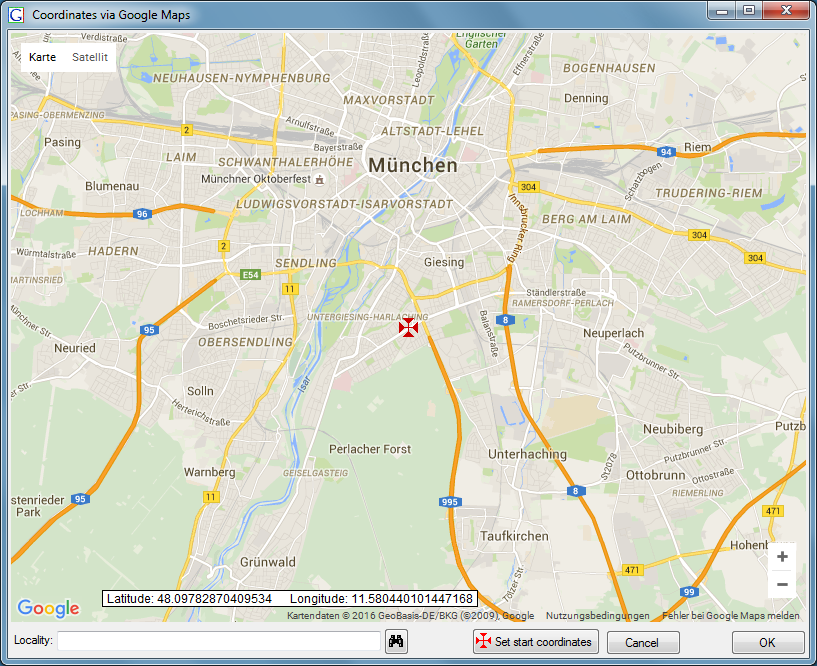
Shift the map using the mouse to localise a certain coordinate point with the static cross in the center. Then press the OK button and the coordinate point will be shown in the WGS84 localisation tab.
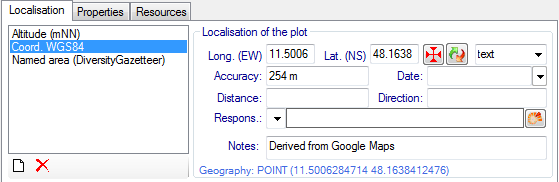
Additionally an Altitude and a Named area localisation will be created
automatically by calling the Geonames web service. Press the
button of the Query toolbar to save the new
localisation.