Diversity Scientific terms

Chart
The module DiversityScientificTerms provides other modules the option to
query the terms on basis of a chart. These charts are created on basis
of the selected terminology or sections and in case there are sections
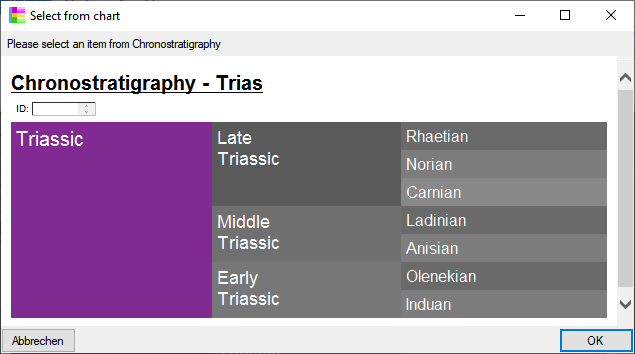
available To test the chart of the current terminology, select Test -
 Chart
from the menu. In case there are sections a window will open where you
choose the data you want to show in the chart. A window as shown below
will open. To test the chart, select an entry and click OK.
Chart
from the menu. In case there are sections a window will open where you
choose the data you want to show in the chart. A window as shown below
will open. To test the chart, select an entry and click OK. 
Ranking terms resp. types
The chart is not available for ranking terms resp. types  .
.
Sections
Terminologies may contain  sections. If no sections are available, only the whole terminology will be presented (see below).
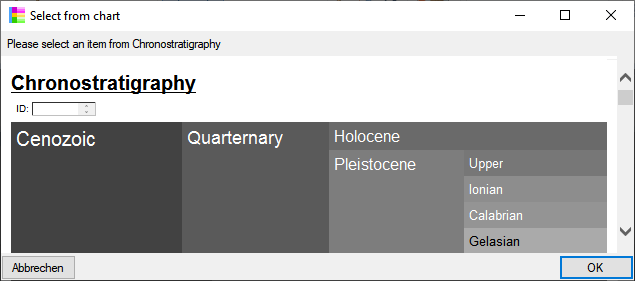
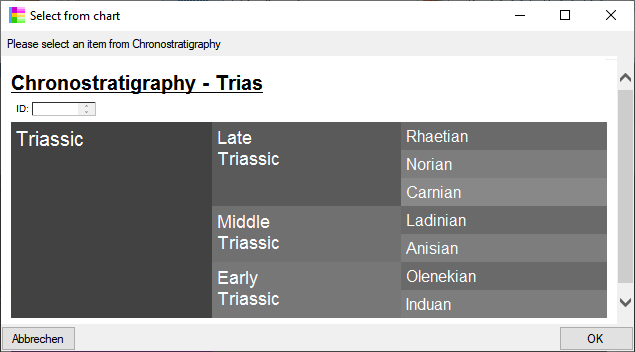
If the terminology contains sections, you can choose either the whole terminology or a section. If you choose a section only the terms within the section will be shown and the name of the section is shown in the header (see below).
Images
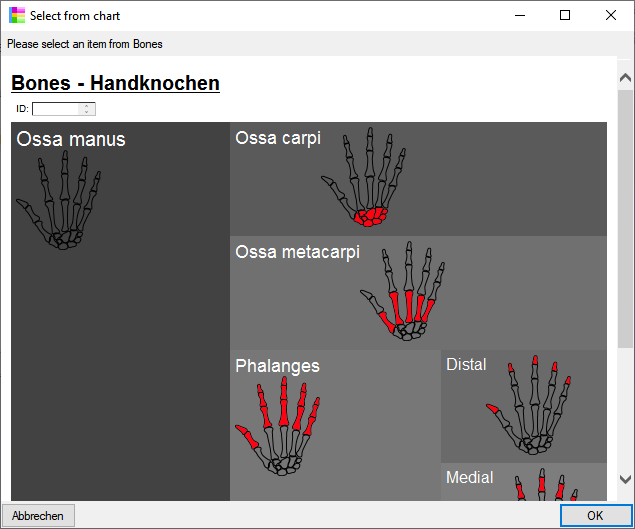
If a term has  images, these images will be shown in the chart as shown below. The images will be shown according to the order
set for the images. If a title for an image has been defined, this will
be shown in the tool tip when you moove the mouse above the image. If no
title has been defined either the synonyms the term will be shown or if
no synonyms are defined the display text of the term. The width of the
images is restricted to 100 pixel, larger images will be adapted
accordingly.
images, these images will be shown in the chart as shown below. The images will be shown according to the order
set for the images. If a title for an image has been defined, this will
be shown in the tool tip when you moove the mouse above the image. If no
title has been defined either the synonyms the term will be shown or if
no synonyms are defined the display text of the term. The width of the
images is restricted to 100 pixel, larger images will be adapted
accordingly.
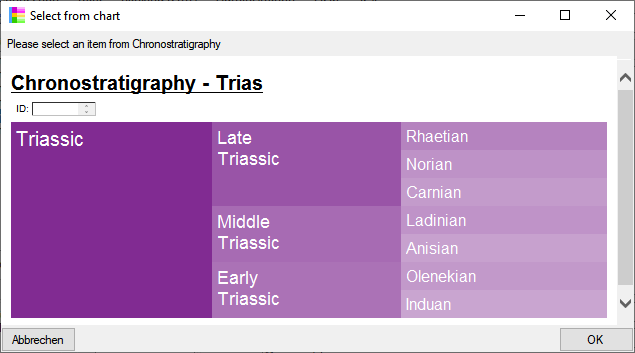
Colors
Every term may have display color  . Click on the set
color button to select a color for the term. This color will be
shown as background for the term as shown below. If no color has been
choosen, a greyscale value will be used as background as shown above.
. Click on the set
color button to select a color for the term. This color will be
shown as background for the term as shown below. If no color has been
choosen, a greyscale value will be used as background as shown above.
If the terms depending on a term do not have a color of their own and
the inheritance of the color is activated, a hue of the parent term will
be used as shown in the image below. To activate the inheritance of the
color, click on the
 button. It will change to
  and the color will be inherited to depending values as shown in the
image below.
and the color will be inherited to depending values as shown in the
image below.
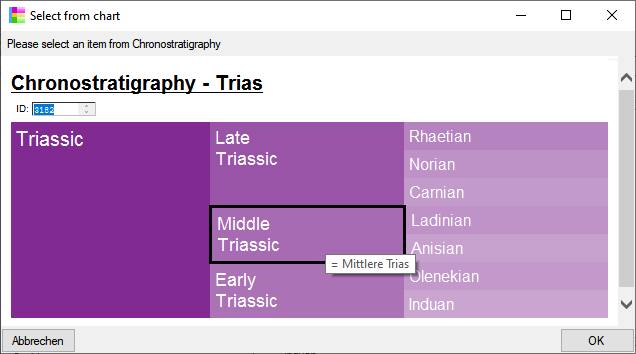
To select an item, click on it so the corresponding ID will appear in the box in the left upper corner. If there are synonyms available for a term these will be shown via a tooltip as shown below.
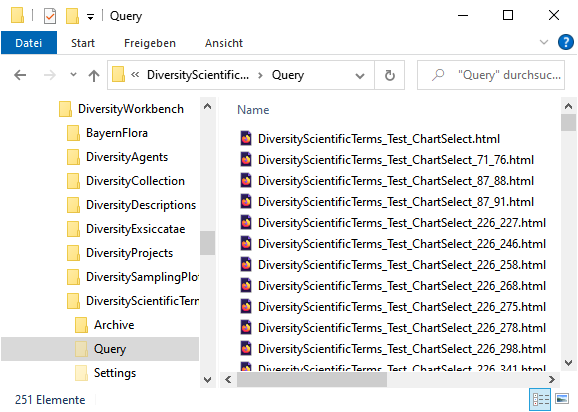
Files
The html files  for the chart will be generated in the user directory as
shown below. The file …_ChartSelect.html is the main file. the other
files like e.g. …_ChartSelect_71_76.html are depending files that
contain the items with the parent ID 71. These files will be removed
when you close the chart.
for the chart will be generated in the user directory as
shown below. The file …_ChartSelect.html is the main file. the other
files like e.g. …_ChartSelect_71_76.html are depending files that
contain the items with the parent ID 71. These files will be removed
when you close the chart.
The html files and the chart are adapted to the width of the window of your application, so if you change the width of your main window, the files will be regenerated to ensure that the displayed columns fit into the available space. In the examples below, the chart has been selected with two different widths that result in a regeneration of the files.
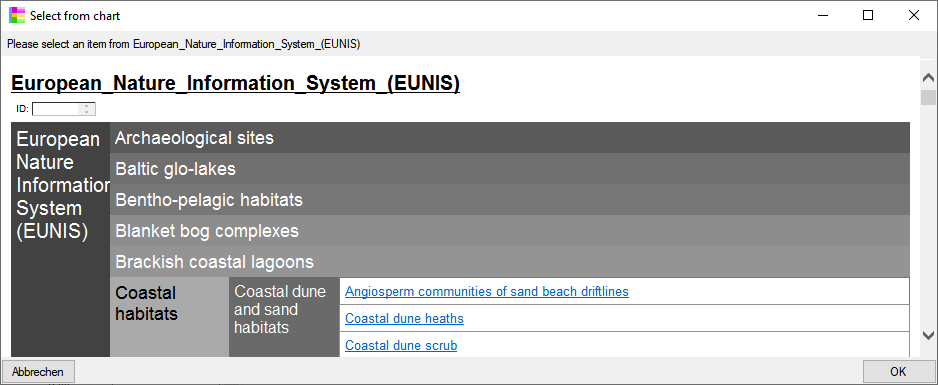
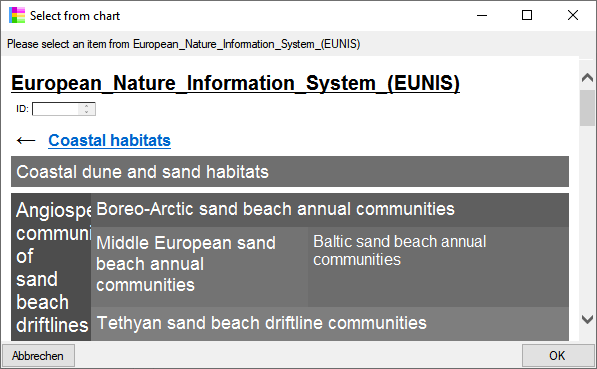
The html file below has been generated with a reduced with of the window with the links to subpages starting on a higher level. The fields with a colored background let you select the displayed items while the fields with a link lead you to a subpage containing depending items (e.g. Coastal dune and sand habitatas in the example below).
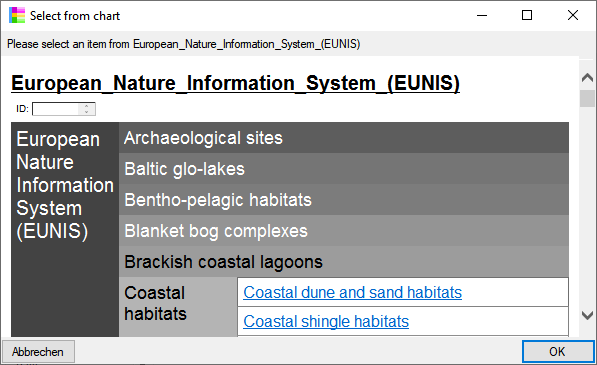
A field with a link will lead you to a subpage as shown below. The link at the top of the subpage will lead you back to the page where you came from (← Coastal habitatas in the example below).