Tutorial Maps

Tutorial - show plots on the maps
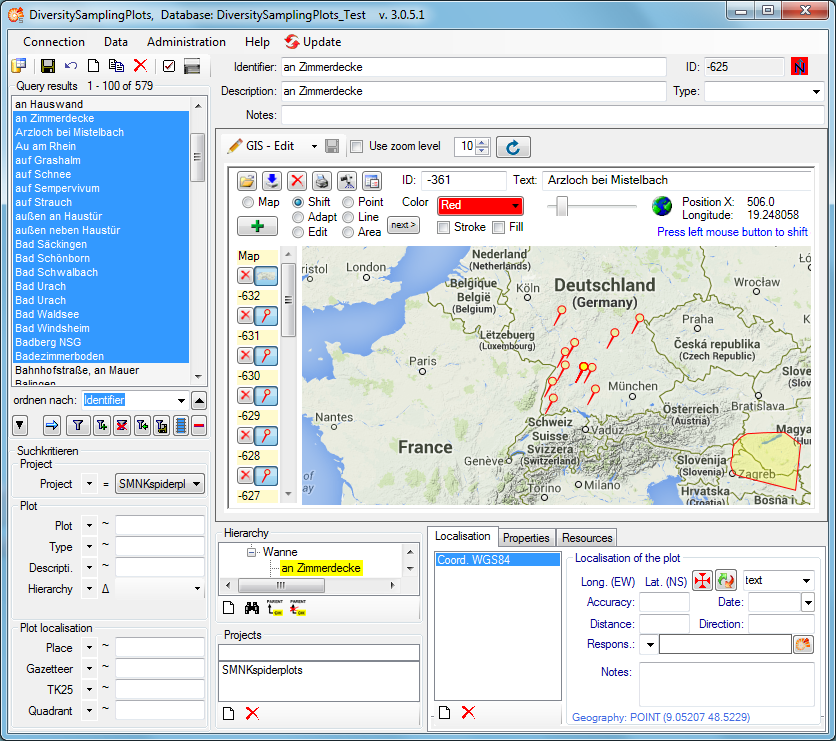
The results list box displays the current set of plots found by the
database query. To show a certain plot on the map, just click at the
entry. Due to the coordinates of the place the map will be adjusted to
this area and build up. There are 3 choices how to display the plot:
 Browser,
  GIS - View and
  GIS - Edit:
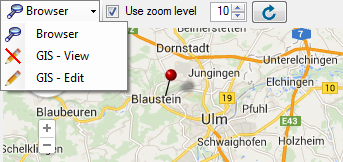
Browser uses a GoogleMaps window and
pins to show the geography of the plot, if any. This is rather fast and
interactive, but there is currently no support of areas or line strings
and no possibility to display more than one plot.
GIS - View uses the powerful GIS
Editor tool of the Diversity
Workbench, which can handle all kinds of geographies and display
distribution maps of multiple plots. Depending on the internet
connection and the map server it can take some seconds until the map
tiles have been build. A message box will pop up to advice the user to
wait, until the map is complete:
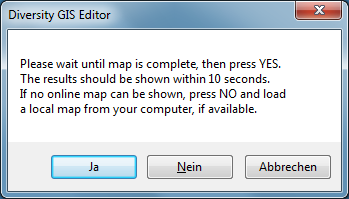
When all tiles of the background map are drawn, press OK to continue. Then the online map will be scanned and frozen and the plots should appear on the map:
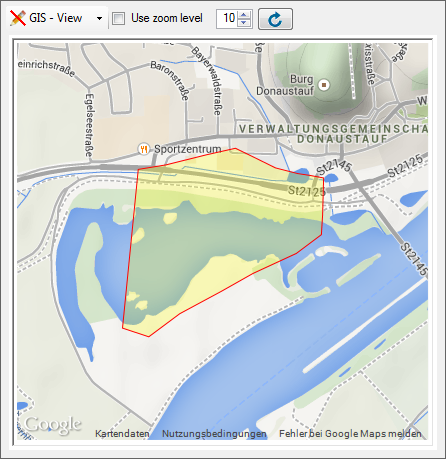
Be aware that this mode is just a viewer of the GIS Editor’s geography
objects. If multiple plots have been selected in the query list box,
press the  reload button to display
them. If you want a certain zoom level for the map, select the Use zoom
level check box and adjust the desired level.
reload button to display
them. If you want a certain zoom level for the map, select the Use zoom
level check box and adjust the desired level.
GIS - Edit provides all controls and
capabilities of the GIS Editor including editing the sample plot. Select
a plot in the query list, then the map will be adjusted and a message
box will pop up according to the GIS - View mode. Press OK to add the
map and the plot to the sample list and display the geography: