Generate Diagram

Generate diagram
This tool allows you to generate charts that show the categorical state
or descriptor usage for one or more sets of descriptions. To use this
tool, choose Data →  Generate diagram
… from the menu. A window with will open as shown below.
Generate diagram
… from the menu. A window with will open as shown below.
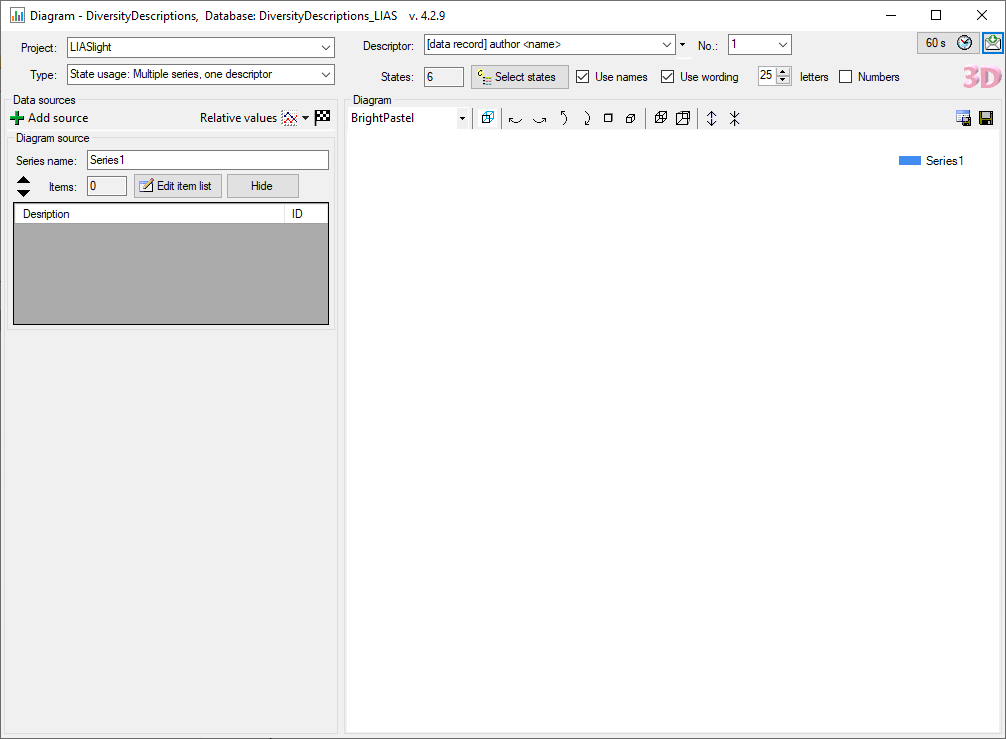
There are the following diagram Types available:
- Categorical state usage for one or more source series
- Categorical state cross-match for one source series
- Descriptor usage for one or more source series
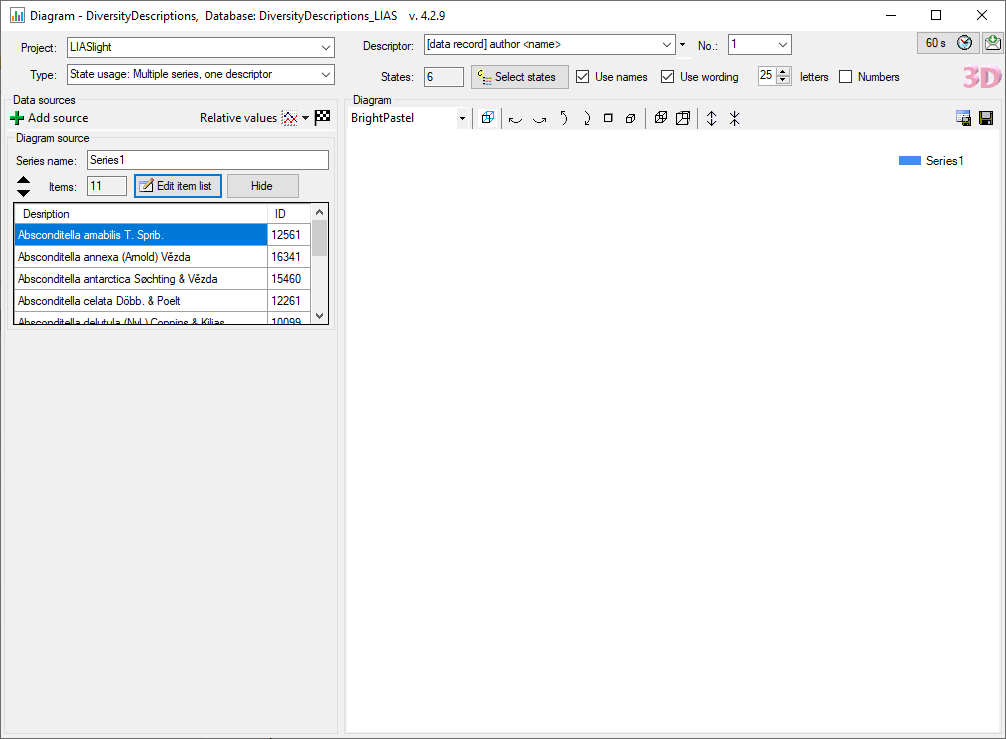
Selecting diagram sources
By default at least one control Diagram source is present in the
area Data sources at the left of the window. Here you select the
descriptions that shall be used as data source for a diagram series. In
text box Series name you can enter a label for the data source that
will appear in the diagram legend. After selecting the Project in
the main window (see image above) click on the button
 Edit item list to open a description
query form (see window below).
Edit item list to open a description
query form (see window below).
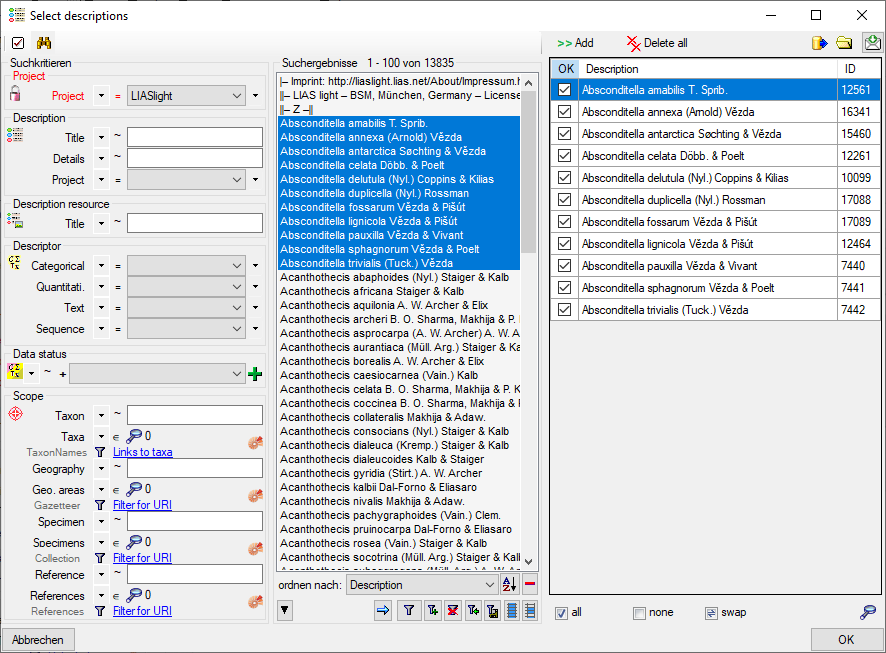
Start a query and select the entries you want to take over into the
result list. By clicking the button  Add you
insert the selected entries. With button
Add you
insert the selected entries. With button  Delete all you can clear the result list. You may select all entries
by clicking the
Delete all you can clear the result list. You may select all entries
by clicking the  all button, deselect all
entries by clicking the
all button, deselect all
entries by clicking the  none button or
toggle your selection by clicking the
none button or
toggle your selection by clicking the  swap button. Finally, click OK to close the query window (see image
below).
swap button. Finally, click OK to close the query window (see image
below).